Environment:
Report
Climate
Issues & Questions
2. How much of today’s atmosphere is CO2?
3. What has been the history of atmospheric
CO2 concentrations?
4. Do we know why CO2 concentrations are
rising?
7. What influence does the Sun have on
global climate?
8. What is known with a high degree of
certainty about the climate system and human influence on it?
11. How accurate are climate models?
13. How accurate are the parameters used in
climate models?
14. How well have models done in
“back-casting” past climate?
15. Is the global warming over the past
century unique in the past 1,000 years or longer?
16. How much does the global climate vary
naturally?
18. Could climate change abruptly?
19. Will sea level rise abruptly?
==============================
The Marshall Institute — Science for
Better Public Policy
Climate Issues & Questions
2004
The debate over the state of
climate science and what it tells us about past and future climate has been
going on for at least 15 years. It is not close to resolution, in spite of
assertions to the contrary. What is often referred to as a “consensus” is
anything but. Many of those making this claim hold a particular point of view
that is based on their “professional judgment” and hypotheses related to that
judgment, not established scientific fact. For others, especially those engaged
in advocacy, the claim of consensus is used to advance their agenda.
Although humanity has been
interested in climate since prehistoric times, climate science is, in fact, a
relatively new field. It is only since the 1970s, which is when models were
developed to connect atmospheric and oceanic climate processes, that scientists
have had the tools to study climate as a system.
At the early stages of almost
every field of science, there are different schools of thought, generally
referred to as paradigms, to explain observed phenomena. Over time, differences
are reconciled by observation, measurement and replication.
That convergence should
eventually happen in the field of climate science. However, at this point, the
politicization of climate science is a barrier to the process leading to convergence.
Concerns about climate change have resulted in some scientists entering the
policy debate because of alarm about either the potential impacts of climate
change or the economic impact of ill-conceived policies. Others, unfortunately,
have entered the debate to advance political or economic agendas, gain funding
for research, or enhance personal reputations by being quoted by the media. To
the extent that the debate is carried out predominantly in the public policy
arena or media, the rigors of the scientific process and establishment are
short-circuited.
This state of affairs creates
misunderstandings and confusion over what we know about the climate system,
past climate changes and their causes, human impacts on the climate system and
how human activities may affect future climate. Policy needs are better served
by clarity and accuracy.
The purpose of this document
is to address a set of fundamental questions about climate change by
summarizing the best available scientific information about them. The
information provided is not intended to rebut claims about human impacts on climate
or the potential for adverse impacts later this century. It is intended to
separate fact from speculation and to demonstrate that while concerns are
legitimate, there is not a robust scientific basis for drawing definitive and
objective conclusions about the extent of human influence and future climate.
The presentation moves from what is well established, to what is not certain,
to what is unknown, and may be unknowable.
QUESTIONS
1. How is the atmospheric concentration of
carbon dioxide (CO2) determined and how accurate are the measurements?
Atmospheric concentrations of
CO2 have been measured directly since 1958. The CO2 concentration in air
bubbles trapped in ice sheets is used to determine atmospheric concentration
for earlier times. The measurements are consistent and accurate.
Direct, continuous measurement
of atmospheric CO2 concentrations began in 1958 at Mauna Loa, Hawaii.
Additional measurement points have been added since that time.1 These
measurements are extremely accurate and show a seasonal variation in CO2
concentration in part due the growth and decay of plant matter over the course
of the year. They also show that atmospheric CO2 concentrations are essentially
constant around the world.
CO2 is long-lived in the
atmosphere, and emissions during any single year are a small fraction of the
total amount of atmospheric CO2. As a result, CO2 emissions are well mixed in
the atmosphere, and a ton of CO2 emitted anywhere in the world has the same
effect on atmospheric concentrations. This fact demonstrates the importance of
focusing more attention on CO2 emissions in developing countries where reducing
their growth can be highly cost-effective.
The record of atmospheric CO2
concentrations for periods before 1958 has been reconstructed using ice core
data. The ice sheets that cover Antarctica, Greenland, the islands north of
Canada and Russia, and the tops of some mountainous areas, represent the
accumulation of as much as several hundred thousand years of snow fall. In very
cold, dry areas, such as the interior of Greenland and Antarctica, the record
is particularly good because there is little year-to-year evaporation or melt,
and snow compresses into annual layers of ice. These annual layers of ice
contain small bubbles of air that were trapped when the snow fell. By carefully
analyzing the air in these bubbles, it is possible to determine atmospheric
composition over time. The longest time series of atmospheric CO2
concentration, from the Vostok Station in Antarctica, is over 400,000 years
long. Ice core data on CO2 concentration from Greenland and Antarctica are in
good agreement, indicating that the measurements are accurate reflections of
past conditions.
For still longer times in the
past, atmospheric concentration of CO2 is estimated by studying the balance
among geochemical processes, including organic carbon burial in sediments,
silicate rock weathering, and the effects of volcanic activity.2 These studies
provide estimates for atmospheric concentration of CO2 for as far back as 25
million years. Data from geochemical studies are less certain than data from
ice cores or direct measurement.
2. How much of today’s atmosphere is CO2?
The atmosphere is comprised of
many gases. CO2, a greenhouse gas, represents 0.037% of today’s atmosphere,
while the concentration of water vapor, the most important of the greenhouse
gases, varies from near zero in cold, dry arctic air to more than 6% in humid,
tropical air.
Over 99.9 percent of the dry
atmosphere is nitrogen, oxygen, or argon, which are non-greenhouse gases. The
amount of water vapor in the atmosphere depends on temperature and relative
humidity, ranging from near zero in cold, dry arctic air, to more than 6
percent, in high humidity, tropical air. The other greenhouse gases, carbon
dioxide, etc., account for less than a tenth of a percent of the atmosphere.
3. What has been the history of
atmospheric CO2 concentrations?
Atmospheric concentration of
CO2 has varied greatly over time, from a high of more than 380
parts-per-million (ppm) 25 million years ago, to a low of about 180 ppm during
several periods of glaciation over the past 400,000 years. The atmospheric
concentration of CO2 was relatively constant at about 280 ppm for 1,000 years
before 1750. Since 1750, CO2 concentration has risen, reaching about 370 ppm in
2000.
Geochemical studies indicate
that atmospheric concentrations of CO2 were more than 380 parts-per-million
(ppm) about 25 million years ago, higher than they are today. Since that time
they have varied greatly, dropping to as low as 180 ppm during several periods
of glaciation over the past 400,000 years. These drops were followed by rises
to 300 ppm or more during inter-glacial periods. Careful analyses of proxy
temperature and proxy CO2 concentration data indicates that the rise in CO2
concentration followed the rise in temperature, and was probably the result of
increased plant growth during the warmer periods.
Ice core data show that
atmospheric CO2 concentration was constant at about 280 ppm from 1000 to about
1750. After that it began rising, very slowly at first, then somewhat more
rapidly, reaching about 370 ppm in 2000.3 Recently atmospheric CO2
concentration has been rising at about 1.5 ppm per year or about 0.4 per cent
per year. This rate of increase would lead to doubling of atmospheric CO2
concentration from the 280 ppm level in about 175 years. Scenarios that reach a
doubling of atmospheric CO2 concentration in the latter half of this century
are unrealistic. (This topic is discussed in more detail in Question 12.)
4. Do we know why CO2 concentrations are
rising?
The increase in CO2
concentration appears to be the result of human activities, though only about
half of the CO2 emissions that result from human activity accumulate in the
atmosphere. The rest accumulates in the oceans or is stored in the biosphere. 4 Large amounts of CO2 (about 550 billion metric
tons per year) are continually exchanged between the atmosphere, oceans, and
biosphere (the plants and animals of the world). This exchange is roughly in
balance. Human emissions from fossil fuel combustion, deforestation, and other
land-use changes emit about 30 billion metric tons of CO2 per year. About half
of this CO2 is accumulating in the atmosphere. The rest accumulates in the
oceans or is stored in the biosphere as enhanced plant growth. While
deforestation and land-use changes result in the emission about 6 billion tons
of CO2 per year, the biosphere takes up over 8 billion tonnes of CO2 per year,
a net absorption of over 2 billion tons of CO2 per year.4
There is no doubt that human
have contributed to the recent increase in atmospheric CO2 concentrations.
Similar arguments can be made for the role of human activities in the increases
observed in the atmospheric concentrations of other greenhouse gases, e.g.,
methane, nitrous oxide, and fluorinated compounds. However, as the next
question examines, the relationship between these changes in the atmospheric
concentrations and observed changes in climate is not simple. Many other
factors affect climate and their roles must be considered in determining the
effect of human emissions of greenhouse gases on climate.
5. What do we know about the relation
between increases in the atmospheric concentrations of CO2 and other greenhouse
gases and temperature?
During the 20th century
atmospheric concentrations of CO2 and other greenhouse gases rose steadily, but
global average surface temperature rose, then fell, then rose again in a
pattern that showed no relationship to greenhouse gas concentration. CO2 and
other greenhouse gas concentrations were relatively constant from 1000 to 1750,
but the Earth experienced a warm period from 800 to 1200, followed by a cold
period from 1400 to about 1850.
Human emissions of CO2 and
other greenhouse gases rose steadily through the 20th century. These emissions
resulted in increases in atmospheric concentrations of greenhouse gases.
However, global average temperature did not follow the same pattern. While
there are problems in interpreting the surface temperature data base,5 there is
much evidence showing that temperature rose over much of the globe between 1910
and 1940, fell between 1940 and 1975, and has been rising since 1975.6 The fall
in temperatures between 1940 and 1975 was sufficient to raise concerns in the
scientific community about the start of a new ice age.
The observed pattern of
surface temperature change cannot be explained by greenhouse gas emissions
alone. In fact, the Intergovernmental Panel on Climate Change (IPCC) Third
Assessment Report concluded that the rise in temperature during the first half
of the 20th century was due to solar variability.7
If greenhouse gases were the
only factor affecting climate, temperature should have been stable between 1000
and 1750, followed by continual warming. Since there is insufficient direct
temperature measurement data prior to 1861 to make an estimate of global
temperature, climatologists use proxy measures, such as tree ring thickness, to
estimate temperature.
Proxy measurements provide
evidence that from about 800 to 1200, during a period called the Medieval
Climate Optimum, substantial regions of the Earth were warmer than they are
today. By 1400, a cold period, known as the Little Ice Age, had begun. This
cold period lasted well into the 19th century. The warming of the late 19th and
early 20th century seems to be a natural recovery from the Little Ice Age.8
With their detailed analyses of well over 200 proxy climate studies from all
parts of the world, Soon and his co-workers have shown that these two periods were
global in nature and represented significant shifts in the Earth’s climate.9 These
changes in climate are not explained by changes in the atmospheric concentrations
of CO2 and other greenhouse gases, since these concentrations were relatively
constant during most of that period.
6. If temperature changes cannot be
correlated with the increase in atmospheric concentrations of CO2 and other
greenhouse gases, what is causing them?
The climate system is a
complex set of interactions between solar energy, clouds, particulates, water
vapor and other greenhouse gases, and the absorption and reflection of solar
radiation at the Earth’s surface. The general nature of these interactions is
understood by climate scientists, but their details are highly uncertain.
Climate is the result of a
complex set of interactions between natural, and more recently, human drivers.
The most important natural driver is the intensity of solar radiation reaching
the Earth, which is determined by changes in the Sun itself and by shifts in
the Earth’s orbit and tilt. Satellite measurements indicate that the intensity
of solar radiation reaching the Earth changes over the 11-year sunspot cycle.
Astronomers have also determined that the Earth’s orbit and tilt change in cycles
that last up to 100,000 years. These cycles appear to be the cause ice ages and
interglacial periods, but are not of concern when discussing climate on short time-scales.
Solar energy reaches the Earth
as short-wave energy. Not all of it penetrates the atmosphere to the surface.
Atmospheric gases are essentially transparent to short-wave energy, but about
one-third of solar energy is reflected off clouds and particulate material in
the atmosphere. However, not all clouds and particulates reflect solar
radiation; some absorb it. The two-thirds of solar energy that reaches the
surface can either be absorbed by the surface or reflected. Bright surfaces, such
as ice or snow, reflect a large portion of the energy that hits them; dark surfaces,
such as bare soil, absorb most of the energy that hits them.
The second most important
natural driver of climate is the Greenhouse Effect. The Earth has to have a
mechanism for getting rid of the energy that it absorbs, or else it would heat
up and eventually melt. It gets rid of energy by emitting long-wave, or
thermal, radiation. The oxygen, nitrogen and argon that make up 99.9% of the
dry atmosphere are transparent to this long-wave radiation. However, water
vapor and some trace gases in atmosphere, such as carbon dioxide and methane,
absorb long-wave radiation, heating the atmosphere. This process is known as
the Greenhouse Effect10, and the water vapor and the trace gases that can
absorb long-wave radiation are known as greenhouse gases.
A third natural driver is the
presence of particulate matter in the atmosphere. Some particulates, such as
sulfate aerosols, reflect incoming solar radiation and have a cooling effect.
Others, such as the black carbon resulting from fossil fuel combustion, absorb
incoming solar radiation and have a warming effect. These effects are referred
to as the direct effects of particulates. However, particulates also can have
indirect effects. Fine particulates act as nuclei for cloud formation. Low
level clouds reflect solar radiation and thus have a cooling effect. Some high level
clouds can absorb solar radiation and have a warming effect. Understanding the
role of particulates in the climate system is a major research priority because
of the high level of uncertainty about their effects, e.g., it is not known
whether their net effect is warming or cooling.
Volcanic eruptions can change
the level of natural climate drivers by adding both greenhouse gases and
particulates to the atmosphere. Eruptions that throw large amounts of sulfate
particulate into the lower stratosphere have the largest effect. One such
eruption, Mt. Pinatubo in 1992, lowered global average temperature by about
0.5°C (about 0.9°F) in the following year, and affected global climate for up to
three years.11
Human activities can also
affect the climate system by adding both greenhouse gases and particulates to
the atmosphere and by changing the Earth’s surface, which in turn changes the
amount of incoming solar radiation that the surface reflects. Combustion of
both fossil and biomass fuels is the biggest human source of greenhouse gas
emissions, but other activities also contribute. Cement manufacture emits CO2.
Agriculture and landfills are sources of methane emissions. Fertilizer use and
nylon manufacture are sources of nitrous oxide emissions, and air conditioners
and refrigerators can emit fluorine-containing greenhouse gases. Land-use
changes also can affect the climate system. Clearing land for agricultural use
increases the amount of dark surface that absorbs rather than reflects incoming
solar energy; it also removes trees and plants that absorb and store CO2.
The drivers that affect the
climate system are not independent. They are connected by a complex set of
feedbacks, the most important of which is the water vapor feedback. If the
Earth warms, more water will evaporate and the atmospheric concentration of
water vapor will increase. Water vapor is a greenhouse gas, so increasing its
atmospheric concentration will further increase warming. However, higher
atmospheric concentrations of water vapor will also result in more cloud
formation, which can lead either to cooling or warming. Another feedback is the
sea ice effect. If the Earth warms, some sea ice will melt. Sea ice reflects
most of the incoming solar radiation that falls on it, but the ocean that is exposed
when sea ice melts absorbs most of the radiation that falls on it. Shrinking
sea ice creates further warming.
If there were no other changes
in the climate system, climate sensitivity, which is the change in equilibrium
global average temperature in response to a doubling of atmospheric
concentration of CO2,12 is estimated to be 1.2°C.13 However, when feedbacks are
taken into account, a high level of uncertainty is created. Climate sensitivity
is usually quoted as lying between 1.5 and 4.5°C.14
A further complication to our
understanding of the climate system is the cyclic behavior that it exhibits.
The quickest of these cyclical behaviors, ENSO (El Niño —Southern Oscillation),
which occurs on a 3-7 year period, is well known, but not well understood or
predictable.
On a longer time scale, the
Interdecadal Pacific Oscillation (IPO) warms the sea surface in the Pacific
during its positive periods and cools it during its negative period. The IPO
was negative from 1947 to 1976, roughly corresponding to the 20th century
period of cooling in global average surface temperature, and positive from 1978
to at least 1998, corresponding to a period of rising global average surface
temperature.15 The IPO appears to be superimposed on the shorter ENSO cycle,
which causes changes in sea surface temperatures in the tropical Pacific, but
the relationship between the two is not understood. To further complicate
relationships, the Pacific Decadal Oscillation affects sea surface temperatures
in the northern Pacific, but its is unclear whether this is an independent
cycle or merely the Northern Pacific part of the IPO. The Atlantic also
exhibits cyclic behavior. The North Atlantic Oscillation (NAO) has a positive
phase, which is:
… associated with cold winters over the
north-west Atlantic and warm winters over Europe, Siberia and eastern Asia as
well as wet conditions from Iceland to Scandinavia and dry winters over
southern Europe.16
The NAO turned positive in
about 1970 and has been strongly positive since 1985. As will be discussed
below, climate models do not project or back-cast these cyclical behaviors.
7. What influence does the Sun have on
global climate?
The Sun provides the energy
that drives the climate system. Long-term variations in the intensity of solar
energy reaching the Earth are believed to cause climate change on geological
time-scales. New studies indicate that changes in the Sun’s magnetic field may
be responsible for shorter-term changes in climate, including much of the
climate of the 20th century.
The Sun provides the energy
that drives the climate system, but as described above, solar energy interacts
with the other components of the climate system in complex ways. Clouds, particulates,
and the Earth’s surface can either absorb or reflect solar energy. Absorption
of solar energy has a warming effect, while reflection of solar energy has a
cooling effect. The climate system is further complicated by the effects of
greenhouse gases which absorb solar energy that was earlier absorbed and then
re-radiated by the Earth’s surface. While the climate system is complex, it is
certain that any change in the amount of solar energy reaching the Earth will
have an effect on climate.
The brightness of the Sun, a
measure of the amount of solar energy being emitted, varies with the Sun’s
magnetism over the 11-year sunspot cycle. Satellite measurements indicate that
changes in the intensity of solar energy are too small, about + or -0.08
percent,17 to account for climate change. However, in 1997, two Danish
researchers, Svensmark and Friis-Christiansen, showed that there was a high
degree of correlation between total cloud cover and the intensity of cosmic rays
striking the Earth, which in turn is correlated with the intensity of the Sun’s
magnetic field.18 The changes in cloud cover, 3-4 percent, were large enough to
explain much of climate change. While this correlation has to be tested with further
observation and theoretical analysis, it suggests that the Sun plays an important
role not only in climate change on geological time-scales, but also on climate
variations on a much shorter time-scale.
Scientific interest in
potential feedbacks that could amplify the small observed changes in the intensity
of solar energy has been growing. In its First Assessment Report, the IPCC
dismissed the possibility that changes in solar intensity could have had a
significant impact on climate on a decade- or century-long period.19 However,
in its Third Assessment Report, the IPCC devoted a whole section to mechanisms
for the amplification of solar forcing, i.e., feedbacks.20 The IPCC concludes
that these mechanisms are not well established, but the attention they have
paid to the question is likely to stimulate further scientific research on this
question.
8. What is known with a high degree of
certainty about the climate system and human influence on it?
We know, with a high degree of
certainty, that:
- the surface of the Earth warmed over the past
century;
- increases in the atmospheric concentrations of
CO2 and other greenhouse gases will have a warming effect;
- human emissions of CO2 and other greenhouse
gases are responsible for much of the increase in atmospheric
concentrations of these gases; and
- economic growth trends, particularly in the
developing nations, will increase human emissions of CO2, at least over
the next few decades because economic growth requires energy use and the
dominant source of energy will remain fossil fuels.
These facts are the basis for
concern about potential human impacts on the climate system.
9. What major climate processes are
uncertain and how important are these processes to understanding future
climate?
Key uncertainties in our
understanding of the climate system include the details of: ocean circulation,
the hydrological (water) cycle, and the properties of aerosols. The cumulative
effect of these and other uncertainties in our understanding of the climate
system is an inability to accurately model the climate system. Since models are
the only way to project future climate, our lack of understanding of key
climate processes means we lack the ability to accurately project future
climate.
Many important climate
processes are highly uncertain.
We know that over 90% of the
energy in the climate system is in the ocean currents which play an important
role in distributing this energy around the globe. However, there is a high
level of uncertainty about the mechanisms by which this occurs. Ocean
circulation is often referred to as “thermohaline circulation,” which some
scientists argue is driven by differences in the temperature and salinity of different
regions of the ocean. If this is the case, then changes in global surface temperature
could disrupt ocean circulation patterns, bringing climate changes to various
parts of the globe.21 However, other scientists argue that ocean circulation is
driven by tidal forces.22 This argument is supported by satellite measurements that
show the Moon slowly moving away from the Earth, creating enough energy to
drive the ocean currents.23 If this argument is correct, warming will have no effect
on the ocean currents.
Whichever mechanism drives
ocean currents, we lack detailed understanding of their operation. The
Strategic Plan of the U.S. Climate Change Science Program (CCSP), which was
reviewed and endorsed by the National Research Council, documents this by
stating that:
All major U.S. climate models fail to
adequately simulate several climate processes and their associated feedbacks in
response to natural or anthropogenic perturbations. The oceans store and
transport energy, carbon, nutrients, salt, and freshwater on multiple time
scales and help to regulate and determine climate changes on a continuum of
time scales. Yet some critical ocean phenomena, including ocean mixing and large-scale
circulation features that determine the rate of storage and transport, remain
as key challenges to understand, assess, and model.24
The CCSP Strategic Plan does
not include a specific focus on ocean circulation, but treats the area as one
of the uncertainties that need to be resolved. We know that the hydrological
(water) cycle, including cloud formation and dynamics, plays an important role
in the climate system, but again we lack detailed understanding of its
operation. The CCSP Strategic Plan states:
Other critical processes that are
inadequately represented in climate models include atmospheric convection, the
hydrological cycle, and cloud radiative forcing processes.25
The Strategic Plan devotes a
full chapter to the water cycle and lists a number of research questions aimed
at elucidating the role of clouds in the climate system.26 Aerosols are a third
major area of uncertainty in our understanding of the climate system. Again
quoting the CCSP Strategic Plan:
Research has demonstrated that
atmospheric particles (aerosols) can cause a net cooling or warming tendency
within the climate system, depending on their physical and chemical
characteristics. Sulfate-based aerosols, for example, tend to cool, whereas
black carbon (soot) tends to warm the system. In addition to these direct
effects, aerosols can also have indirect effects on radiative forcing (e.g.,
changes in cloud properties). When climate models include the effects of
sulfate aerosols, the simulation of global mean temperature is improved. One of
the largest uncertainties about the net impacts of aerosols on climate is the diverse
warming and cooling influences of very complex mixtures of aerosol types and
their spatial distribution. Further, the poorly understood impact of aerosols
on the formation of both water droplets and ice crystals in clouds also results
in large uncertainties in the ability to project climate changes. More detail
is needed globally to describe the scattering and absorbing optical properties
of aerosols from regional sources and how these aerosols impact on other
regions of the globe.27
The Strategic Plan calls for
addressing a number of research questions to reduce these uncertainties.
The cumulative effect of these
and other uncertainties in our understanding of the climate system is an
inability to accurately model the climate system. As the National Academies of
Science observed:
… climate models are imperfect. Their
simulation skill is limited by uncertainties in their formulation, the limited
size of their calculations, and the difficulty in interpreting their answers
that exhibit almost as much complexity as in nature.28
Since models are the only way
to project future climate, our lack of understanding of key climate processes
means we lack the ability to accurately project future climate.
10. What tools are available to separate
the effects of the different drivers that contribute to climate change?
Climate scientists use general
circulation models (GCMs) to try to separate the effects of the different
drivers that affect the climate system. These models use mathematical equations
to describe the different processes known to occur in the climate system. GCMs
are extremely complex because they must try to model all of the processes
occurring in both the atmosphere and the oceans, neither of which are
homogeneous, by dividing them into small grid boxes, then modeling change in
small time increments. The resulting computational demand exceeds the capacity
of even the best super-computers.
Scientists have two general
sets of tools for separating the effects of variables in a complex system:
statistical analysis and modeling. The climate system is too complex and
climate data too limited for statistical approaches to work. This leaves
modeling.
Climate models are an attempt
to develop mathematical equations to describe the individual processes that are
known to occur in the climate system, and then solve all of these equations
simultaneously to obtain a description of the overall behavior of the system.
For example, we know that the climate system must obey the fundamental laws of
physics, e.g. that mass and energy must be conserved. We also know that many
processes such as the reflection of radiation from the Earth’s surface and the
warming effect of greenhouse gases will occur. Climate models attempt to
express all of these phenomena as a set of mathematical equations.
While climate models are
relatively simple in concept, their use is extraordinarily complex for several
reasons.
a. The climate system consists of two
inter-connected sub-systems: the atmosphere and the oceans. While the
importance of the atmosphere in the climate system is obvious, it is the oceans
that contain the overwhelming share of the energy in the system. Change in the
atmosphere can be rapid, but change in the oceans is slow. Any calculation of
future climate must take this slow change in the oceans into account.
The physical process taking place in
the atmosphere and the oceans are different. The most advanced climate models,
called coupled atmosphereocean general circulation models (abbreviated AOGCMs,
or just GCMs), attempt to model all the major climate processes in both the
atmosphere and the oceans.
b. Neither the atmosphere nor the
oceans are homogeneous. To deal with the complexity of the real world, many
climate models use a Cartesian grid approach, dividing both the atmosphere and
oceans into a set of boxes or cells.29 The most advanced climate models use a
three-dimensional (3-D) approach in which the atmosphere is divided into cells
that are about 200 miles square and vary in height from a few thousand feet
close to the surface to several miles in the stratosphere. The oceans are also
divided into cells, though the size of ocean cells need not be the same as the
size of atmospheric cells.
Conditions within a single cell are
assumed to be uniform, but we know from practical experience that both the
weather and climate can be very different over a distance of 200 miles,
particularly in mountainous or coastal regions. Computer simulations have shown
that for areas with highly diverse climate, such as Britain, it is necessary to
reduce cell size by a factor of about 7, to about 30 miles on a side, to
accurately simulate some aspects of climate.30 Reducing the length and width of
cells by a factor of 7 increases the computing requirement by a factor of
almost 50, assuming that no reduction is made in the height of the cells. This
is beyond the current capacity of even the best supercomputers.
c. Running a climate model also
requires a set of initial conditions, i.e., the weather conditions around the
globe at a specific time. Climate is a chaotic system, which means that small
changes in initial conditions can result in large changes in output conditions.
One of the ways of handling this problem is to run the model using an ensemble
of varying initial conditions. Output results which are relatively independent
of the initial conditions are probably more robust and believable than output
results which are dependent on initial conditions. While there is agreement
among climate modelers that using the ensemble approach is highly desirable,
the practicalities of computer capacity and availability mean that it is rarely
used.
d. The climate model is run by
calculating the changes indicated by the model’s equations over a short
increment of time—20 minutes in the most advanced GCMs—for one cell, then using
the output of that cell as inputs for its neighboring cells. The process is
repeated until the change in each cell around the globe has been calculated. In
a perfect model, results for the initial cell at the end of the calculation
would be the same as those determined at the start of the calculation. However,
climate models are far from perfect, so the whole process must be repeated and
smoothed using standard numerical calculation techniques. Eventually, a
consistent set of results is determined for the first time step. The whole
process is repeated for the next time step until the model has been run for the
desired amount of time.
11. How accurate are climate models?
Current climate models have
many shortcomings. They cannot accurately model the atmosphere’s vertical
temperature profile, their estimates of natural climate variability are highly
uncertain, and there are large differences in the response of different models
to the same forcing. No climate model has been scientifically validated.
A model’s output is only as
good as its equations and inputs. There is general agreement among climate
scientists on the shortcomings of current climate models and their outputs.
Many lists of these shortcomings exist; the following is taken from the UN’s
Intergovernmental Panel on Climate Change (IPCC) Third Assessment Report. The
term “forcing” used several times in this list means a factor that can drive
climate change.
- Discrepancies between the vertical profile of
temperature change in the troposphere seen in observations and models.
- Large uncertainties in estimates of internal
climate variability (also referred to as natural climate variability) from
models and observations.
- Considerable uncertainty in the
reconstructions of solar and volcanic forcing which are based on limited
observational data for all but the last two decades.
- Large uncertainties in anthropogenic forcings
associated with the effects of aerosols.
- Large differences in the response of different
models to the same forcing.31
Other lists typically add
uncertainties about the roles of clouds and ocean currents in the climate system,
the inability to model El Niño and other observed cyclic phenomena in the
climate system, and the sensitivity of the climate system to changes in
greenhouse gas concentrations to the IPCC’s list.
The last point on the IPCC’s
list, large differences in the response of different models to the same
forcing, is perhaps the most indicative of the limitations of current climate
models. These differences occur because different climate models use very
different mathematical representations of the same climate processes. They do
this because there still is no agreement among climate scientists about the physics
of some key climate processes, such as cloud formation. The quality of climate
models cannot improve until there is a better understanding of these key climate
processes.
The Summary for
Policymakers of the science portion of the IPCC’s Third Assessment Report
claims: “Some aspects of model simulations of ENSO, monsoons and the North
Atlantic Oscillation, as well as selected periods of past climate, have
improved.”32 However, the underlying report gives a much less positive view of
the state of climate models:
Considerable improvement have taken
place in modeling ocean processes. … These improvements have contributed to
better simulations of natural large-scale circulation patterns such as El Niño
– Southern Oscillation (ENSO) and the oceanic response to atmospheric variability
associated with the North Atlantic Oscillation (NAO). However, significant
deficiencies in ocean models remain (emphasis added). Boundary currents in
climate simulations are much weaker and wider than in nature, though the
consequences of this fact for global climate sensitivity are not clear.
Improved parameterization of important sub-grid processes, such as mesoscale
eddies, have increased the realism of simulations, but important details are
still under debate. Major uncertainties still exist with the representation of
small-scale processes, such as overflows and flows through narrow channels, western
boundary currents, convection, and mixing.33
Elsewhere the Third Assessment
Report details the problems with climate model simulations of El Niño,34
concluding as the summary statement did that while models have improved, there
are still significant shortcomings in their simulations. Given the importance
of the El Niño cycle in the world’s climate, ability of climate models to
accurately simulate its behavior is a critical test of their reliability. And longer-term
cyclic behavior, such as the IPO and NAO, are likely to be even greater
modeling challenges, since the understanding of their current behavior is even
weaker than the understanding of El Niño.
Because of these shortcomings,
most climate model outputs do not closely simulate conditions observed in the
real world.35 However, some climate models have been adjusted, or calibrated,
to where they provide a reasonable simulation of some aspects of climate.
Advocates use these simulations to claim that the models are valid
representations of the climate system. They are not.
The difference between calibration
and validation of models is critical. Climate models are routinely
calibrated, or adjusted, to make their output look more like the real world.
However, calibrating a model to produce a realistic simulation of current
climate conditions does not ensure that it will provide realistic projections of
future climate conditions. Realistic representations of current climate or projections
of future climate require a model that has been validated and an accurate set
of inputs. Validation requires that the model be developed using one set of
data, then its output shown to match an independent set of data. At this time,
no climate model has been validated.
12. What is the basis for forecasts of
large temperature increases and adverse climate impacts between 1990 and 2100?
Forecasts of large temperature
increases and adverse climate impacts between 1990 and 2100 are based on the
output of climate models using the IPCC SRES (Special Report on Emissions
Scenarios) Scenarios as input. Concerns about the quality of climate model
output have been discussed in Question 11. Large increases in temperature
depend on three assumptions, none of which are likely.
a. No overt action is taken to control
greenhouse gas emissions. However, a variety of actions, some voluntary, some
mandatory, are currently being taken to control greenhouse gas emissions.
b. Greenhouse gas emissions grow at the
high end of the range of the IPCC emissions scenarios, i.e., CO2 emissions in
2100 that were over five times current CO2 emissions. These high emission scenarios
have been broadly criticized as unrealistic.36
c. The climate system shows a high
sensitivity to changes in greenhouse gas concentrations. Reports from a recent
IPCC workshop indicate that while there is still a great deal of uncertainty, climate
modelers now believe that the climate system is less responsive to greenhouse
gas concentrations than would be required for a 5.8°C temperature rise.37
Forecasts of large temperature
increases and adverse climate impacts between 1990 and 2100 are based on the
output of climate models. The output of a climate model is only as good as the
model’s ability to accurately represent the climate system and the quality of
inputs used. As discussed above, climate models have many shortcomings and none
has been scientifically validated. Equally important, the inputs needed to
project climate for the next 100 years, as is typically attempted, are
unknowable. Human emissions of greenhouse gases and aerosols will be determined
by the rates of population and economic growth and technological change.
Neither of these is predictable for more than a short period into the future.
Faced with an inability to
predict future human emissions, climate scientists use the scenario approach.
The IPCC defines a scenario as “an image of the future” and a set of scenarios
as alternate images of the future.38 Currently, the most widely used set of
emissions scenarios for projecting future climate are the socalled SRES
scenarios published by the IPCC in 2000 in its Special Report on Emissions
Scenarios. This report presents emissions projections for 35 scenarios and
recommended that climate modelers use a sub-set of six “marker” scenarios for
climate projections. These marker scenarios vary dramatically in their projections
of future emissions. Cumulative CO2 emissions between 1990 and 2100, which will
determine atmospheric concentration of CO2, vary by a factor of more than two.
Sulfur emissions in 2100, which will determine sulfate aerosol concentration in
2100, vary by a factor of three.39 If all 40 scenarios are considered the range
of variability is much greater, a factor of more than three in cumulative CO2
emissions and a factor of nearly 8 in sulfate emissions in 2100.
In its Third Assessment
Report, the IPCC used the full range of emissions scenarios and seven different
climate models to project temperature in 2100. This exercise yielded the
oft-quoted projection of 1.4 – 5.8°C (2.5 – 10.4°F) temperature rise between
1990 and 2100.40 It also concluded:
By 2100, the range in the surface
temperature response across the group of climate models run with a given
scenario is comparable to the range obtained from a single model run with the
different SRES scenarios.41
In other words, the uncertainty
due to differences in models was as large as the uncertainty due to the
difference in emissions scenarios.
Most of the attention paid to
these projections has focused on the upper end of the temperature range, since
it would result in the most dramatic impacts. The upper end of the range
depends on the three assumptions described at the beginning of this question,
none of which are likely.
Climate models are not
currently capable of accurately projecting future climate and furthermore it is
clear that the upper end of their climate change projections is unrealistic.
13. How accurate are the parameters used
in climate models?
The scientific level of
understanding of the direct effects of greenhouse gases is high, but the
scientific understanding of the other drivers of the climate system is low or
very low.
A version of the following
figure first appeared in the IPCC’s Third Assessment Report. This version was
published in the CCSP Strategic Plan.42
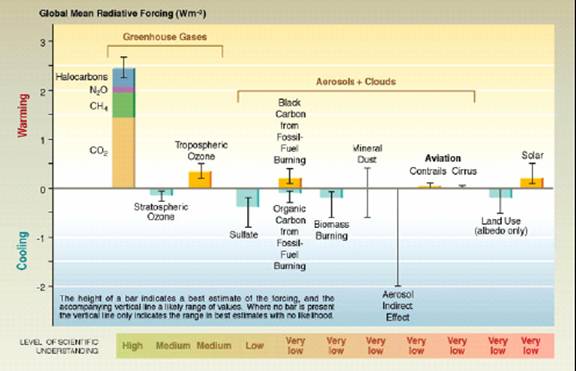
The figure shows that the
direct effects of greenhouse gases are understood with a high level of
accuracy, but the level of understanding of the other drivers of the climate
system is either low or very low. In some cases, understanding of potentially
large effects, i.e., the indirect effects of aerosols, is so poor that it is not
even possible to make a best estimate of its value.
14. How well have models done in
“back-casting” past climate?
Model results that match
global average surface temperature for the past 140 years have been published, but
they are suspect because of: (1) the lack of a greenhouse “fingerprint” in the
temperature record; (2) the quality of the surface temperature data used to
determine global average surface temperature; and (3) the quality of the models
themselves.
In its Third Assessment Report
(TAR), the IPCC concluded: “There is new and stronger evidence that most of the
warming observed over the last 50 years is attributable to human activities.”43
Much of the underpinning for this conclusion was found in a climate model study
that attempted to “back-cast” the global average surface temperature of the
past 140 years using only natural forcings (solar variability and volcanic
eruptions), only anthropogenic, i.e., man-made, forcings (greenhouse gas and
sulfate emissions), or a combination of both natural and man-made forcings. The
key results of this study are shown in the following figure, first published in
the TAR, but then reproduced in the CCSP Strategic Plan. 44
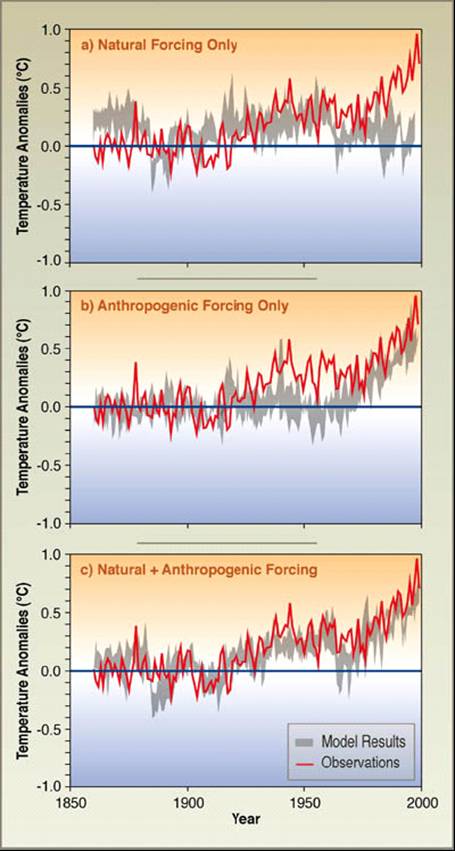
Figure 4-2: Climate model
simulations of the Earth’s temperature variations compared with observed
changes for (a) natural forcing due to solar variations and volcanic activity;
(b) anthropogenic forcing from greenhouse gases and an estimate of sulfate aerosols;
and (c) both natural and anthropogenic forcing included. The model results show
that the forcings included are sufficient to explain the observed changes, but
do not exclude the possibility that other forcings may also have contributed.
The figure purports to show
that natural forcings alone cannot explain the rise in global average surface
temperature over the last 50 years, that anthropogenic forcings do a poor job
of explaining the surface temperature pattern of the first half of the 20th
century, and that, when both types of forcing are taken into account, the model
provides a good fit to the observations.
While the IPCC conclusion
attributing the temperature rise of the late 20th century to human activities
is stated as fact, elsewhere in its report, the IPCC characterizes it as likely,
which is defined as a 66-90% judgmental estimate of confidence that the
statement is true. This represents the collective judgment of the authors,
typically the 10 – 20 Lead Authors responsible for the Chapter in which the
conclusions appears, using the observational evidence, modeling results, and
theory they examined. Such judgmental estimates are not proof, nor do
they provide information about the sources and degree of uncertainty. And as the
NAS points out: “… without an understanding of the sources and degree of uncertainty,
decision-makers could fail to define the best ways to deal with the serious
issue of global warming.”45
Significant uncertainties in
the IPCC’s conclusion arise from:
- the lack of a greenhouse “fingerprint” in the
temperature record;
- the quality of the surface data used to
determine the global average surface temperature; and
- the models used to simulate that surface
temperature.
The natural Greenhouse Effect
is real and plays an important role in determining the Earth’s climate. Greenhouse
gases in the lower to mid-troposphere absorb heat radiated from the Earth’s
surface, warming the atmosphere, which, in turn, further warms the surface.
Climate theory predicts more
rapid warming in the troposphere than at the surface, creating the so-called
greenhouse “fingerprint.” However, satellite temperature measurements show the
troposphere has warmed at a rate of 0.08°C (0.14°F) per decade since 1979.
Surface temperature measurements show warming of 0.2°C (0.36°F) per decade,
more than twice as much, over the same period.46 Data from weather balloons is
in agreement with the satellite data.47
In 2001, the NAS looked at the
data on tropospheric warming, and concluded:
The finding that the surface and
troposphere temperature trends have been as different as observed over
intervals as long as a decade or two is difficult to reconcile with our current
understanding of the processes that control the vertical distribution of
temperature in the atmosphere.48
More recently, Chase, et
al. examined the probability of finding a significant difference in trends
between the surface and troposphere over twenty-year periods using long-term
climate simulations from four climate models.49 They concluded that in no case
did any model output correctly simulate the currently observed situation of a
large and highly significant surface warming accompanied by little or no
warming aloft. Given the inability of these models to simulate observed
conditions, it appears unlikely that they will produce reliable estimates of atmospheric
temperature trends.
The surface temperature data
base has several limitations, including:
- uneven geographic coverage – most of the data
are for industrialized nations, with sparse coverage over much of the
developing world;50
- sea surface temperature measurements that are
more scattered and require more adjustment than the land-based
measurements;51
- the urban heat island effect that IPCC
indicates could account for up to 0.12°C. temperature rise during the 20th
century, one-fifth of the total observed;52 and
- numerous possible errors created by instrument
calibration and siteing problems.53
Concerns about the accuracy
and meaning of climate model results were discussed above in Question 11.
15. Is the global warming over the past
century unique in the past 1,000 years or longer?
The IPCC Third Assessment
Report conclusion that the warming of the 20th century unique in at least 1,000
years was based on a study (by Mann, et al.) that has been shown to be
incorrect by three studies recently published in the peer-reviewed literature.
These studies show that many parts of the world have experienced warmer
temperatures at some time during the last 1,000 years than they did during the
second half of the 20th century and that climate variability is much greater
than indicated by the IPCC.
In its Third Assessment
Report, the IPCC concluded:
… the increase in temperature in the
20th century is likely to have been the largest of any century during
the past 1,000 years. It is also likely that, in the Northern
Hemisphere, the 1990s was the warmest decade and 1998 the warmest year.54
The IPCC defined likely as
having a 66-90% chance of being true in the expert judgment of the authors who
drew the conclusion.
The main support for this
conclusion was a proxy study published by Mann, et al., purporting to
show slowly declining surface temperature for the Northern Hemisphere between
1000 and 1900, followed by a sharp rise in temperature during the 20th
century.55 Their curve has been referred to as the “hockey stick.” Subsequent
scientific work has shown the Mann, et al. study to be deeply flawed and
its conclusions unjustified.56
In 2003, McIntyre and
McKitrick published a reanalysis of the data used by Mann, et al., which
showed that the “hockey stick” was based on four categories of error: collation
errors, unjustified truncation and extrapolation, use of obsolete data, and calculation
mistakes.57 Correcting for these errors, they found that the proxy data showed
higher temperatures for the early 15th century than for the 20th century.
Also in 2003, Soon and his
co-workers published a detailed analysis of over 200 proxy studies from all
parts of the world that demonstrated the existence of both a warm period (the
Medieval Climate Optimum) from about 800 to about 1200 and a cool period (the
Little Ice Age) from about 1400 to about 1850.58 Data providing evidence of
these warm and cool periods argues strongly against the slowly declining
temperature from 1000 to 1900 shown by Mann, et al. The proxy data also
show that many parts of the world have experienced higher temperature at some
point in the last 1000 years than they experienced during the second half of
the 20th century. Soon, et al. did not believe that the proxy data they
collected was of sufficient quality to construct a global average temperature
history for the last 1000 years.
In 2004, van Storch, et al.
published the results of a climate modeling study which showed that the
empirical methods used by Mann, et al. systematically underestimate the
variability of climate.59 Van Storch, et al. concluded that “variations may
have been at least a factor of two larger than indicated by empirical reconstructions.”
These three studies, all of
which were published in the peer-reviewed literature, raise serious questions
about the Mann, et al. study and the IPCC conclusion that was based on
it. They also offer a practical example of both the scientific process and the
risks of short-circuiting it. The scientific process worked as it should in the
debate over the temperature history of the last 1,000 years. One group of scientists,
Mann, et al., published their data and analysis. The analysis had flaws and
those flaws were identified by other scientists who published corrections. Scientists
have long recognized that “it isn’t science until it’s been done twice;” that
is, scientific results should not be considered valid until they have been replicated
or until they have been tested the way Mann, et al.’s results were
tested.
In the case of Mann, et al.,
the correction process took 5-6 years. For most scientific questions this would
have caused no problem. However, during that time the IPCC chose to highlight
the Mann, et al. findings, before they had been validated through the
normal scientific process, and some policy-makers made the conclusions from
Mann, et al. a key part of the policy debate. What should have been an
ordinary scientific question became a political one, to the detriment of the
scientific process.
16. How much does the global climate vary
naturally?
Climate scientists don’t know
the answer to this question, but the available data suggest that natural
climate can change rapidly.
Over the last million years,
the Earth’s climate has shifted dramatically between ice ages and warmer periods
like the present one, called the Holocene. The glacial periods, with major
advances of ice sheets, have generally lasted about 100,000 years, while the
interglacial periods have lasted about 10,000 years. The transition between
glacial and interglacial conditions can take place in less than a thousand
years – sometimes in as little as decades. Such dramatic climatic shifts
occurred near the end of the last major ice age, about 15,000 years ago. First,
a brief warming occurred, and then the ice age returned for roughly a thousand
years. Finally, by 11,500 years ago, the climate quickly warmed again.60 Ice
core data indicate that temperatures in central Greenland rose by 7°C or more in
a few decades. Other proxy measurements indicate that broad regions of the world
warmed in 30 years or less.61
During the last 10,000 years
the climate has remained relatively warm and stable, allowing humans to advance
and prosper. But even during this generally warm period temperature has
fluctuated significantly. About 6,500 years ago, during a period known as the
Holocene Climate Optimum, the climate was warmer than it is today. There is
also evidence that roughly a thousand years ago, during a period called the
Medieval Climate Optimum, regions of the Earth were substantially warmer than
they are today. By 1400 A.D., a cold period, known as the Little Ice Age, had
begun. This cold period lasted well into the 19th century. The warming of the
late 19th and early 20th century seems to be a natural recovery from the Little
Ice Age. 62
Closer to the present, in
2001, the IPCC concluded that the 1990s were very likely the warmest decade,
and 1998 the warmest year, since the beginning of the instrumental temperature
record in 1861.63 However, the rate of temperature rise between from 1980 to
2000 was similar to that experienced between 1920 and 1940, and seems well
within the bounds of natural climate variation.
Climate scientists do not have
a good estimate of natural climate variability on a decade- or century-long
timescale. In 1999, the National Research Council identified obtaining such an
estimate as one of the major challenges in climate science.64 That challenge is
likely to remain unmet for a considerable period into the future. Yet having a
good estimate of natural variability is critical in evaluating whether
projected changes in future climate are significant.
17. What do we know about the extent of
human influence on climate? To what extent has the temperature increase since
1975 been the result of human activities?
The best answer to these
questions is “We don’t know.” Human activities have a number of potential
impacts on climate. Greenhouse gas emissions contribute to warming, as do some
particulate emissions. Other particulate emissions produce cooling. Land-use changes
can produce either warming or cooling, depending on the change. The direct
effects of greenhouse gas emissions are relatively easy to determine, but their
indirect effects, through water vapor and other feedbacks, are poorly
understood. The impacts of other human activities—particulate emissions and
land-use changes—are poorly understood.
18. Could climate change abruptly?
Recently attention has focused
on the potential for climate to change abruptly as the result of human
activities. A common scenario is the onset of an ice age as the result of human
greenhouse gas emissions.
It is now generally agreed
that changes in the Earth’s orbit, which result in changes in the amount of
solar energy reaching the Earth’s surface, are responsible for both ice ages
and the warm interglacial periods between them. This theory was first
popularized in the 1920s by Milutin Milankovitch, a Serbian astrophysicist. He
theorized that three factors controlled the amount of solar energy reaching the
Earth’s surface:
- the eccentricity, or shape, of the Earth’s
orbit, which varies on a cycle of about 100,000 years;
- the tilt of the Earth’s axis, which varies on
a cycle of about 41,000 years; and
- the precession of the equinoxes, which varies
on a cycle of about 22,000 years.
Milankovitch’s theory was
largely ignored for 50 years until a study of deep-sea sediment cores published
in 1976 showed that his cycles did explain large-scale climate changes.65
Subsequent studies of ice core samples from Greenland and Antarctica showed
that in some cases over the past 250,000 years, changes in atmospheric levels
of carbon dioxide followed, rather than preceded, changes in temperature.66
Since increases in greenhouse
gases concentrations should cause warming rather than cooling, the obvious
question is how could warming trigger an ice age? In response to this question,
climate disaster theorists have come up with the following scenario. Warming
will lead to melting of glaciers and ice sheets in Greenland and Antarctica,
which, in turn, will lead to the release of large amounts of fresh water into
northern and southern oceans. These releases of fresh water will shutdown the
thermohaline circulation (such as the Gulf Stream) that currently carries large
amounts of heat from the semi-tropics to higher latitudes. Deprived of this
transfer of heat, the higher latitudes will cool, triggering the next ice age.
While this scenario may sound
convincing, it is not supported by scientific fact. Carl Wunsch, an
oceanographer at Massachusetts Institute of Technology (MIT), points out, the
term thermohaline circulation, which implies that currents like the Gulf Stream
are driven by differences in the temperature and salinity of sea water through
the ocean, is a misnomer. These differences are not strong enough. What drives
ocean currents is the tidal force exerted by the Moon.67 Wunsch’s argument is
supported by satellite data indicating that the Moon is slowly moving away from
the Earth creating the tidal energy necessary to drive ocean currents.68
Even climate scientists who
disagree with Wunsch and argue that warming could weaken thermohaline
circulation reject the disaster scenario. In a recent letter to Science,
Wallace Broecker of Lamont-Doherty Earth Observatory, who first raised concerns
about the effect of warming on thermohaline circulation, rejected both the
speed and the severity of disaster scenario.69
A number of modeling studies
have been conducted on thermohaline circulation in the North Atlantic. The
models used have significant shortcomings, and their output should be viewed
cautiously. Some of these models studies show that warming could cause a
weakening of thermohaline circulation, but the effect of this weakening was far
from an ice age. To quote the IPCC: “… even in models where the thermohaline
circulation weakens, there is still a warming over Europe.”70
In summary, all available
evidence indicates that ice ages are the result of changes in the amount of
solar energy reaching the Earth’s surface, not changes in greenhouse gas
concentrations.
Another “abrupt” climate
change scenario involves massive species extinctions as a result of climate
change. One recent paper by Thomas, et al. studied 1,100 species with
limited geographic range and concluded that a temperature rise of 0.8-1.7°C by
2050 would commit 18 percent of them to extinction.71 However, Thomas and his
co-authors also report that climate change was implicated in the extinction of
only one species during the 20th century, when according to the IPCC, global
average temperature rose by 0.6°C. Is it reasonable to assume that if an 0.6°C
temperature rise caused the extinction of only one species, that 0.8-1.7°C
temperature rise will cause the extinction of 18 percent of the millions of
species on Earth?72 Hardly.
19. Will sea level rise abruptly?
There currently is no
scientific evidence to support concern about rapid sea level rise during this
century. Longer term, the dynamics of glacier and ice sheet melting are too
poorly understood to make reasonable projections.
In a warming climate sea level
will rise for two reasons: (1) because melting glaciers and ice sheets add more
water to the oceans, and (2) because the water in the oceans expand as it
warms. However, as with all parts of the climate system, there are complicating
factors. Sea level also rises and falls due to geological shifts in the land
underlying the ocean and the coast. The polar regions are very dry. However, if
they warm, more moisture can fall as snow and result in more, not less,
accumulation of ice. Finally, the amount of water that is stored in reservoirs
and not allowed to flow to the ocean has to be subtracted from potential sea
level rise.
The IPCC estimates that sea
level rose between 1 and 2 millimeters per year during the 20th century, or about
4 to 8 inches for the century, but that no acceleration of sea level rise was
detected over the century.73 It projects a sea level rise between 4 and 35
inches between 1990 and 2100.74 The upper end of this range depends on
temperature rising to the upper end of IPCC projections to 2100. As discussed
in Question 12, projections of large increases in temperature are dependent on
three assumptions, none of which are likely.
Larger increases in sea level
rise would require rapid melting of either the Greenland or Antarctic ice
sheets. Modeling studies indicate that the Antarctic ice sheets are likely to
gain mass because of increased precipitation, contributing to a decline in sea
level, during the next century. The Greenland ice sheet is projected to lose
mass, but not sufficiently to cause a rapid increase in sea level. Both the increase
in mass of the Antarctic ice sheet and loss of mass of the Greenland ice sheet
are included in the IPCC’s estimate of sea level rise to 2100.
Concern has also been expressed
about breakup to the West Antarctic Ice Sheet (WAIS) because it is grounded
below sea level. IPCC concludes:
However, loss of grounded ice leading
to substantial sea level rise form this source is now widely agreed to be very
unlikely (italics in original) during the 21st century … 75
Very unlikely is defined as having a 1 – 10 percent chance of
occurring. IPCC also points out that the dynamics of the WAIS are poorly
understood, especially for longer time frames, and that disintegration of the
of the Antarctic ice sheets would require conditions that are far beyond those
projected by worst case climate model scenarios. Current understanding of the
behavior of ice sheets is too poor to allow reasonable estimates of their
behavior beyond 2100 to be made.
Endnotes
1. Houghton, J.T., et al. (2001): Climate Change 2001: The Scientific Basis. Contribution of Working Group
I to the Third Assessment Report of the Intergovernmental Panel on Climate
Change. Cambridge University Press, p. 201.
2. Ibid.
3. Ibid.
4. Watson, R.T., et al. (2000): Land Use, Land-Use Change and Forestry. A Special Report of the IPCC. Cambridge University Press, pp. 30-32.
5. Balling, R. (2003): The Increase In Global Temperature: What Is Does And Does Not Tell Us. Marshall Institute Policy Outlook. (http://www.marshall.org/article.php?id=170)
6. Houghton, J.T., et al. (2001): op. cit., p. 3.
7. Ibid., p. 697.
8. Lamb, H.H. (1985): Climate, History and the Modern World. Methuen, 387 pp.
9. Soon, W., et al.(2003): Reconstructing climatic and
environmental changes of the past 1000 years: A reappraisal. Energy and Environment, 14: 233.
10. The term “greenhouse effect,”
coined nearly two centuries ago, is scientifically inaccurate. A greenhouse
stays warm because the closed windows prevent the inside air from cooling by
circulation; the glass does not absorb outgoing infrared radiation.
11. Hansen, J.E.,
et al. (1996): “A Pinatubo climate modeling
investigation.” In The Mount Pinatubo Eruption: Effects on
the Atmosphere and Climate, Fiocco, G. and F. Visconti, G.
Springer Verlag, pp. 232-272.
12. Technically climate sensitivity is
defined as the increase in equilibrium global average temperature as the result
of a doubling of any of the climate system drivers. However, the popular
definition of the term only considers the effect of doubling carbon dioxide concentration.
13. Houghton, J.T., et al. (1990): Climate Change: The IPCC Scientific Assessment. Cambridge University Press, pp. 78.
14. Houghton, J.T., et al. (1996): Climate Change 1995: The Science of Climate Change, Contribution of
Working Group I to the Second Assessment Report of the Intergovernmental Panel
on Climate Change. Cambridge University Press, p. 39.
15. Houghton, J.T., et al., (2001): op. cit., p. 151.
16. Ibid., p. 152.
17. Ibid., p. 380.
18. Svensmark, H. and E.
Friis-Christiansen (1997): Variation of cosmic ray flux and global cloud cover
– A missing link in solar-climate relationships. Journal of Atmospheric, Solar and Terrestrial Physics, 59: 1225-32.
19. Houghton, J.T., et al. (1990): op. cit., pp. 61-63.
20. Houghton, J.T., et al. (2001): op. cit., pp. 382-385.
21. Ibid., p. 562.
22. Wunsch, C. (2000): Moon, tide and
climate. Nature, 405: 743-4.
23. Egbert, G.D. and R.D. Ray (2000):
Significant dissipation of tidal energy in the deep ocean inferred from
satellite altimeter data. Nature, 405: 775-8. 26
24. Climate Change Science Program and
Subcommittee on Global Change Research (2003): Strategic Plan for the U.S. Climate Change Science Program, p. 42.
25. Ibid.
26. Ibid., p. 53-62.
27. Ibid., p. 31.
28. NAS (2001): Climate Change Science: An Analysis of Some Key Questions. p. 15.
29. For a fuller description of the
Cartesian grid approach and for a discussion of an alternate climate modeling approach
based on a spectral approach, see Legates, D.R. (2000): Climate Models and the National Assessment, George Marshall Institute. (http:// www.marshall.org/article.php?id=71)
30. UK Met Office (2001): The Hadley Centre regional climate modeling system. 20 pp.
31. Houghton, J.T., et al.(2001): op. cit., p. 698.
32. Ibid., p. 9.
33. Ibid., p. 419.
34. Ibid., p. 455, and pp. 503-504.
35. As an example, see Dr. Legates’
presentation on how climate models treat precipitation. “Global Warming and the
Hydrological Cycle,” presentation to the Marshall Institute, April 2004.
(http://www.marshall.org/article.php?id=207)
36. See, for example: Ausubel, J.
(2002): Does Energy Policy Matter? George Marshall Institute (http://www.marshall.org/article.php?id=7),
and copies of Castles and Henderson’s letters to the Chair of IPCC and
presentations at IPCC technical experts meetings, available at
www.lavoisier.co.au/papers/articles/IPCCissues.html.
37. Kerr, R.A. (2004): Three Degrees of
Consensus. Science, 305: 932-934.
38. Nakicenovic,
N., et al. (2000): Special Report on Emissions Scenarios. Cambridge University Press, p. 62.
39. Ibid., p. 52.
40. Houghton, J.T, et al.(2001): op cit., p. 13.
41. Ibid.
42. Climate Change Science Program and
Subcommittee on Global Change Research (2003): Strategic Plan for the U.S. Climate Change Science Program, p. 31.
43. Houghton, J.T, et al.(2001): op cit., p. 10.
44. Climate Change Science Program and
Subcommittee on Global Change Research(2003): Strategic Plan for the U.S. Climate Change Science Program, p. 31.
45. NAS (2001): Climate Change Science: An Analysis of Some Key Questions. p. 5.
46. Marshall Institute. (2004): Temperature Changes in the Troposphere: Beyond the IPCC, George Marshall Institute Policy Outlook. (http://www.marshall.org/article.php?id=216)
47. Ibid.; NAS (2000): Reconciling Observations of Global Temperature Change. p. 59.
48. NAS (2001): op cit..
49. Chase, T.N., et al., (2004): Likelihood of rapidly
increasing surface temperature unaccompanied by strong warming of the free
troposphere. Climate Research 25: 185-90.
50. Lindzen, R.S. and C. Giannitsis
(2002): Reconciling observations of global temperature change. Geophys. Res. Ltrs. 29, (26 June).
51. Houghton, J.T, et al.(2001): op cit., pp. 110-112.
52. Ibid., p. 106.
53. Balling, R. (2003): op. cit.
54. Houghton, J.T,
et al.(2001): op cit., p. 2.
55. Mann, M.E., et al. (1999): Northern
Hemisphere temperatures during the past millennium: Inferences, uncertainties
and limitations. Geophys. Res. Letrs, 26:755.
56. An overview of the criticisms can
be found in Muller, R. (2004): Global Warming Bombshell. Technology Review,
http://www.technologyreview.com/articles/04/10/ wo_muller101504.asp?p=0.
57. McIntyre, S. and R. McKitrick
(2003): Corrections to the Mann et al (1998) Proxy Data Base and Northern
Hemisphere Average Temperature Series. Energy and
Environment, 14: 751.
58. Soon, W., et al. (2003): op. cit.
59. Van Storch, H., et al. (2004): Reconstructing Past Climate
from Noisy Data. Scienceexpress. www.scienceexpress.org, Sept. 30, 2004.
60. Alley, R.B., et al. (1993): Abrupt increase in Greenland
snow accumulation at the end of the Younger Dryas event. Nature, 362: 527; and Taylor, K.C., et al. (1997): The Holocene – Younger Dryas transition
recorded at Summit, Greenland. Science, 278: 825.
61. J.T. Houghton, et al. (2001): op cit., p. 140.
62. Lamb, H.H. (1985): op. cit.
63. Houghton, J.T., et al., (2001): op. cit., p. 2.
64. National Research Council, (1999): Global Environmental Change: Research Pathways for the Next Decade. National Academy Press, pp. 127-190.
65. Hayes, J.D., et al. (1976): Variation in the Earth’s orbit:
Pacemaker of the ice ages. Science, 194: 1121-32.
66. Fisher, H., et al. (1999): Ice core records of atmospheric
CO2 around the last three glacial terminations. Science, 283: 1712. Indermühle, A., et al.(1999): Holocene carboncycle dynamic
based on CO2 around trapped in ice at Taylor Dome, Antarctica. Nature, 398: 121.
67. Wunsch, C. (2000): op. cit.
68. Egbert, G.D. and R.D. Ray (2000): op. cit.
69. Broecker, W.S. (2004): Future
Global Warming Scenarios. Science, 304: 388.
70. Houghton, J.T., et al., (2001): op. cit., p. 562.
71. Thomas, C.D., et al. (2004): Extinction risk from climate
change. Nature, 427: 145-148.
72. A fuller discussion of the claim
that climate change will cause massive species extinction can be found in
Kueter, J. (2004): Where are all the Extinct Species, George Marshall Institute Policy Outlook. (http://www.marshall.org/article.php?id=189)
73. J.T. Houghton, et al. (2001): op cit., p. 641
74. Ibid., p. 16.
75. Ibid.
==============================