Report: Racism
New Perspectives on Race and
Ethnicity
Part 2
Desegregation and Resegregation in the
Public Schools
The Racial Gap in Academic Achievement
Schools That Work for Minority Students
Preferential Admissions in Higher Education
==============================
Hoover Institution
http://www-hoover.stanford.edu/publications/books/colorline.html
Beyond the Color Line: New
Perspectives on Race and Ethnicity in America
Edited by Abigail Thernstrom
and Stephan Thernstrom
Hoover Institution Press Publication No. 479
2002
==============================
Abstract
From color-blind to color-consciousness—a counterproductive approach to racial equality?
The American racial and ethnic landscape has been radically transformed over the past three decades. A generation ago, blacks had much less education, much poorer jobs and were more likely to live in solidly black neighborhoods than they are today. Yet the old notion of “two societies, one black, one white—separate and unequal” still persists thirty years after it first appeared in the misguided diagnosis of the Kerner Commission report.
America’s changing racial and ethnic scene is the central theme of Beyond the Color Line. In essays covering a range of areas including education, law, religion, immigration, family structure, crime, economics, politics, and more, this volume examines where we’ve been, where we are, and where we’re going. Along the way, the authors attempt to illuminate how we have moved from Dr. Martin Luther King’s dream of all Americans being judged solely by the “content of their character, not the color of their skin” to today’s vaguely Orwellian civil rights orthodoxy—that it is necessary to treat some persons differently in order to treat them “equally.”
The product of the Citizens’ Initiative on Race and Ethnicity—formed in 1998 as an alternative to the one-sided official “dialogue” on questions of color—many of these twenty-five brief essays offer either explicit or implicit public policy recommendations. A common theme unites them—new realities require new thinking, and old civil rights strategies will not solve today’s problems. Beyond the Color Line takes the first steps toward a new civil rights agenda.
Abigail Thernstrom, a senior fellow at the Manhattan Institute and a member of the Massachusetts State Board of Education since 1995, and Stephan Thernstrom, the Winthrop Professor of History at Harvard University and Manhattan Institute senior fellow, are coauthors of America in Black and White: One Nation Indivisible (Simon & Schuster, 1997) and write frequently for a variety of journals and newspapers, including The New Republic, the Wall Street Journal, and the UCLA Law Review.
Contributors: David J. Armor, Michael Barone, Douglas J. Besharov, Clint Bolick, David Brady, Linda Chavez, William A.V. Clark, Ward Connerly, John J. DiIulio Jr., Tamar Jacoby, Everett C. Ladd, George La Noue, William J. Lawrence, Nelson Lund, Christine H. Rossell, Sally Satel, Thomas Sowell, Shelby Steele, Abigail Thernstrom, Stephan Thernstrom, Martin Trow, Reed Ueda, Eugene Volokh, Finis Welch, James Q. Wilson, C. Robert Zelnick
==============================
Table Of Contents
Foreword ix
John Raisian and Larry Mone
Contributors xi
Introduction 1
PART ONE THE BIG PICTURE
The Demography of Racial and Ethnic Groups 13
Stephan Thernstrom
copyright © 2001 by Stephan Thernstrom
Immigration and Group Relations 37
Reed Ueda
What Americans Think About Race and Ethnicity 53
Everett C. Ladd
Wrestling with Stigma 69
Shelby Steele
PART TWO PRIVATE LIVES AND PUBLIC POLICIES
Residential Segregation Trends 83
William A. V. Clark
African American Marriage Patterns 95
Douglas J. Besharov and Andrew West
Crime 115
James Q. Wilson
Health and Medical Care 127
Sally Satel
Supporting Black Churches 153
John J. DiIulio Jr.
PART THREE ECONOMICS
Discrimination, Economics, and Culture 167
Thomas Sowell
copyright © 2001 by Thomas Sowell
Half Full or Half Empty? The Changing Economic Status of African Americans, 1967–1996 181
Finis Welch
Discrimination in Public Contracting 201
George R. La Noue
PART FOUR EDUCATION
Desegregation and Resegregation in the Public Schools 219
David J. Armor and Christine H. Rossell
The Racial Gap in Academic Achievement 259
Abigail Thernstrom
copyright © 2001 by Abigail Thernstrom
Schools That Work for Minority Students 277
Clint Bolick
Preferential Admissions in Higher Education 293
Martin Trow
PART FIVE LAW
Racial and Ethnic Classifications in American Law 309
Eugene Volokh
copyright © 2001 by Eugene Volokh
Illusions of Antidiscrimination Law 319
Nelson Lund
PART SIX POLITICS
Race, Ethnicity, and Politics in American History 343
Michael Barone
The Politics of Racial Preferences 359
David Brady
From Protest to Politics: Still an Issue for Black Leadership 369
Tamar Jacoby
PART SEVEN ONE NATION, INDIVISIBLE
The New Politics of Hispanic Assimilation 383
Linda Chavez
In Defense of Indian Rights 391
William J. Lawrence
The Battle for Color-Blind Public Policy 405
C. Robert Zelnick
One Nation, Indivisible 415
Ward Connerly
Index 425
==============================
PART FOUR — EDUCATION
Desegregation and Resegregation in the Public
Schools
DAVID
J. ARMOR and CHRISTINE H. ROSSELL
When
the Supreme Court declared the end of official (de jure) segregation
in Brown v. Board of Education in 1954, the public schools became
the center stage for the struggle to promote racial integration and equity in
America. Most of us born by the beginning of World War II will never forget the
graphic images of black children in Little Rock, Arkansas, being escorted into
school buildings by soldiers, surrounded by crowds of jeering white adults.
About a decade later, we saw similar crowds of white adults shouting epithets,
throwing stones, and burning buses when school desegregation moved to the North
in such cities as Pontiac, Michigan, and Boston, Massachusetts. Unlike other
social policies, vehement public protests did little to deter the school desegregation
movement because it was being advanced and enforced by the (almost) politically
immune federal courts.
From
the mid-1960s to the late 1970s a vast transformation took place in American
public schools as federal courts and government agencies demanded
race-conscious policies in every facet of school operations. The most
controversial aspect of school desegregation during this period involved the
rules for assigning students to schools, when racial balance quotas were
adopted instead of neighborhood or other geographic rules. In larger school
districts these racial quotas required mandatory busing, whereby students were
transported long distances from their former school to different schools across
a city or county in order to attain racial balance.
But
school desegregation court orders went far beyond student assignment, with
requirements for racial quotas in hiring, racial balance in the assignment of
faculty and staff, and racial equity in facilities (resources), transportation,
and extracurricular activities. These six desegregation plan components—student
assignment, faculty, staff, facilities, transportation, and extracurricular
activities—became known as the Green factors.
All school systems under court order had to show they had complied with each of
them before they could be declared unitary (nondiscriminating) systems and
released from court orders.1
There
has been much debate about whether school desegregation should be judged a
success or a failure, not just in the attainment of school racial balance but
also with respect to other social and educational goals such as improved race
relations and academic performance of minority children. So far as racial
balance is concerned, initially the most important objective of desegregation
plans, there is general agreement that substantial improvement occurred during
the early 1970s. But some critics, especially Gary Orfield and his colleagues
on the Harvard Project on School Desegregation, have asserted that
resegregation began occurring in the late 1980s and worsened in the early
1990s, particularly as federal courts began declaring school districts unitary
and ending court supervision.2
Although
early Supreme Court school decisions did not address social and educational
outcomes, there is little question that educators and civil rights activists
viewed racial balance as merely a means to an end. According to these views,
the ultimate goal of school desegregation was to reduce racial prejudice and
improve the academic achievement of African American children; schools were to
be the pathway to full economic and social parity with whites.
Assessing
the extent to which school desegregation has achieved these broader goals,
sometimes called extra-Green factors by the courts, is much more
complicated than assessing compliance with the six Green factors.
In particular, we have to assess a myriad of social and educational effects of desegregation,
and to be complete we have to compare these effects with the costs of
desegregation—monetary expenditures, political controversy, white “flight,” and
loss of local control. It is by no means obvious to the average citizen that
school integration, and especially the more intrusive practice of mandatory
busing, has any benefits at all, much less benefits that justify the costs.
Indeed, many Americans believe that mandatory reassignment or “forced busing”
has reduced the quality of education in school districts where it has been
implemented.3
This
essay will summarize the successes and failures of school desegregation with
regard to these issues. First, we assess the impact of desegregation policies
on actual racial balance in the public schools. The evidence indicates that
school desegregation has created substantial racial balance in our public
education systems. Second, we address the issue of resegregation to determine
whether the racial balance established in the 1970s by school desegregation
plans has been reversed by the unitary status findings of the 1980s and 1990s.
We shall show that at least as late as 1995 racial balance trends are not
reversing and that the changes in racial and ethnic isolation discussed by
Orfield are in fact caused by long-term demographic trends of declining white
and increasing minority enrollment, not the dismantling of desegregation plans.
Indeed,
as James Coleman first found, the mandatory reassignment plans of the 1970s
exacerbated these long-term demographic trends by accelerating the decline in
white enrollment, thereby limiting the extent of actual integration in the
school districts in which they were implemented.4 This effect was greatest in our
largest school districts. Finally, we evaluate evidence on the social and
educational effects of desegregation, and especially academic achievement. We
argue that in this area more than any other, school desegregation has failed to
deliver on its promises, in spite of the early optimism of many social
scientists and civil rights activists.
Racial
Balance
Prior
to Brown, most public schools in the South were onerace schools,
either white or black. Ten years after Brown, one study estimated that 99
percent of black children in the South were in one-race schools. The first
nationwide study of school segregation was ordered by the Civil Rights Act of
1964 and carried out by James Coleman and his colleagues during the 1965–66
school year.5 The Coleman report estimated that nationally 65
percent of all black students attended schools that were over 90 percent black,
while 80 percent of all white students attended schools that were over 90 percent
white.
PRE-SWANN
PROGRESS
The
extent of racial isolation in the South was far greater than in the North,
mainly because of de jure segregation in the South. Table 1 shows the
percentage of elementary black and white students in schools over 90 percent
black or white, respectively, for twenty-two of the largest Southern school
districts in 1965 or 1968. Although it is fair to say that some racial integration
had taken place in these Southern cities ten years after Brown, it
was clearly nominal for black students, with the notable exceptions of Kansas
City, Nashville, and Dallas. Indeed, it was precisely this token progress that
led to the Green decision, which called for the elimination of segregated
schools “root and branch.”6
Table
1 Percentage of Black and White Elementary Students in Schools over 90 Percent
Black or White, Southern Cities in 1965–1966 (except as noted)
|
School district |
Blacks in black schools |
Whites in white schools |
|
Birmingham,
Ala.a |
99 |
99 |
|
Mobile,
Ala. |
100 |
100 |
|
Little
Rock, Ark. |
96 |
97 |
|
Miami-Dade,
Fla. |
91 |
95 |
|
Jacksonville-Duval,
Fla.a |
92 |
92 |
|
Tampa-Hillsboro,
Fla.a |
91 |
91 |
|
Atlanta,
Ga. |
97 |
95 |
|
East
Baton Rouge Parish, La.a |
95 |
95 |
|
New
Orleans Parish, La. |
96 |
84 |
|
Kansas
City, Mo. |
69 |
65 |
|
St.
Louis, Mo. |
91 |
66 |
|
Jackson,
Miss.a |
99 |
100 |
|
Charlotte-Mecklenberg,
N.C. |
96 |
95 |
|
Oklahoma
City, Okla. |
90 |
96 |
|
Tulsa,
Okla. |
91 |
99 |
|
Charleston
County, S.C.a |
99 |
99 |
|
Memphis,
Tenn. |
95 |
94 |
|
Nashville,
Tenn. |
82 |
91 |
|
Dallas,
Tex. |
83 |
90 |
|
Houston, Tex. |
93 |
97 |
|
Norfolk, Va.a |
90 |
90 |
|
Richmond, Va. |
98 |
95 |
Source:
U.S.
Commission on Civil Rights, Racial Isolation in the Public Schools (Washington,
D.C.: U.S. Government Printing Office, 1967), pp. 4–5, except as noted.
a Computed by the
authors from the 1968 Office for Civil Rights enrollment data.
Racial
imbalance also existed in Northern cities during the mid-1960s, but racial
isolation was not nearly so extensive. Most Northern school segregation at that
time was thought to be de facto, that is, brought about by the private
decisions of citizens to live in different geographic areas. The highest levels
of racial isolation existed in Chicago, Cleveland, Detroit, Indianapolis,
Milwaukee, and Philadelphia where the black population swelled from
post–WorldWar II migration of Southern blacks looking for jobs in the large urban
centers of the North. This migration overwhelmed the capacity of white
neighborhoods to absorb blacks and still remain integrated, although none but
Chicago approached school racial isolation rates of 90 percent. Other large
cities with sizable, but in some cases smaller, black enrollments such as
Boston, Cincinnati, Columbus (Ohio), Los Angeles, Newark, New York, and San
Francisco had no more than half of their black students in predominately black
schools.
POST-SWANN
PROGRESS
The
situation in the South changed dramatically in the 1970s. In the 1971 Swann decision
for Charlotte-Mecklenburg, North Carolina, the Supreme Court endorsed strict
racial balance quotas for all schools in a system and approved cross-district
mandatory busing to attain complete racial balance.7 In
effect, the Supreme Court abandoned geographic school assignment (i.e., being
assigned to the closest school) for Southern school systems unless it resulted
in racially balanced schools, which was impossible in most larger school districts
because of segregated housing patterns.
Court-ordered
school desegregation moved to the North only two years later with the Supreme
Court’s Keyes decision for Denver, Colorado.8 We
shall not go into the complicated legal basis for Northern desegregation orders,
almost none of which involved state-enforced segregation. Suffice it to say
that despite de facto segregation in the North, systemwide racial balance
remedies and mandatory busing plans were ordered for many Northern districts
after Keyes. In addition, the Department of Health, Education,
and Welfare (HEW) was active in pressuring school systems to implement
desegregation plans, and several school systems adopted mandatory reassignment
plans under this pressure.
As a
result of local civil rights pressure, many other school systems adopted
voluntary transfer plans that involved M to M (majority to minority) transfers
where any student could transfer from a school in which his or her race was in
a majority to a school in which his or her race was in a minority. Another
common local initiative was to close some predominantly minority schools and
reassign the students to predominantly white schools; this was carried out in
such cities as Riverside, California, and Evanston, Illinois. Although these local
measures did not involve mandatory busing of whites, they nonetheless
accomplished some degree of school integration.
Table
2 Prevalence of Formal School Desegregation Plans, 1990
|
Size
of district |
Percent
with past or present desegregation plans |
Percentage
share of black/Hispanic students |
Total
districts in sample |
|
Very
large (N>27,000) |
72 |
53 |
145 |
|
Large
(N>10,000>27,000) |
39 |
22 |
421 |
|
Medium
(N>5,000>10,000) |
34 |
13 |
770 |
|
Small
(N>5,000) |
11 |
12 |
4,012 |
Source:
David
J. Armor, Forced Justice: School Desegregation and the Law (New York:
Oxford University Press, 1995), table 4.1.
The
first reliable data for assessing the impact of school desegregation on racial
balance was collected in 1968 by the Office for Civil Rights in HEW (OCR).9 The
survey consisted of enrollment data by individual schools and by five
racial-ethnic categories (white, black, Hispanic, Asian, and American Indian)
in a sample of school districts. There was no survey in 1969, but from 1970
through 1974 OCR collected data annually. Beginning in 1974, the survey was
conducted every other year and included all districts with court-ordered
desegregation plans. The sampling scheme used by OCR varied from year to year,
and thus after 1974 the OCR data do not constitute a representative sample of school
districts. In fact, in some years important school districts are simply
missing.
In
1990 the authors participated in a national survey of school desegregation and
magnet schools sponsored by the U.S. Department of Education, for which a
statistically representative sample of 600 school districts was drawn. The
original sample included all 150 largest school districts in the country, those
with enrollments over 27,000 students, and smaller percentages of the large,
medium, and small districts in the U.S., selected randomly from their size
category.10 In this essay we use this national sample to assess
racial balance trends, relying on OCR enrollment data from Fall 1968 through
Fall 1987 and Common Core of Data (CCD) enrollments from Fall 1989 through Fall
1995.
The
1990 survey gathered information about whether school districts had adopted
formal desegregation plans and what kinds of desegregation techniques were
used. Table 2 shows the percentage of school districts that had past or current
desegregation plans by size of district. The survey estimated from this random
sample that nationally nearly 1,000 school districts had some type of formal
desegregation plan, and the prevalence of formal plans increased with the size
of the school district. Of the 145 “very large” school districts that responded
to the survey, 102—more than 70 percent—had a formal desegregation plan at some
point in time. We note that the largest districts enroll about half of all
black and Hispanic students, while the smallest districts enroll only about
one-tenth of these minority groups. Thus, black and Hispanic students are more
likely to be found in larger districts, which are also more likely to have
school desegregation plans.
Of the
28 percent of very large districts that did not adopt a formal desegregation
plan, most were predominately white districts in the early 1970s, and indeed
many remained predominately white until at least the early 1990s. Examples
include Anoka County, Minnesota; Fairfax County, Virginia; Gwinnett County,
Florida; and Spokane,Washington. These districts were over 90 percent white in
1972 and remained over 70 percent white until at least 1991. Obviously, there
is less need for a formal desegregation plan when there are few minority
students.
How
effective have these plans been in achieving racial balance? To answer this
question, we shall use an index that summarizes the degree of racial balance in
a school system. Racial balance is defined as the degree to which each school’s
racial composition matches the districtwide racial composition for a given
race. The index of racial imbalance, also called the dissimilarity index,
ranges from 0 to 1, where 1 indicates total segregation (all schools are one
race), and 0 means perfect racial balance (every school has exactly the same
racial composition as the total district).11 Intermediate values represent the
proportion of students of one race who would have to be reassigned, if no
students of another race were reassigned, in order to attain perfect racial
balance.12 The index can be computed for any two racial or
ethnic groups; for example, whites and nonwhites, blacks and whites, or
Hispanics and whites.
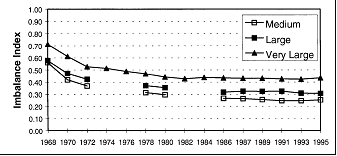
Fig.
1. Trends in black-white school imbalance in medium, large, and very large
districts.
BLACK
TRENDS
Figure
1 shows the trends in black-white racial imbalance from 1968 to 1995, separated
by size of school district.13 All three size categories show significant declines
in black-white imbalance (or increased desegregation), with the sharpest drops
from 1968 to 1972 corresponding to the widespread implementation of
desegregation plans in the South. For very large districts, racial imbalance
continues to decline until 1982 and remains stable thereafter; there is a
slight upturn of just 1 point between 1991 and 1995.
Medium-sized
districts show slight improvements in racial balance until 1991. For the nation
as a whole, then, contrary to Orfield’s claims, there is no evidence of
significant resegregation in terms of increasing racial imbalance as late as 1995.
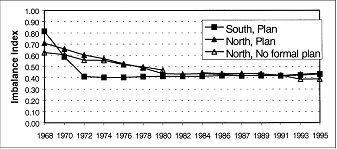
Fig.
2. Trends in black-white imbalance by plan status, very large districts.
There
was, however, substantial variation by region in the timing and scope of
desegregation plans, with Southern districts being the first to desegregate
with comprehensive desegregation plans involving white reassignments. After Swann, most
Southern districts that still had substantial racial imbalance were immediately
back in court and typically ordered to adopt busing remedies along the lines of
the Charlotte-Mecklenburg plan. As a result, comprehensive mandatory
desegregation plans were in place for most Southern districts by 1972.
Northern
mandatory busing remedies did not become commonplace until after the 1973 Keyes decision
in Denver, Colorado. Therefore, implementation of comprehensive desegregation
plans in the North tended to be distributed more evenly throughout the 1970s.
In addition, while most Southern districts had to adopt formal desegregation
plans, there were fewer formal plans in Northern districts primarily because
there was no history of de jure segregation and ongoing litigation associated
with dismantling it. Thus, fewer lawsuits were filed in the North, and
occasionally a lawsuit was dismissed because the courts found only de facto
segregation (e.g., Cincinnati). These different histories, not surprisingly,
produced different patterns of racial balance trends.
Figure
2 shows the trends in black-white racial balance for very large districts—those
that have received most of the attention by the courts and by school
desegregation analysts—separated according to region and formal plan status. We
do not show the small number of Southern districts that said they did not have
formal plans.14 The trends confirm the differences in desegregation
timing in the North and South. As expected, the most dramatic improvements in
racial balance occurred for Southern districts as they rapidly implemented
mandatory reassignment plans in the early 1970s. For Southern districts with
plans, the index of racial imbalance dropped by 40 points in the four years
1968–1972, from an average of 0.81 to an average of 0.41.
The
fact that the average index for Southern school districts was 0.81 in 1968
means that the dismantling of the de jure system of segregation had started
before 1968; had it not, the index would have been 1.0. Freedom-of-choice plans
became popular following enactment of the U.S. Civil Rights Act of 1964, and
they were the primary means of desegregation for many Southern school systems
until the policy was ruled insufficient by the U.S. Supreme Court in the Green decision.
Freedom-of-choice plans increased the number of black students attending former
white schools, but not vice versa, and they are the major reason that the index
was 0.80 in 1968 rather than 1.0.
The
pattern for Northern school systems with plans is quite different from that of
Southern systems with plans, in that the decline in imbalance is less rapid and
is spread evenly throughout the 1970s. The index dropped 36 points during the
decade, from 0.70 in 1968 to 0.44 in 1980, making them nearly as balanced as
Southern districts. Interestingly, Northern districts without formal plans also
experienced desegregation during this period, with the imbalance index
declining from 0.62 to 0.47. This trend is explained by the fact that many
school systems adopted desegregation practices during this time, such as
closing older imbalanced schools, building new schools in easier-to-integrate
locations, and paying closer attention to attendance zone changes, but did not
adopt a formal plan.
After
1980, racial balance trends level off for Southern districts but continue to
improve slightly for Northern districts, and in 1991 all three groups show the
same degree of racial imbalance (0.42). Most important, none of the categories
of school districts shows any dramatic worsening of racial balance between 1991
and 1995, with gains of only 1 or 2 points in the imbalance index for Southern
and Northern districts with plans, respectively. Once again, these data from
the largest 145 school systems in the nation contradict Orfield’s argument that
school districts are resegregating as a result of the dismantling of
desegregation plans.
HISPANIC
TRENDS
In
recent years the Orfield reports have expressed concern about the increasing
segregation and isolation of Hispanic students. This problem did not exist in
the era of de jure segregation because most early court decisions in the South
did not identify Hispanic students as a minority group that was a victim of
discrimination. Indeed, most Southern school districts classified students as
black and nonblack, and Hispanic students were included in the nonblack
category along with white students.
After
the 1973 Keyes decision in Denver, however, where both black and
Hispanic students were found to be victims of discrimination, it became commonplace
to treat all minority (nonwhite) students as a group in student assignments to
achieve racial balance. Interestingly, in a few school districts, such as
Yonkers, New York, the federal court found that only black and Hispanic
students were victims of discrimination, thereby combining Asian students with
white students for the purposes of desegregation. The court agreed with
plaintiffs’ argument that Asian students were not a disadvantaged minority
group, and therefore the Asian minority could be used to desegregate either
black or Hispanic minority students! This same definition is being used in a
recent desegregation plan in Rockford, Illinois. In the vast majority of school
districts, however, Asians are classified as racial minorities and assigned
accordingly.
Fig.
3. Trends in Hispanic-white school imbalance.
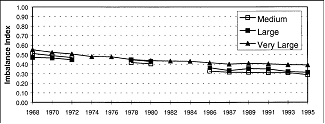
Figure
3 shows the racial balance trends for Hispanic enrollment in relation to white
enrollment.15 Before 1970, Hispanics were clearly much less
segregated than black students in all size categories, which may explain in
part why Hispanics were not treated as victims of discrimination in early court
decisions. In 1968 the index is only 0.55 for Hispanics in very large districts,
compared with a value of 0.71 for black students. In large school districts the
Hispanic-white imbalance is 10 points less than the blackwhite imbalance. The
lower imbalance rates are explained by the greater residential integration of
Hispanics and whites during the 1960s, which is due in part to their smaller
population size.
After
1972, Hispanic-white imbalance declined steadily until trends begin to level
off in 1987, although there are still small declines as late as 1995. In very
large districts, where most black and Hispanic students are found, Hispanic
imbalance is less than black imbalance during the entire time period, and by
1995 Hispanic imbalance had fallen to 0.39, compared with 0.43 for blacks. In
large districts Hispanic students were more imbalanced than blacks between 1972
and 1980 but caught up with them by 1995. Hispanic imbalance has remained
somewhat higher in medium-sized districts during the 1990s, but we note that
index levels of about 0.30 reflect a relatively high degree of balance overall.
That is, an index of 0.30 means that in a district with half Hispanic and half
white students only 15 percent of Hispanics and 15 percent of whites would have
to be reassigned to attain perfect balance.
These
data show quite clearly that Hispanic-white imbalance has not been increasing
from the mid-1980s to the present time; in fact, it has continued to decrease
slightly during the 1990s and remains lower than black imbalance in very large
districts. Thus, contrary to the claims of Orfield, in our national
representative sample of school systems there is no evidence of increasing
segregation of Hispanic students in terms of racial imbalance, the primary
yardstick over the last four and a half decades for measuring the success of
desegregation plans.
Segregation,
Desegregation, and Resegregation
Having
said that there is no evidence of resegregation in terms of racial balance, we
must acknowledge that there are different ways of looking at this issue and
different ways of defining these terms. The original legal meaning of
segregation, as defined by the Supreme Court in 1954 in Brown, was
the separation of the races by official state action (de jure segregation). At
that time, desegregation was simply the abolition of state laws
and government practices that enforced these laws. But the elimination of state
laws requiring the separation of the races did not change segregated residential
patterns, nor did it prevent a variety of other strategies adopted by some
Southern states and school districts for avoiding meaningful integration.
The
Supreme Court decision in Green (1968) put Southern school districts
on notice that they must not merely stop discriminating but also must actually
achieve desegregated schools. It was not until the Swann decision
(1971), however, that a desegregated school was defined as one whose racial
composition is roughly the same as the racial composition of the entire school
system; that is, desegregation equals racial balance. This definition quickly
became the standard throughout the nation for a desegregated school system,
although the amount that a school could deviate from perfect balance varied
from case to case.
Using
this racial balance definition, there is no evidence of significant resegregation
in our nationally representative sample of American public school systems. But
the problem with a racial balance standard is that it ignores the total number
or proportion of white students in a school system. A racial balance standard
cares only that each school mirrors the school district’s racial composition,
not what the actual racial composition might be. A school system that is 90
percent black and 10 percent white would be perfectly balanced if every school
had 10 percent white enrollment. Yet such a school system would not be
considered desegregated by most interested parties. Many courts have defined a
90 percent black school as racially isolated, regardless of the systemwide
composition.
Moreover,
a desegregation plan can cause white flight and thus be the cause of a school
system’s being only 10 percent white. If a district starts out with a student
enrollment that is half black and half white but becomes only 10 percent white
several years later, most observers would not call the plan successful even if
each school was highly balanced at or near 10 percent. Thus, a racial balance
standard by itself gives us only a partial view of the amount of school
desegregation that exists in a school system.
In
order to overcome the limitation of racial balance definitions, James S.
Coleman created a second definition of desegregation that takes into account
the absolute proportion of white students in schools attended by black students
(or any other minority group).16 This definition is measured by a second summary
statistic called the index of interracial exposure— that is, the percentage of
white in the average black (or minority) child’s school.17 In
this case a value of 0 means total black-white segregation, or no whites in
schools attended by black students. The maximum value of this index is the
proportion of students who are white in the school system. If every school’s
percentage of white exactly matches the school system’s percentage of white,
the index will be the same as the proportion (or percentage) of white in the school
system.
For
example, if a system is 30 percent white, then an index of 0.30 would mean that
every school was 30 percent white (and therefore perfectly balanced), and an
index of 0.25 would indicate substantial degree of desegregation relative to
the available whites. But in absolute terms an index of 0.25 means that the
average school is 75 percent black, which indicates a relatively low level of
desegregation in absolute terms. Thus, the interracial exposure index reflects
both the extent of racial balance in the school system and the absolute level
of contact, that is, the percentage of white in the average black (or minority)
child’s school. When the exposure index is examined over time and is compared
with the percentage of white in a system, one can obtain a more comprehensive
picture of both the relative and absolute levels of desegregation.
Orfield’s
studies have used recent declines in the exposure index, rather than the
imbalance index, to argue that resegregation is occurring, a phenomenon he
attributes to the dismantling of desegregation plans. But there are two major
causes for a declining exposure index, one of which is simply a decrease in the
percentage of white in a school system. The decline in the percentage of white
enrollment can be due to nondesegregation-related demographic changes that have
nothing to do with racial balance, such as high black or Hispanic in-migration,
declining white birthrates, or normal middle-class white suburbanization. It
can also be caused by “white flight,” where whites leave a school system to
avoid mandatory busing. The other major cause of a declining exposure index,
the one that concerns Orfield, is a reduction in the number of racially
balanced schools, as might occur when a school district dismantles a
desegregation plan and returns to neighborhood schools.
If the
exposure index has been changing, is it due to declines in the percentage of
white or is it due to the dismantling of desegregation plans? This question can
only be answered by comparing the exposure index to trends in racial imbalance
and also to trends in the percentage of white. We have already demonstrated in
Figures 1–3 that racial imbalance has not changed significantly; it remains to
examine trends in the exposure index and in the percentage of white.
Fig.
4. Trends in racial composition, very large districts.
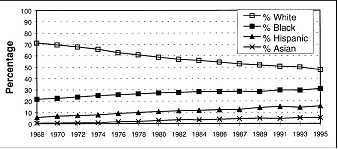
Figure
4 shows the national trends in racial composition for very large school
systems, including the average percentage of white that is the maximum for the
exposure index. In 1968 very large public school districts averaged 71 percent
white, 22 percent black, 6 percent Hispanic, and 1 percent Asian. For the next
twenty-five years the percentage of white declined steadily, while the
percentage of black, Hispanic, and Asian rose correspondingly, and by 1995 the
percentage of white enrollment had fallen to only 48 percent—less than half for
the first time. The decline in the percentage of white was somewhat steeper
during the mid-1970s, undoubtedly influenced by white flight from
desegregation. In the meantime, the percentage of black, Hispanic, and Asian in
the public schools increased to 31, 16, and 5, respectively, as a result of
demographic forces, including both in-migration and birthrates. Any
interpretation of trends in school desegregation indexes, in particular trends
in interracial exposure, must take into account these basic demographic
patterns because they limit the amount of interracial exposure that can be
achieved.
Fig.
5. Black-white exposure in very large districts with formal desegregation plans.
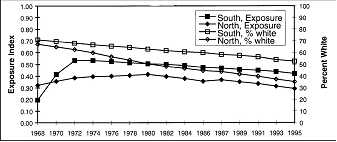
Figure
5 shows why the declining percentage of white cannot be ignored in an analysis
of interracial exposure. It shows the trends in black-white exposure by region
for very large districts with formal desegregation plans, juxtaposed with the
trend for percent of white enrollment. For Southern districts, the largest
changes in interracial exposure (solid squares) occurred between 1968 and 1972,
when the index rose from 0.20 to 0.53, an improvement of 33 points in the
average percentage of white students in schools attended by blacks. After 1972,
however, the index began a long, steady decline, falling to 0.42 by 1995. This
reduction in the absolute exposure index is not caused by increases in racial
imbalance, which remained nearly flat for the next twenty years (see Fig. 2),
but rather the steady decline in the percentage of white enrollment (open
squares), which dropped from 68 percent in 1972 to 53 percent in 1995. In fact,
the exposure index for Southern districts fell at a slower rate than the
percentage of white, indicating that interracial exposure was actually
increasing slightly relative to the available white enrollment. The exposure
index is 15 points from its maximum in 1972 (68 minus 53), and it is only 11 points
from its maximum in 1995 (53 minus 42).
A
similar pattern exists for very large Northern districts with plans. As was the
case with racial balance, the exposure index (solid diamonds) increased over a
longer period, improving from 0.32 in 1968 to 0.41 in 1980, a gain of 9 points
in the average percentage of white in schools attended by blacks. The index
does not even reach 0.50, however, before it begins a long, inexorable decline
over the next fifteen years, falling to only 0.29 by 1995. As in the South,
this decline is the result not of increasing racial imbalance, which is nearly
flat during this time, but rather of a steeply falling percentage of white
enrollment: this fell from 50 in 1980 to only 35 in 1995. Again, relative to
the available whites, interracial exposure actually improves slightly; it is 9
percentage points from its maximum in 1980 and is only 6 points from its
maximum in 1995.
Fig.
6. Hispanic-white exposure for very large districts.
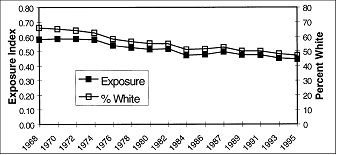
Finally,
Figure 6 shows the trends in the exposure index and the percentage of white for
Hispanic students in very large districts with Hispanic enrollment greater than
1 percent.18 As Orfield has noted, the exposure of Hispanics to
white students has declined substantially from its high in 1972 (0.59) to its
low in 1995 (0.45). But the decline is not due to increasing imbalance, because
Figure 3 shows that Hispanic-white imbalance declined during this time for very
large districts. Again, the decline is caused by the declining percent of white
enrollment in these districts, which has fallen from 64 in 1972 to only 47 in
1995. Relative to the available whites, then, Hispanic-white exposure has
actually increased, and in 1995 it is only 2 points from its maximum value. In
other words, Hispanic students in very large districts are actually more
desegregated than black students, both in absolute terms and relative to the
available white enrollment.
By
comparing the trends in racial composition with the trends in racial balance
and interracial exposure, a much clearer picture emerges about how and why
desegregation levels have changed in recent years. For the fifteen-year period
between 1980 and 1995 (1972–1995 for Hispanics), three patterns emerge: the
percentage of white has declined, racial balance has remained relatively
constant, and interracial exposure has declined. Thus, the cause of declining
interracial exposure is the overall decline in the percentage of white, rather
than the dismantling of desegregation plans.
It may
be appropriate to say that resegregation is occurring for both black and
Hispanic students, in that they find themselves attending schools with a
dwindling number of white students, particularly in larger Northern districts.
But we must be clear about the cause of that resegregation: if ending
desegregation plans were a significant factor, we would see significant increases
in racial imbalance. Because this is not happening, and because the percentage
of white enrollment is decreasing,we must conclude that the resegregation is
due primarily to demographic change in the form of falling white enrollments
and increasing minority enrollments.
Social
and Educational Results
The
existence of long-term national school enrollment data by race makes it a good
deal easier to determine the effect of school desegregation plans on school
racial balance and interracial exposure than to determine their effect on
social and academic outcomes. Although there is a great amount of data on
academic achievement, either from national efforts like the National Assessment
of Educational Progress (NAEP) or from local school districts that administer
standardized achievement tests, it is very difficult to sort out the impact of
desegregation from the effects of many other factors that influence academic
achievement, especially family socioeconomic characteristics, because there are
so few data on these other factors. This has led to substantial disagreement
among researchers about the academic effects of desegregation.
It is
even more difficult to assess the effect of school desegregation on social and
psychological outcomes such as race relations, racial prejudice, and
self-esteem because we lack standardized measures for these variables. Consequently,
with the exception of opinion polls on racial issues, there are few national
data on social outcomes, and there is no way to relate that data to
desegregated schools. Accordingly, we must rely on case studies carried out in
individual school districts to assess the effect of desegregation on such
outcomes as student interracial attitudes and behaviors. Fortunately, there are
reviews of this research literature that are helpful.
ACADEMIC
ACHIEVEMENT
The
debate over desegregation and achievement has continued unabated since the
early 1970s, when the first evidence appeared that desegregation was not
improving black achievement.19 In spite of the claims and expectations of many
supporters of desegregation during the 1960s, and in spite of the existence of
comprehensive and well-funded desegregation plans in many school districts
throughout the nation, there is not a single example in the published
literature of a comprehensive racial balance plan that has improved black
achievement or that has reduced the black-white achievement gap significantly.
Significantly,
the most recent social science study of school desegregation— Orfield and Eaton’s
attack on the courts for “dismantling desegregation”— cited only a single
comprehensive desegregation plan that has led to significant minority
achievement gains or a reduction of the achievement gap.20 Indeed,
out of seven major desegregation plans analyzed as case studies in this book,
the authors did not even discuss minority achievement in three widely discussed
cases—Charlotte-Mecklenburg, Detroit, and Little Rock.
Further,
they were largely skeptical of local school staff reports claiming significant
achievement gains in three other case studies—Kansas City, Missouri, and two
Maryland counties, Montgomery and Prince Georges— but they did not conduct any
original analyses to support their argument. Finally, the only case they cite
where desegregation allegedly improved black achievement was Norfolk, Virginia,
where the data they used were from a study by David Armor that concluded just
the opposite!21 We shall remedy these omissions by presenting new
and independent analysis of achievement results for Charlotte, Kansas City, and
Prince Georges County.
There
are a number of major reviews of the research literature on this question, and
though they do not agree precisely on what the research says, a general picture
does emerge. If there is any effect of desegregation on academic achievement,
it is highly variable (sometimes it occurs and sometimes it does not), the
effects are modest at best, and positive effects occur for reading but not for
math. These are the conclusions of three major reviews of research, including
one by Nancy St. John in 1975, one by Thomas Cook et al. in 1984, and one by
Janet Schofield in 1994.22
The
Cook review, synthesizing the separate reviews of a panel of six experts
convened by the National Institute of Education, captured the essence of this
equivocal state of affairs: “On the average, desegregation did not cause an
increase in achievement in mathematics. Desegregation increased [black] mean
reading levels . . . between two and six weeks. . . . Little confidence should
be placed in any of the mean results presented earlier . . . [because] I find
the variability in effect sizes more striking and less well understood than any
measure of central tendency.”23
Moreover,
we now have massive amounts of national achievement data from the NAEP project,
which also includes information on student background and school
characteristics.How do the NAEP data inform us about the performance of
minority students in desegregated versus segregated schools? What have we
learned about the academic achievement of minority students who have spent most
of their education in desegregated schools? Interestingly, officialNAEPreports
do not address these important questions. Indeed, it is remarkable, given all
the national data, the controversy, and local experience, that there are few
published studies that have tried to answer these questions using NAEP or case
study data.
At the
outset of this discussion, it is important to distinguish two different types
of processes that would cause desegregation plans to have an effect on
achievement. The first, and the one assumed by most studies of desegregation
and achievement, is that the major causal mechanism is the change in the racial
composition of schools; that is, by the improved racial balance that occurs
with desegregation. Under this causal assumption, racial isolation is harmful
because it deprives minority students of contact with more middle-class and
(usually) higher-achieving white students, who help set the pace of study and
the standards of achievement. Racial isolation might also lead to a
concentration of less effective teachers in minority schools, if more effective
teachers gravitate to more integrated or predominately white schools.
The
second possible causal mechanism by which school desegregation might have an
effect on achievement is when a school board makes significant changes in the
types and distribution of programs and resources among schools as part of the
desegregation plan. These effects might be most pronounced during the early
years of desegregation, if a district maintained inferior programs and
resources in predominantly black schools at the time of desegregation (a
circumstance not generally found by the 1965 Coleman study of equal
opportunity).24 In this case improvement in minority achievement
should take place regardless of racial balance.
A
corollary to this second effect is a condition where desegregation improves
programs and resources for all schools, in which case we might see improvement
for all students regardless of race or racial balance. If the first effect is
true, minority achievement should be higher or the gap narrower whenever racial
composition improves, regardless of programs and resources, and there should be
no achievement gains for segregated minority students or for white students. If
the second effect is true, minority achievement could improve in desegregated
or segregated schools, and white achievement might also improve. Of course,
factors other than desegregation and program changes can improve academic
achievement; the leading nonschool factor would be improved socioeconomic
status. The impact of socioeconomic status on academic achievement is well
documented in social science research, and therefore this possibility must be considered
whenever achievement differences or achievement gains are studied.
NAEP
STUDIES
The
NAEP program has documented a significant improvement in black achievement (but
not white achievement) and therefore a closing of the achievement gap between
1970 and 1990. In 1970 the gap in reading was just over one standard deviation
for three different age groups, and by 1990 it had declined to between 0.7 and
0.8 standard deviations.25 Similar patterns were observed for math
achievement. Because this improvement corresponds to a period of extensive
desegregation, some have suggested that desegregation was the primary cause.
In
1998 a Rand team carried out one of the few studies to use NAEP data to examine
the possible effect of desegregation on black achievement gains. They concluded
that desegregation might explain part of the improvement. 26 Unfortunately,
their complicated methodology utilized aggregate data on several regions of the
country, and they did not analyze achievement trends for black students who
actually attended segregated or desegregated schools. Therefore, from their
methodology it is impossible to determine whether potential effects are due to
improved racial balance or to changes in programs that affected all minority
students, regardless of their racial balance status.
The
only published study to date that compares NAEP achievement trends for black
students according to school racial composition found that black achievement
gains were approximately the same in majority nonwhite and majority white
schools.27 Although this finding could reflect program
improvements due to desegregation and implemented in all schools, the study
suggested that improvement in parents’ education (as documented in the NAEP
data) was a major contributor.
A more
direct way to determine the relationship between academic achievement and
desegregation is to show how students are performing on NAEP tests according to
their school racial composition. Because students who attend predominately
white schools are more likely to have higher socioeconomic (SES) levels than
those who attend predominately minority schools, such as higher parent
education, more two-parent families, and more educational materials at home, we
have to adjust the test scores of students to take these SES characteristics
into account. This is done using a statistical technique (multiple regression)
that removes the effect of SES on student achievement.28 This
statistical analysis enables us to adjust students’ test scores for SES and in
that way to make clear comparisons of students of the same social class in
schools of varying racial composition.
Fig.
7. School percent white and reading achievement, 1992 NAEP, age 13, adjusted
for individual SES.
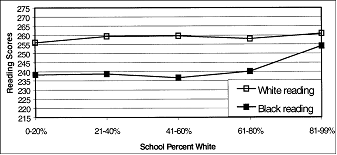
Figure
7 shows the results of an original analysis of the national reading scores for
thirteen-year-olds in 1992, adjusted for individual SES characteristics. Across
the first four categories of racial composition, ranging from predominately
black to 80 percent white, there are no significant differences or trends in
black achievement or in the black-white gap. These schools enroll more than 97
percent of the national black sample. There is a significant improvement for a
small group of black students in predominately white schools (only 45 out of
1,329 in the black sample), most of whom are in 90 percent–plus white schools.
Even assuming this is a reliable result, it is not likely due to racial
composition itself, given the lack of a trend in the other categories; more
likely, it is a self-selection effect or an effect of unmeasured family
characteristics that cannot be evaluated.
Fig.
8. School percent white and math achievement, 1992 NAEP, age 13, adjusted for
individual SES.
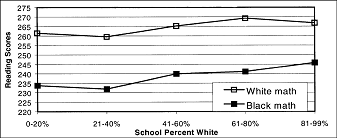
Figure
8 shows an analysis of math achievement for the same group of students. The
pattern here is quite different; both black and white students score higher in
schools that are over 40 percent white, and therefore the achievement gap
remains relatively constant across the first four categories of school (it
narrows significantly only for the small group of black students who are in
highly white schools). Because the improvement occurs for both groups, it is
probably not due to racial balance; rather, it is more likely to be due to
programmatic differences among the schools or unmeasured SES factors. Whatever
the cause, attending a racially integrated school does not reduce the math
achievement gap between black and white students in this national sample.
Similar
results were obtained for the seventeen-year-old age groups as well as for
Hispanic students. Therefore, the NAEP data do not support the thesis that
desegregated schools significantly benefit black or Hispanic reading
achievement, nor do they reduce the black-white or Hispanicwhite achievement
gap in mathematics.
CASE
STUDIES
The
NAEP data have the advantage of being national in scope, but they have some
serious drawbacks as well. For example, the NAEP data do not include
information on the existence, scope, or duration of desegregation plans within
a district. Although the data include the racial composition of the student’s
school, they do not explain why the racial composition exists or how long it
has been that way. For this reason it is useful to look at a number of case
studies of the effects of comprehensive desegregation plans on achievement.
Several
recently published case studies include Pasadena, California; Norfolk,
Virginia; and Charleston, South Carolina.29 In 1970, three years before the Keyes decision,
Pasadena became one of the first Northern school districts to implement a
districtwide racial balance plan, having been ordered to do so by a federal
district court. From 1970 to 1973 there was no improvement in the reading
scores of a first-grade cohort of black students in fully desegregated schools.
Norfolk,
Virginia, was fully desegregated and racially balanced by 1970. Fourth-grade
test scores were available from 1965 to 1982. Both black and white test scores
actually fell dramatically after desegregation. The blackwhite gap narrowed
somewhat between 1970 and 1973 but only because white achievement fell more
than black achievement. Between 1973 and 1980 achievement scores improved for
both races, but they did not reach their predesegregation levels until 1978;
the gap remained constant during this time. A special compensatory program that
was initiated in 1978 may have produced the gains in 1979 and 1980. But in
1981, when a new test form was introduced, scores fell again. There was also
some evidence that improper coaching and teaching before the test may have
accounted for some of these increases. Even so, one can certainly conclude that
racial balance had no positive impact on black or white fourth-grade
achievement between 1970 and 1978.
Similar
results were found in Charleston, South Carolina, where the court-approved
desegregation plan did not produce racial balance in every school. Charleston
was a countywide district with subdistricts that governed student and teacher
assignment, hence racial balance was required only within subdistricts. The
case study compared reading achievement for black third- and fourth-graders in
schools with varying degrees of racial composition across subdistricts and
found no significant difference in test scores, or change in test scores, among
predominately black schools, predominately white schools, and racially balanced
schools.
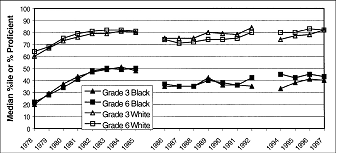
Fig.
9. Trends in New Castle County, Delaware, 6th-grade reading.
Some
additional case studies (unpublished to date) are of special interest because
of the nature of their desegregation plans. Three of these case studies present
original data analyses from school districts discussed by Orfield and Eaton:
Kansas City, Missouri; Prince Georges County, Maryland; and
Charlotte-MecklenburgCounty,North Carolina. Another is from the Wilmington–New
Castle County district, which had a unique courtordered desegregation plan.
In
1978 a federal court ordered the merger of predominately black Wilmington,
Delaware, with ten predominately white New Castle County districts to form a
single metropolitan school district, and a countywide desegregation plan was
implemented. It is one of the few metropolitan consolidation and busing plans
to be ordered by a court and ultimately adopted. The case is of special
interest because, unlike many central city plans, black students attend most of
their school years in majority white suburban schools whose student bodies have
remained relatively middle class (in some cases, affluent) since the start of
the plan. As late as 1993 the New Castle County districts (the single district
was divided into four districts in 1981) were among the most racially balanced
districts in the country. Not only did the vast majority of schools range from
65 to 75 percent white, but also every school was at least majority white.
Figure
9 shows trends in sixth-grade reading scores for students in all four New
Castle County districts.30 In 1985, when sixth-graders would have attended
racially balanced schools since kindergarten, we see a black-white gap of 15
points, or about three-fourths of a national standard deviation. Moreover,
there is no improvement in black sixth-grade test scores, nor is there a
reduction in the achievement gap over the nine years shown. In 1993 the
black-white gap is 17 points (on a different test), or about eighttenths of a
standard deviation, similar to the 1992 achievement gaps for the NAEP reading
tests. In spite of these stable, desegregated, and majority white schools
located in middle-class neighborhoods, the presumed ideal environments for
raising black achievement, there are neither significant black gains nor
reductions in the black-white gap. Clearly, the Wilmington case does not
support the thesis that racial balance will reduce the achievement gap.
Fig. 10.
Trends in Kansas City, Missouri, 5th-grade achievement, ITBS composite scores.
Nor is
it a question of money. In 1986 a federal court ordered Kansas City, Missouri,
to implement what may well be the most expensive remedial plan in history.
Kansas City had been operating a desegregation plan since the late 1970s. But
in 1986 the court ordered an expanded plan involving extensive construction,
renovation, and the addition of magnet programs to most of the elementary and
all the secondary schools, whose purpose was to attract suburban whites into
this 70 percent minority school system. With a unique court-ordered tax levy
and court-ordered funding from the state, total school expenditures reached
$10,000 per pupil by 1990, with total funding exceeding $1.5 billion over
approximately an eight-year period. Unfortunately, not enough white students
came to the city from the suburbs to lower the minority percentage
significantly.
As the
achievement trends in Figure 10 reveal, this extraordinary degree of expenditures
for one of the largest magnet programs in the nation apparently did nothing to
raise the achievement levels of black students, which remained substantially
below white achievement from 1988 to 1995. In fact, when a new test form was
implemented in 1995, scores of all students fell significantly, raising the
possibility that some coaching or teaching of test content may have taken place
during preceding years. Although the black-white achievement gap is somewhat
narrower than in Wilmington or in the NAEP, this appears to be due to low white
scores rather than to high black scores (Kansas City has a relatively high
proportion of white students in the free lunch program). Thus, spending an extraordinary
amount of money on a school desegregation plan and on magnet schools does not
seem to improve minority achievement significantly or decrease the
minority-white achievement gap.
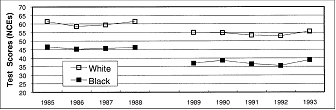
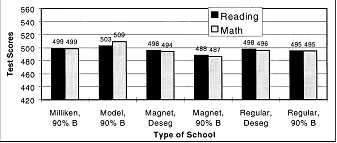
Fig.
11. Prince Georges County, Maryland, black test scores by school type, 1996,
grade 3.
The
Prince Georges County case is noteworthy because of a different approach taken
in its second school desegregation plan. A predominantly white suburban county
outsideWashington, D.C., Prince Georges adopted a comprehensive pairing and
busing plan in 1973. This was followed by extensive white flight and black
in-migrationfrom the District of Columbia, and the county schools became
majority black in the early 1980s. Recognizing that not all schools could
achieve meaningful racial balance, a modified desegregation plan was adopted in
1985 that provided for several types of schools: desegregated magnet schools,
desegregated regular schools, and “Milliken II” schools, which were
predominantly black and received additional resources and funding. Later, as
white enrollment losses continued, some of the magnet schools and some of the
regular schools became predominately black; they also added a category of “Model”
schools, which were predominately black and received extra resources but not as
much as Milliken schools.
These
different types of programs and desegregation levels offer a unique opportunity
to sort out the potential effects of racial balance from the effects of special
compensatory programs and extra funding. Figure 11 shows third-grade test
scores (from a Maryland statewide test) for black students in six types of
schools, after adjusting scores for student background characteristics. Though
the scores vary somewhat across the different types of schools, there is no
apparent benefit from attending a desegregated school, most of which are
approximately half black and half white. After controlling for SES and initial
ability, black students attending desegregated magnet and desegregated regular
schools score no higher than black students at predominately black regular
schools (which average around 90 percent black), and they score somewhat lower
than black students in the enriched but predominately black Milliken and Model schools
(which exceed 90 percent black). It is not clear why black students score
lowest at the predominately black magnet schools and highest at the predominately
black Model schools, but whatever the reason it is not because of their racial
composition, which is identical.
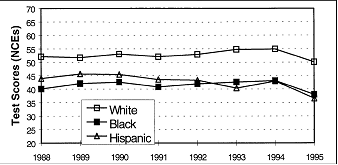
Fig.
12. Achievement trends in Charlotte-Mecklenburg, North Carolina, grades 3 and
6.
The final
case study to be presented is Charlotte-Mecklenburg, North Carolina, which is
especially important historically because of the famous U.S. Supreme Court
decision in this case. The Swann decision upheld a lower court order
to adopt a comprehensive, countywide mandatory busing program to attain racial
balance in all schools, thereby creating a standard for desegregation that was
applied throughout the nation for many years. Because Charlotte was a large
county district with a relatively low black enrollment in 1970, it was able to
sustain very extensive racial balance for the next twenty years while at the
same time preserving a majority white school system. It has been described in
the Orfield and Eaton book as one of the most successful desegregation plans in
the country, with unprecedented local support from educators, civil rights
leaders, and the business community.
Figure
12 shows the long-term achievement trends for third and sixth graders from 1978
to 1997. In 1978 black elementary students had been in well-desegregated
schools from kindergarten on, yet they scored only at the 20th percentile in
both reading and math compared with national norms. Test scores began
increasing dramatically for both black and white students, reaching maximums in
about 1983, when black students scored at the national norm of 50. The reason
for the increase is not clear, but it is not likely due to desegregation, which
had been in place for eight years before 1978. Some of the increases may have
been due to coaching or teaching test content because scores for both races
dropped significantly when a new test form was adopted in 1986. Though the
black-white gap had diminished somewhat by 1983, it returned to its original
magnitude in 1986 (about one standard deviation) and remained relatively
constant until the last CAT test was administered in 1992. A sizable test score
gap also existed between 1994 and 1997, but it cannot be compared directly with
the CAT gap because it comes from a different statewide test that uses a different
metric. Thus, one of the most successful desegregation plans in the country did
not reduce the black-white achievement gap significantly.
These
case studies bolster the NAEP results shown in Figures 7 and 8, that racial
composition by itself has little effect on raising the achievement of minority
students or on reducing the minority-white achievement gap. Some studies show
that there is no relationship at all between black achievement and racial
composition (controlling for student SES), and other studies show that there is
no relationship between the black-white achievement gap and racial composition.
In either case, though there is some evidence here that achievement can be
affected by programmatic changes, there is no evidence that it responds to
improved racial balance by itself.
RACE
RELATIONS AND ATTITUDES
Studies
of the effect of desegregation on racial attitudes and race relations were
fairly common during the 1970s, when the desegregation movement was at its
peak. There seems to be less interest in these issues now, perhaps because the
early studies offered little support for the notion that desegregation would
bolster self-esteem, lower racial prejudice, and improve race relations.
The
first major review of the effect of desegregation on race relations and
attitudes was by St. John, whose study was published in 1975.31 She evaluated
35 studies conducted between 1966 and 1973 of changes in white attitudes or
behaviors after desegregation. She found 11 studies in which white prejudice
worsened, 11 where it improved, and 13 where there was no change or mixed
results. She also evaluated 28 studies of changes in black prejudice after
desegregation, finding 10 where black prejudice worsened, 6 where it improved,
and 12 where there was no change or results were mixed. Her review also
evaluated the effect of desegregation on the self-esteem of black children, one
of the key concerns of the Supreme Court in Brown. Out
of 35 studies, she found 14 where black self-esteem was higher in segregated
than desegregated schools, 5 where it was higher in desegregated schools, and
16 where there was no significant difference.
Walter
G. Stephan conducted a similar type of review about ten years later.32 Although
he reviewed a smaller number of studies, his 28 studies covered a longer time
span (1963–1981) and included only those with a reasonably sound methodology.
His findings were remarkably similar to those of St. John. Out of 24 studies of
change in white attitudes or behavior, he found 11 where desegregation
increased white prejudice, 4 where it decreased, and 9 where there was no
change. Of the 17 studies of black attitudes and behaviors, he found 5 showing
that desegregation worsened black prejudice, 4 where it improved, and 8 where
there was no difference. In his review of black self-esteem in 28 studies, he
found 7 where desegregation lowered black self-esteem, 1 where it was improved,
and 19 where there was no change. It is interesting that the majority of
studies during this period found that black self-esteem was generally higher
than white self-esteem, thus calling into question the Supreme Court’s
psychological harm thesis.33
The
evidence on the benefit of school desegregation for race relations is probably
the weakest of all. Indeed, there are more studies showing harmful effects than
studies showing positive effects. This led to another and more recent reviewer
of the race relations literature to conclude, somewhat generously: “In general,
the reviews of desegregation and intergroup relations were unable to come to
any conclusion about what the probable effects of desegregation were. . . .
Virtually all of the reviewers determined that few, if any, firm conclusions
about the impact of desegregation on intergroup relations could be drawn.”34
The
reluctance of reviewers to draw conclusions about the benefits of school
desegregation for race relations or self-esteem only reinforces our conclusion
that the psychological harm theory of de facto segregation and the social
benefit theory of desegregation are clearly wrong, at least when applied to
desegregation as a racial balance policy. Of course, the original psychological
harm theory presumed official segregation sanctioned by laws, which was pretty
much gone by the mid-1960s and before the time when most of the studies above
were conducted. But supporters of the harm and benefit thesis have applied it
far more broadly, to cover any type of racial imbalance or racial disparity
arising from any cause, and even today it forms the ideological basis for desegregation
and affirmative action policies. It is this broader formulation that fails
under scrutiny of the research evidence.
Conclusions
What
can we say about the success and failures of the school desegregation movement?
If we evaluate school desegregation policy within the constitutional framework
established by the Supreme Court on the matter of race in Brown,
which is much narrower than the goals of many civil rights advocates, there are
indeed successes. The failures come, for the most part, from attempts to extend
this original framework to see school desegregation as a means of resolving a
whole host of racial issues never contemplated by Brown.
First,
we must not diminish the fact that Brown forever
changed the fundamental way in which America deals with race, not only in
schools but also throughout society. In particular, it forbade all official
actions that segregated students or staff by race, or that sanctioned
discriminatory distribution of resources, facilities, and activities. Second,
after the Court allowed consideration of race in fashioning desegregation
plans, what followed was an unprecedented change in the way students and staff
were assigned to schools, eventually creating extensive racial balance in
schools to an extent never attained in any other sector of society.
That
racial balance has largely continued to the present time, with or without court
orders. Although the Supreme Court has returned to its original conception of
race, permitting school systems to be declared “unitary,” after which race
cannot be used for student assignment (whether for racial balance or
imbalance), there has been no rush to dismantle desegregation plans and return
to strict neighborhood school policies. The reason is that racial balance and
racial diversity have become desired goals, especially within the educational
establishment. True, a number of unitary school systems, like Norfolk, Oklahoma
City, Cleveland, and Prince Georges County, now have some neighborhood schools,
but most of these districts have retained such politically palatable
desegregation policies as magnet programs, voluntary transfers, and minimal
integrative geographic zoning. Indeed, that is why the racial balance indexes
have remained so stable for the past fifteen years.
The
biggest threat to desegregation is not the dismantling of plans but rather the
inexorable demographic changes that have left the majority of larger school
systems predominately minority. No type of permissible plan will result in
substantial desegregation in New York, Los Angeles, Chicago, Cleveland,
Detroit, Atlanta, Dallas, and dozens of other large cities.35 The declining
measures of interracial exposure for both black and Hispanic students are
caused not by dismantling desegregation plans but rather by the falling
percentage of white students in all but the smallest public school districts.
Though these demographic trends do effect the success of desegregation plans,
they do not reflect failures of the courts or of public policy in general.
It is
only when we turn to educational and social benefits that we find the most
significant failures of desegregation policy. Of course, these are not failures
of Supreme Court doctrines or federal law, which never contemplated such
benefits; rather, they are a failing of the benefit theory as embraced by many
civil rights advocates, some lower courts, and even a few Supreme Court
Justices. Desegregation and racial balance have not brought the gains in
minority achievement and a closing of the achievement gap envisioned by so many
believers in this thesis because the thesis is invalid.
There
is some evidence that special programs have benefited achievement slightly—even
when not accompanied by racial balance—but the benefit has not been sufficient
to close the black-white or the Hispanicwhite gaps. In all the case studies
discussed here, and in many others not discussed, the achievement gaps in
well-desegregated school systems remain very close to the national achievement
gap, and this gap is only slightly smaller than the gap that existed when major
desegregation plans began in 1970. If desegregation is responsible for this
modest reduction in the gap, it is most likely due to programmatic and resource
changes, not racial balance policies.
There
is even less evidence that school desegregation has reduced racial prejudice,
improved race relations, or benefited self-esteem. Here the expectations of
benefits were based either on inadequate social theory or on misinterpretations
of the widely accepted contact theory of Gordon Allport. 36 Given
the very large differences in academic achievement between black and white
students, and the fact that desegregation did not eliminate these differences,
it may have been naı¨ve to expect that integrated schools would improve
black self-esteem, when blacks were plunged into an academic environment where
the competition was far more rigorous than in segregated schools. The unequal
achievement and resulting unequal grades in desegregated schools also violated
one of the contact theory’s requirements for positive race relations—that there
would be equal status contact. This is not to say there are no social benefits
of school desegregation.
First,
school desegregation has brought each race greater personal knowledge about
other races living in their community, albeit without guaranteeing positive
race relations in all cases. Second, knowledge, proper instruction, and
tolerant staff can help schools become places where children learn how to treat
and respect persons of other races, which helps prepare them for the later
realities of living in a multiracial society. Finally, many individual students
do find meaningful interracial experiences and friendships, which they value
and want to have, even though this outcome may not apply to the majority of students.
This is one of the reasons we have always supported voluntary desegregation
plans, which let individual students and families decide whether or not to
attend an integrated school, for whatever reasons are important to them.
It is
this last set of social benefits that leads us to support desegregation policies
for unitary school systems, though these are more restricted than the original
types of plans. Desegregation should be strictly voluntary, as with magnet
schools or open enrollment options, and it should be available across district
lines as part of choice programs that include private schools. Race cannot be
used explicitly as a criteria for school assignment in a unitary system, even
in the case of voluntary options. Poverty (i.e., free lunch status) is,
however, a permissible criteria for government decisions. By offering voluntary
transfer options to all students, with some financial incentive (such as
transportation) for free lunch students, we can expand the opportunities for
desegregation for those families that desire it most, across district lines and
between public and private sectors, and without the unintended negative
consequences that have plagued the massive mandatory busing schemes of the
past.
Notes
1. The criteria
for a unitary or nondiscriminatory school system were first formulated
in a brief
footnote in a Supreme Court decision, Green v. New Kent County
(Va.), 430 U.S. 391
(1968). There was no discussion or explanation of the meaning of
these factors
or the level of compliance that would be required.
2. Gary Orfield
and Susan E. Eaton, Dismantling Desegregation (New York: New
Press, 1996),
p. 53.
3. Alexander M.
Bickel, “Untangling the Busing Snarl,” New Republic, September
23 and 30,
1972.
4. James S.
Coleman, Sara D. Kelly, and John A. Moore,Trends in School Integration
(Washington,
D.C.: Urban Institute, 1975).
5. James S.
Coleman et al., Equality of Educational Opportunity(Washington, D.C.:
U.S. Government
Printing Office, 1966).
6. Green v. New
Kent County at 437.
7. Swann v.
Charlotte-Mecklenburg Board of Education, 402 U.S. 1 (1971).
8. Keyes v. School
District No. 1, Denver, 413 U.S. 189 (1973).
9. HEW, Office
of Elementary and Secondary Education, did a school census in
1967 and
published a book with enrollment by school and three ethnic groups, white,
black, and
other, in several thousand school districts. The data was not kept in
machinereadable
format.
10. For a more
detailed description of the original national study, see Christine H.
Rossell and
David J. Armor, “The Effectiveness of School Desegregation Plans,” American
Politics
Quarterly 24 (1996): 267–302.
11. The formula
is D=1/2 ∑ | (Wi/W)-(Bi/B) | where Wi is the white
enrollment
in each school,Wis the white
enrollment in the school system, Bi is the black enrollment
in each school,
and B is the black enrollment in the whole school system.
The absolute
sum of the
difference between whites and blacks is calculated for each school, then
summed down the
schools, and the total divided by two.
12. It also
equals the sum of the proportion of students of one race and the
proportion of
students of the other race that would have to be reassigned to attain
perfect
balance. In a school system exactly half white and half black, the percentage
of
each group to
be assigned could be derived by dividing the index by two.
13. The number
of cases for small districts was insufficient to provide stable estimates.
14. All
Southern districts with both black and white students had to have some type
of plan if they
had practiced segregation in 1954; some districts may have eliminated
segregation by
geographic zoning, which they did not view as being a formal plan. Only
ten districts
fell into this category.
15. The index
of dissimilarity measures the imbalance of only two groups at a time.
In calculating
Hispanic-white imbalance, black and other enrollment is ignored. Similarly,
in the
calculation of black-white imbalance, Hispanic and other minority enrollment
is ignored.
16. See
Coleman, Kelly, and Moore, 1975.
17. The formula
is E=(∑inbipwi)/∑nbi where nbi is the number
of black students
in school i, and pwi is the
proportion of white in the same school. The number of black
students is
multiplied by the proportion of white in each school, and this is then
summed across
schools. That total is divided by the number of blacks in the school
system.
18. It is
necessary to exclude districts with very small numbers of Hispanic students,
because they
tend to inflate the exposure index with very high values.
19. David J.
Armor, “The Evidence on Busing,” Public Interest 28 (1972):
90–126.
20. Orfield and
Eaton, Dismantling Desegregation.
21. See Armor, Forced Justice:
School Desegregation and the Law (New York: Oxford
University
Press, 1995), pp. 79–81. Black and white scores in Norfolk actually fell after
desegregation
in 1970, and neither group returned to its predesegregation achievement
levels until
1978. The black-white gap narrowed somewhat between 1970 and 1973,
but only
because white achievement fell more than black achievement. Achievement
improved for
both groups between 1973 and 1980, but the gap remained constant
during this
time; scores fell again in 1981 when a new test form was introduced.
22. Nancy St.
John, School Desegregation (New York: Wiley & Sons, 1975); Thomas
Cook et al., School
Desegregation and Black Achievement (Washington, D.C.: National
Institute of
Education, U.S. Department of Education, 1984); JanetWard Schofield, in
Banks and
Banks, Handbook of Research in Multicultural Education (New York:
Macmillan,
1994).
23. Cook et
al., pp. 40–41.
24. Coleman et
al., Equality of Educational Opportunity.
25. It fell to
0.5 sd’s for thirteen-year-olds in 1988 and 1990, but by 1992 this age
group was back
to 0.71.
26. David
Grissmer, Ann Flanagan, and Stephanie Williamson, “Why Did the
Black-White
Score Gap Narrow in the 1970s and 1980s?” in Christopher Jencks and
Meridith
Phillips, eds., The Black-White Test Score Gap (Washington, D.C.: Brookings
Institution,
1998).
27. Armor, Forced Justice, p. 95.
28. The
adjustment uses multiple regression analysis to predict student scores solely
according to
their parents’ education, family structure, household reading items, and
gender.
29. Armor, Forced Justice, pp. 77–83.
30. The break
in the trend line denotes the change in 1989 from the California
Achievement
Test (CAT) to the Stanford Achievement Test (SAT).
31. St. John, School
Desegregation.
32. Walter G.
Stephan, “The Effects of School Desegregation: An Evaluation 30
Years After Brown,” in M. Saks
and L. Saxe, eds., Advances in Applied Social Psychology
(Hillsdale,
N.J.: Erlebaum, 1986).
33. In fairness
to the Supreme Court, they were simply referring to the testimony
of social
scientists at that time, who may have misinterpreted the famous doll studies
of Kenneth and
Mamie Clark. See Armor, Forced Justice, pp. 99–101.
34. Janet Ward
Schofield, “School Desegregation and Intergroup Relations: A Review
of the
Literature,” in Review of Research in Education 17: 335–412, ed. Gerald
Grant
(Washington, D.C.: American Educational Research Association, 1991), p. 356.
35. The Supreme
Court established in 1974 in Milliken v. Bradley that there can
be
no
cross-district remedy without a cross-district violation (i.e., collusion
between city
and suburban
government officials to segregate the city and suburban school districts).
Proving a
cross-district violation is almost impossible, and there have been only a
handful of
cross-district remedies since 1974.
36. Gordon
Allport, The Nature of Prejudice (Reading, Mass.: Addison-Wesley,
1979).
==============================
The Racial Gap in Academic Achievement
ABIGAIL
THERNSTROM
As early as
second or third grade, [African American students] generally have much lower
grades and test scores than Asians and Whites—patterns that persist over the
course of their school careers.
—The College
Board, “Reaching the Top: A Report of the National Task Force on Minority High
Achievement”
You have to
demand more of your students while providing them with the structure to meet
those demands. The more difficult the curriculum, the greater the likelihood
your students will be successful.
—Gregory Hodge,
principal, Frederick Douglass Academy in central Harlem, New York City
In 1903,
W. E.
B. Du Bois, the preeminent black intellectual of his time, described “the
problem of the color line [as] the problem of the twentieth century.” And four
decades later he peered sixty years down the road and saw a new century in
which—for blacks—there would be nothing new.
We
have, of course, arrived at that new century, and much has changed. But in
certain respects, not nearly enough. Although almost half of blacks are today
in the middle class, racial inequality remains a fundamental fact about
American life. And much of that inequality can be traced to one source: the
underachievement of black students in school. The racial gap in cognitive
skills is the nation’s most serious educational problem, and its most critical
race-related issue.
Most
discussions of the racial gap in academic achievement contrast the scores of
blacks and Hispanics to those of Asians and whites. But the Hispanic and black
stories are not the same. Hispanics are a classic immigrant group. With the
passage of time, their academic profile (already less worrisome than that of
blacks) is likely to change. African Americans are the real concern.
Skills
Matter
Educational
reform is sweeping the nation. Every state, except Iowa, has developed specific
learning standards, and all but three are committed to statewide tests to
determine compliance with those standards in at least one core subject.
Thirty-eight states have aligned their standards, curricula, and assessments in
all four major subjects—English, math, science, and history. More than half the
states are making high school graduation conditional upon a passing grade on a
state test. The standards are often rock-bottom, but even clearly defined
minimal expectations are a sharp break from the past.1
Teachers,
too, are facing tougher tests for certification, and many states have the power
to assume control of a failing school, or even an entire district. Charter
schools are bursting out all over; thirty-six states and the District of
Columbia now have some sort of charter law. There are other reforms connected
to high standards and accountability: early intervention programs, some of
which target both parents and children; an end to social promotion; summer
school, after-school, and Saturday programs; a variety of incentives (including
free college tuition) designed to promote high achievement;summer workshops in
content areas for teachers; the addition of more reading and writing to the
curriculum; and much else.
Educational
improvement means, above all, raising the performance of urban students, and
particularly those who are black. The academic performance of black youngsters
on standardized tests is worse than that of any other group; if educational
reforms do not raise black test scores, they will have failed. And if current
efforts fail, a substantial percentage of African American families will remain
below the poverty line. Blacks and whites today have equal high school
graduation rates and nearly equal college attendance rates. Over 85 percent of
both groups finish four years of high school (although not necessarily by age
eighteen), and among those who obtain a high school diploma, 60 percent of
blacks (versus 68 percent of whites) go directly into college. But blacks and
whites do not leave the twelfth grade equally well educated, and thus they do
not have the same college graduation rates or the same earnings down the road.
Blacks
are more likely to earn a college diploma than whites with the same
twelfth-grade test scores.2 And blacks earn no less than whites when they are
equally academically prepared. There is much talk in the media and elsewhere
about the rich getting richer and the poor becoming poorer. In fact, it is
those with skills who are doing well economically. In recent decades, earnings
for low-skilled work have declined, while those for jobs that require a good
command of language and numbers, as well as the ability to analyze complicated
problems, have risen dramatically.3
Thus,
it is actual knowledge—not years spent in school warming a seat—that makes the
difference in an individual’s income. What often looks like discrimination is
better described as rewarding workers with relatively strong cognitive skills.
One study of men twenty-six to thirty-three years old who held full-time jobs
in 1991 found that when education was measured in the traditional way (years of
school completed), blacks earned 19 percent less than comparably educated
whites. But when the yardstick was how well they performed on basic tests of
vocabulary, paragraph comprehension, arithmetical reasoning, and mathematical
knowledge, the results were reversed. Black men earned 9 percent more than
white men with the same education—as defined by skill.4
Other
studies contain similar findings. Among men thirty-one to thirty-six years old
whose cognitive skills put them above the 50th percentile on the well-respected
Armed Services Vocational Aptitude Battery test, the difference between black
and white earnings is a mere 4 percentage points, Christopher Jencks and
Meredith Phillips report in a Brookings Institution volume on The Black-White
Test Score Gap.5 A 1999 College Board report came to much the same
conclusion: “Differences in job performance ratings and wages among people with
similar educational credentials are related in part to differences in academic
achievement and skills levels, as measured by standardized test scores, class
rank in college, and even high school grades or test scores.” Other factors do
come into play—”motivation, perserverance,” even “plain old luck,” it went on.
White racism, however, was not on the list.6
Scary
Numbers
Test
scores matter, and those for blacks and whites, on average, are not the same.
For a while the rate of progress was heartening. During the 1970s and the
better part of the 1980s, black school children were making more rapid gains
than whites on the standardized tests administered periodically to a
representative sample of students by the National Assessment of Educational
Progress (NAEP). NAEP results are often called the nation’s report card on
education, and in 1971, when the tests were first given, the average African
American seventeen-year-old could read no better than the typical white
eleven-year-old. By 1988, the gap had been narrowed to just 2.5 years, still
too large but less than half of what it had been sixteen years before. Math and
reading tests are given in different years, but the data are similar. In 1973,
black students were 4.3 years behind their white peers; in 1990, the difference
was down to just 2.5 years. Toward the end of the 1980s, however, black
progress came to a halt. Scores began to go down. By 1996, the racial gap in
math of 2.5 years in 1990 had grown to 3.4 years. The average African American
high school senior thus had math skills precisely on a par with those of the
typical white student in the middle of ninth grade—a huge disparity in a world
in which numeracy is becoming at least as important as literacy.
The
reading scores are even more dismaying. Although the black-white gap closed by
a remarkable 3.5 years between 1980 and 1988, it widened by more than a year
and a half in the following decade, erasing half of the previous gain. As a
result, in 1998 the average seventeen-year-old African American could only read
as well as the typical white child who had not yet reached age thirteen. In
1992, just 18 percent of black students in twelfth grade were rated “proficient”
or “advanced” in reading, as compared with 47 percent of whites. As of 1998,
those numbers were unchanged. Backsliding is evident in both science and
writing as well. In the decade following 1986, the science gap widened by a
half a year, and between 1988 and 1996, the difference between white and black
scores on the writing assessment increased by 1.2 years. The most recent data
thus show black students in twelfth grade dealing with scientific problems at
the level of whites in the sixth grade and writing about as well as whites in
the eighth grade.
The
Middle-Class Puzzle
The
racial gap in academic skills is a problem that starts before kindergarten and
affects black youngsters from every social class. Thus, the median scores of
black and white five- and six-year-olds who took the Peabody Picture Vocabulary
Test in the years 1986–1992 were quite different. 7 In an
essay in The Black-White Test Score Gap, Meredith Phillips and colleagues
estimate that about half the difference between white and black twelfth-grade
students is explained by the gap that is already evident in first grade.8 Could
that gap be eliminated by better schooling? No one knows for sure. But schools
scattered across the landscape are beating the demographic odds—educating
children from whom regular public schools expect less.
More
discouraging, because it’s more bewildering, is the poor academic performance
of middle-class black students. Shaker Heights is a tony Cleveland suburb; its
black residents are well-to-do. And its schools, as of 1998, were pouring
nearly $10,000 a year into educating every child. It has had a rich program
aimed at raising the level of black achievement. Successful black students
mentor those doing poorly in the earlier grades; tutors work with small groups
of kindergarten children who need help reading; after-school, weekend, and
summer academies are open to those who want to attend; special high school
classes are available for those who do not keep up; a high school counselor
works with youngsters whose grades do not reflect their potential; and so
forth. The results have the school administators totally baffled. About half
the students in the Shaker Heights school system are black, but blacks are 7
percent of those in the top fifth of their class, and 90 percent of those in
the bottom fifth.9
“At
virtually all socioeconomic levels,” black students do not perform as well as
those who are white or Asian, the College Board’s recent task force report
acknowledged. In fact, the racial gap in academic achievement is widest among
middle-class students from educated families; the NAEP scores of black and
white youngsters whose parents lack even a high school degree are more alike.10 The
SATs, too, paint a dismal picture. In 1995, black students from families in the
top income bracket—$70,000 and up— were a shade behind whites from families
earning less than $10,000 on the verbal assessment and significantly behind
them in math.11
Trash
the Tests
Many
educators, policy makers, and others argue, of course, that staring at these
numbers is a fundamentally misguided way of looking at the question of black
academic achievement. Test scores tell us little, they say, and should never be
used to decide who moves up a grade, attends summer school, or graduates. Their
disparate racial impact “should be cause for further inquiry and examination,”
the U.S. Department of Education’s Office of Civil Rights (OCR) contends. In
draft guidelines issued in December 1999, it warned states and local school
districts that they must be prepared to defend their “high stakes” tests in
federal court. Low scores may reflect limited educational opportunities; if so,
decisions that rely upon test performance are “problematic”—that is,
discriminatory. Numerical cut-off scores on a statewide test as a condition of
graduation are particularly suspect.12
OCR’s
views square with those of many who identify themselves as members of the civil
rights community. Christoper Edley Jr. was President Clinton’s main advisor on
race for a number of years; the guidelines, he said, protect students from “harsh
high-stakes sanctions.”13 In a resolution approved on November 19, 1999, the
NAACP came out against the use of SAT and ACT exams for purposes of college
admission on the grounds that they are racially biased and a poor indicator of
success in college.14 In doing so, it ignored much evidence that, in
fact, the SAT overpredicts black college grades; black students tend to do
worse than their test scores suggest they should. The tests are indeed biased—in
favor of black students.15
In
1999, the Educational Testing Service, too, took a swipe at the SATs for which
it is ultimately responsible. When kids are from disadvantaged households—as
measured by a host of possible criteria—SATscores should be adjusted to reflect
the hurdles they must overcome, ETS tentatively suggested in September 1999. A
score of 1,000 should be read as 1,200 if the student is black, for example,
and has thus outperformed the black average.16 The arguments of both the NAACP and
ETS logically apply to all tests at every grade level. If standardized
assessments are biased and therefore misleading, then grades should be
adjusted. On an eighth-grade math test, a Hispanic’s “B” is really an “A.”
Scores are not scores. They are numbers to be read within a demographic
context. And the uniformly high academic expectations that are integral to
standards-based educational reform are a grave mistake.
That
is certainly what Jonathan Kozol, a well-known writer on education, believes.
The increasingly popular statewide tests, he has declared, evoke memories of “another
social order not so long ago that regimented all its children . . . to march
with pedagogic uniformity, efficiency, and every competence one can
conceive—except for independent will—right into Poland, Austria, and France,
andWorldWar II.”17 Deborah Meier, the much-celebrated founder of the
Central Park East schools in New York City, condemns standardized tests as
failing to “measure the only important qualities of a well-educated person.” “Life
scores [not math scores] based on living” should be the educator’s concern, she
has written.18 Theodore Sizer, former dean of the Harvard Graduate
School of Education, is also opposed to the entire standards-based educational
package. “The myriad, detailed and mandatory state ‘curriculum frameworks,’ of
whatever scholarly brilliance, are attacks on intellectual freedom,” he says. “High
stakes tests arising from these curricula compound the felony.”19
Kozol,
Meier, Sizer, and their allies have many fans, including most members of the
faculty at the leading graduate schools of education. U.S. Senator
PaulWellstone has introduced legislation to ban standardized tests from being
used as the sole criterion for grade promotion and high school graduation.20 But
they seem to be fighting a losing war. Powerful currents are pushing education
in a different direction. Asked in a 1999 poll whether they had “respect and
confidence” in public schools, only 36 percent of Americans said they had a “great
deal/quite a lot of confidence.” A year earlier 59 percent had listed low
academic standards as a “very serious concern,” with another 29 percent
choosing “somewhat serious.” Moreover, polling by the nonpartisan Public Agenda
in the winter of 1997–98 revealed that 78 percent of black parents agreed that
testing “calls attention to a problem that needs to be solved.”21
Peter
Sacks, the suthor of a recent book on testing, dismisses those who support
testing as part of a “conservative backlash advocating advancement by ‘merit,’”
but important advocates for black and Hispanic children have joined the
standards crusade.22 Ramon C. Cortines, formerly the interim superintendent
of schools in Los Angeles, recently called the attack on assessments “insidious
racism” on the part of those who “want the status quo.”23 To
ignore the information that tests provide, in other words, is to perpetuate a
system that has been historically indifferent to the fate of black and Hispanic
students. The Education Trust is a Washington, D.C., organization devoted to
promoting academic achievement among blacks, Hispanics, and low-income
children. “Traditionally, of course, most advocates for such children have
shied away from high standards and high stakes,” Kati Haycock, the director, has
written.24 But she in unequivocal in her demand for
no-nonsense standards with uncompromising consequences for those who fail to
meet them. “Backing off from testing would just kick the problem of low student
achievement under the rug again,” she has said.25
Peter
Sacks talks about the “stigma of poor performance on mental tests.”26 But
Kati Haycock and those behind the drive for state educational reform are more
fearful of the consequences of letting schools ignore the racial gap in
academic achievement. That fear has prompted New York, Texas, and California to
consider racial and ethnic data in ranking public schools. In New York, for
instance, beginning with 2001, the performance of black and Hispanic students
in each school will be reported, and schools with a large racial gap in
academic performance won’t earn a good grade. Thus, an affluent suburb in which
the average score on the statewide tests is high will be penalized if that
average masks group differences.27 New York and other states are rejecting the notion
of racial double standards—lower academic expenctations for non-Asian
minorities. The job of educators is to close the racial gap, they say; the
tests tell a story that America ignores at its peril. The scores cannot be
fudged with formulas that adjust for “disadvantage” and suggest that black
children cannot keep up with their Asian peers.
An
Unsolved Mystery
Why do
so few black students graduate from high school with strong academic skills?
Black poverty, racial segregation, and inadequate funding for predominantly
black schools are standard items on the list of explanations. None withstands
close scrutiny. Income inequality, for instance, appears to play only a very
small role in black test performance. The rise in scores after 1970 came at a
time when the poverty rate was not changing significantly.28 And
when that educational progress halted, black poverty was not on the increase.
In fact, Jencks and Phillips conclude, eliminating black-white income
disparities would make almost no difference in the score of young black
children on a basic vocabulary test. (They focus exclusively on black-white
differences, ignoring the roughly similar gap between blacks and Asians.)
The
huge rise in out-of-wedlock births, precipitating the steep and steady decline
in the proportion of black children growing up with two parents, might seem
important in explaining educational performance of African American children.
Children raised in single-parent families do less well in school than others,
even when all other variables, including income, are controlled.29 But
marriage, per se, appears to make little difference. “Once we control a mother’s
family background, test scores, and years of schooling,” Jencks and Phillips
conclude, “whether she is married has even less effect on her children’s test
scores than whether she is poor.”30 Moreover, the disintegration of the
black nuclear family, noted by Daniel Patrick Moynihan as early as 1965, was
occurring rapidly in the period in which black scores were rising.
Do
urban schools—which a majority of black youngsters attend—lack the resources
needed to educate children properly? Spending on education has risen
dramatically in recent decades, and those new dollars have gone disproportionately
to schools with high concentrations of economically disadvantaged children.31 Contrary
to widespread popular belief, there is little difference in average
expenditures per pupil in central cities and suburbs.32
Nor
does a school’s racial mix matter after the sixth grade; it seems to affect
reading scores only in the early years and math scores not at all. Scores went
up from the early 1970s to the late 1980s when courts were instituting busing
plans, but black students who remained in predominantly African American
schools showed as much improvement as those attending integrated schools.33 Moreover,
the slide in black scores beginning in 1988 does not coincide with increasing
racial isolation.34
The
number of teachers per student, their credentials, and pay are also unaffected by
the racial identity of the children in a district, Jencks and Phillips show.
Schools that are mostly black, however, have teachers with lower test scores—in
part because black schools have more black teachers, they forthrightly
acknowledge. In addition, to the extent that schools substitute “critical
thinking” for factual knowledge, those who come to school from homes that
impart very little in the way of academic skills are likely to be further
disadvantaged, a problem that is further compounded when, in the name of racial
sensitivity, little is expected of black children.35 Moreover,
disorder in the classroom is a sure recipe for little learning.36
Good
Schools Get Good Results
Many
will argue, of course, that politicians, state boards of education, and often
the public are asking too much of schools. And solid scholars like Jencks and
Phillips make a strong case that “cognitive disparities between black and white
preschool children are currently so large that it is hard to imagine how
schools alone could eliminate them.” Those skills will improve when we change
the way black parents “deal with their children.” 37 They
suggest that social scientists take a close look at: “the way family members
and friends interact with one another and the outside world”; “how much parents
talk to their children, deal with their children’s questions, how they react
when their child learns or fails to learn something”; “cultural and
psychological differences.”38
Pessimism
is seductive, but good schools with impressive results scattered across the
nation suggest that educational mediocrity is the central problem. All the
students at the KIPP Academy, a South Bronx public school for grades 5 through
8, are from very low-income black or Hispanic families. As the school’s literature
acknowledges, in the neighborhood in which these youngsters live “illiteracy,
drug abuse, broken homes, gangs, and juvenile crime” are rampant. But KIPP has
the highest reading and math scores of any middle school in the entire
Bronx—despite the fact that two-thirds arrive in fifth grade unable to read. In
math, last year, it ranked fifth in all of New York. Its daily attendance
record of 96 percent is one of the highest in the whole state.39
KIPP’s
success is no mystery. All great schools have fabulous leadership, and KIPP is
the brainchild of David Levin, the director, who started out as the partner of
Michael Feinberg, running a sister school in Houston. The school day runs from
7:30 a.m. to 5:00 p.m., with
four hours of classes on Saturdays and three weeks of mandatory attendance in
the summer. (The package adds up to 67 percent more time in the classroom than
the national average.) Those who chronically do not finish their homework stay
even later. Teachers are available on a toll-free cell phone number from the moment
they leave the school until they arrive the next morning, and many receive ten
to fifteen calls a night.
KIPP
aims both to prepare students for college and to change peer culture. As the
school counselor put it, “We nurture feeling good about being a nerd; we tell
the students, you can play basketball and read books too.” Levin adds: “We
train kids to look at people and talk to them. Every moment in class, teachers
are role models, treating kids with respect. They dress properly. Everything
about the school is designed to teach. I never walk by a student without saying
hello.” He knows the name of every student, speaks Spanish, and thus can talk
directly to Hispanic parents with limited English.
KIPP
parents sign a contract that commits them to getting their kids to school on
time, helping their children to the best of their ability, and so forth.
Parents know how their kids are doing through a system of student “paychecks”
that also reward the students directly. Checks (in KIPP dollars) are issued
weekly on the basis of teacher evaluations in ten specific areas of
performance—including dress. Once a parent has endorsed the check, it can be
redeemed at the school store for books, supplies, and even CDs. Performance is
linked to awards in other ways as well. Students who get 100 on a test see
their names up on the classroom bulletin board. Students of the month are
listed. “You can’t have students feeling good about nothing,” Levin says. “We
make kids feel successful over little things . . . writing a complete sentence.”
Not a
minute of the KIPP day is wasted. When students arrive in the morning, they
pick up worksheets with problems to solve while teachers are correcting
homework or are otherwise occupied. If they have five minutes, they do five
minutes of work. Every class is structured, and the walls are plastered with
posters that, for instance, walk students through the process of writing.
(Think about what you want to say, organize your thoughts, write a draft,
revise, proofread.) Other posters go through the definition of an independent
clause and other rules of grammar. At every grade level, students write and
write and write.
The
messages the school delivers on its walls and through its teachers are integral
to its success. The guidance counselor talks about the dangerous culture of the
streets. Everywhere there are encouraging signs: “There Are No Shortcuts”; “No
Excuses”; “Be Nice!!! Work Hard!!!”; “All of Us Will Learn”; and “True
Champions Always Work Hard.” Other celebrated schools tell children they are
loved; KIPP says something more important: self-discipline and civility will
get you where you want to go.
The
KIPP students I spoke to all described their previous schools as places to
which they would never want to return. As one young boy put it: “We have a
closer relationship with our teachers here. We all get along. There is no
fighting.We learn more. In my other school, the teachers didn’t care that much.”
A girl added: “In my old school . . . there were three fights every day. Here
you would get in trouble for fighting. Why would a college want someone who
doesn’t behave?”
KIPP’s
demand that parents sign a contract of cooperation means the school, to some
extent, chooses its students. And that choice is probably integral to its
success. The many parochial schools that have a track record of success with
black and Hispanic children also have students whose parents want them to be
there.40 But most of these same youngsters in a different
educational setting would not be flourishing academically, it seems safe to
say. Schools do make a difference, but they need a minimal level of parental
cooperation. Michael Feinberg at Houston’s KIPP believes nine out of ten
low-income parents in the community with which he works would sign the
contract.41
The
American Project
“The
moral pulse” beats more strongly in America than in Europe, the great Swedish
economist Gunnar Myrdal noted in 1941.42 It was a theme he often returned to.
The country is “continuously struggling for its soul,” he wrote in his classic
1944 work, An American Dilemma.43 Myrdal did Americans the honor of taking seriously
their commitment to liberty, equality, justice, and fair opportunity. “The
Negro problem,” in his view, was a moral issue over which even ordinary
Americans brooded in their thoughtful moments. It may not have been true then,
more than half a century ago, but it is true now. Myrdal’s was a prescient
voice. Today, most Americans care about racial equality. In a land of plenty,
they do not want African Americans left out—second-class citizens, a deprived
nation within our nation. Racial equality is a moral commitment from which few dissent.
But
until the day on which blacks and whites are equally well educated, that
equality will remain a dream. The good news is that most eyes are now on K–12
schooling. Can we fix the schools? If KIPP and other such schools (woefully few
in number) provide ground for hope, they also deliver a sobering message: most
public school systems are an obstacle course that only the most extraordinary
principals can negotiate. Closing the racial gap in academic achievement will
require radical educational reform against which there will be much resistance.
But if racial equality is the persistent American dilemma, it is also the
American project. And thus, down a long road, schools will be forced to change.
Notes
1. This
information on the number of states instituting reform, etc., is taken from
the American
Federation of Teachers’ most recent annual report, Making Standards
Matter, 1999, available
only on the AFTWeb site (http://www.aft.org).The report notes
that “historically,
states and districts haven’t organized curriculum around a clearly
defined set of
expectations, nor have they developed assessment systems that measure
whether
students are meeting rigorous, publicly available standards.” The AFT’s 1999
report lists
twenty-two states as meeting the organization’s criteria for standards that
are
academically solid, a sharp rise from only three the year before.
2. Christopher
Jencks and Meredith Phillips, eds., The Black-White Test Score Gap
(Washington,
D.C.: Brookings Institution, 1998), pp. 7, 8, figs. 1–4.
3. See Richard
J. Murnane and Frank Levy, Teaching the New Basic Skills: Principles
for Educating
Children to Thrive in a Changing Economy (New York: Free Press, 1996).
A more detailed
technical version of their analysis is available in Richard Murnane,
John Willett,
and Frank Levy, “The Growing Importance of Cognitive Skills in Wage
Determination,”
Review
of Economics and Statistics 77 (1995): 251–66.
4. George
Farkas and Keven Vicknair, “AppropriateTests of RacialWage Discrimination
Require
Controls for Cognitive Skills: Comment on Cancio, Evans, and
Maume,” American
Sociological Review 61 (August 1996): 557–60. This is a critique of
A. Silvia
Cancio, T. David Evans, and David J. Maume, “Reconsidering the Declining
Significance of
Race: Racial Differences in Early Career Wages,” in the same issue of
the American
Sociological Review, pp. 541–56, which had measured education crudely
by levels of
schooling completed. The authors’ rejoinder to this critique (ibid., pp. 561–
64) argues that
it is inappropriate to control for education by using tests of cognitive
skills because
those tests are biased and really only test “exposure to the values and
experiences of
the White middle class” (p. 561). Employers are apparently guilty of
class and
racial bias if they want employees to be able to read a training manual or to
calculate how
many bags of grass seed and fertilizer the customer will need to make a
lawn that is 60
feet long or 40 feet wide.
5. Jencks and
Phillips, p. 6.
6. “Reaching
the Top: A Report of the National Task Force on Minority High
Achievement,”
College Board, 1999, p. 4.
7. Meredith
Phillips et al., “Family Background, Parenting Practices, and the
Black-White
Test Score Gap,” in Jencks and Phillips, eds., Black-White Test
Score Gap,
chap. 4. The
entire chapter is an analysis of the PPVT and other data bearing on the
relation
between young children’s cognitive skills and family background.
8. Meredith
Phillips, James Crouse, and John Ralph, “Does the Black-White Test
Score Gap Widen
After Children Enter School,” in ibid., p. 232.
9. Michael A.
Fletcher, “A Good-School, Bad-School Mystery: Educators Striving
to Close Racial
Gap in Affluent Ohio Suburb,” Washington Post, October 23,
1998,
p. A01.
10. The College
Board’s contrast is actually between white and Asians on the one
hand, blacks,
Hispanics, and Native Americans on the other. But the performance of
Hispanics (and
Native Americans) is a topic for another essay.
11. College
Entrance Examination Board, 1995 National Ethnic/Sex Data, unpaginated.
12. The OCR
draft guidelines, entitled “Nondiscrimination in High-Stakes Testing:
A Resource
Guide,” were first issued on May 17, 1999. They came close to equating
disparate
impact and discrimination, intimating that high-stakes tests of any sort could
be used only if
the consequences of getting a low score would not be the same for
blacks and
Hispanics as for whites and Asians. In mid-December a revised and softened
version was
leaked to the Chronicle of Higher Education (Patrick Healy, “Education
Department
Softens Its Tone in Latest Draft of Guide to Using Test Scores in Admissions,”
Dec. 13, 1999);
as this essay is being written, the full text is not available.
13. Patrick
Healy, “Affirmative Action Defenders Push Colleges to Back Draft
Guidelines on
Testing,” Chronicle of Higher Education, June 25, 1999, p. A42. Edley’s
ringing defense
of the guidelines referred to the harsher version issued in May.
14. Julie
Blair, “NAACP Criticizes Colleges’ Use of SAT, ACT,” Education Week,
December 1,
1999, p. 10.
15. William G.
Bowen and Derek Bok, The Shape of the River: Long-Term Consequences
of Considering
Race in College and University Admissions (Princeton, N.J.:
Princeton
University Press, 1998), is a brief on behalf of racial preferences and thus
argues for the
admission of black and Hispanic students with academic credentials
weaker than
those of their Asian and white peers accepted to highly competitive schools.
Nevertheless,
the authors acknowledge the underperformance of black college students
relative to
their SAT scores: “The average rank in class for black students is appreciably
lower than the
average rank in class for white students within each SAT interval. . . . It
is one strong
indication of a troubling phenomenon often called ‘underperformance.’
Black students
with the same SAT scores as whites tend to earn lower grades”; p. 77,
italics theirs.
16. News of
what ETS called its “Strivers” program surfaced in the Wall Street
Journal on August 31,
1999, and was subsequently picked up by other publications. It
was an
unfinished project, although ETS was willing on the record to discuss the
central
idea. For more
detail, see “The End of Meritocracy: A Debate on Affirmative Action,
the S.A.T., and
the Future of American Excellence” betweenNathan Glazer and Abigail
Thernstrom, New Republic, September 27,
1999, pp. 26–29.
17. Deborah
Meier, Will Standards Save Public Education? (Boston: Beacon Press,
2000), foreword
by Jonathan Kozol, p. xi.
18. Meier,
ibid., p. 85.
19. Theodore
Sizer, “A Sense of Place,” responding to Meier, ibid., p. 72.
20. Rob
Hotakainen, “Calling GraduationTests Harsh,Wellstone Offers Alternative
Plan,” Minneapolis
Star
Tribune, April 4, 2000, p. 1A.
21. The “respect
and confidence” question was asked in a 1999 Gallup poll; the
judgment about “low
academic standards” was made in response to a Peter D. Hart
Research
Associates 1988 survey; Public Agenda polled employers in 1988. The poll of
black parents
is reported in Steve Farkas and Jean Johnson, “Time to Move On:
African-Americans
and White Parents Set an Agenda for Public Schools,” A Report from Public
Agenda, 1998,
p. 17.
22. Peter
Sacks, Standardized Minds: The High Price of America’s Testing Culture
and What We Can
Do About It (Cambridge, Mass.: Perseus, 2000), p. 6.
23. Todd S.
Purdum, “A ‘Pied Piper’ Is Shaking Up the Schools in Los Angeles,”
New York Times, April 15,
2000, p. A7.
24. “Ticket to
Nowhere: The Gap Between Leaving High School and Entering
College and
High-Performance Jobs,” in Thinking K–16 (a publication of the Education
Trust) 3, no. 2
(fall 1999): 2.
25. Letter to
the New York Times, April 16, 2000, sect. 4, p. 14.
26. Standardized Minds, p. 5.
27. Kate
Zernike, “Regents Vote to Rank Schools, Weighing Performance of Minority
Students,” New York Times, May 5, 2000,
p. A23.
28. U.S. Bureau
of the Census, Current Population Reports, pp. 60–189, Income,
Poverty, and
Valuation of Noncash Benefits: 1994 (Washington, D.C.: U.S. Government
Printing
Office, 1996), table B-6.
29. See Sara
McLanahan and Gary Sandefur, Growing Up with a Single Parent: What
Hurts, What
Helps (Cambridge, Mass.: Harvard University Press, 1994).
30. Jencks and
Phillips, Black-White Test Score Gap, p. 10 and chap. 4.
31. Between the
1969–70 school year and 1995–96, nationwide expenditures per
pupil (in
constant ‘95–’96 dollars) rose from $3,337 to $6,146, a gain of 84 percent. In
the same
period, per capita income (in constant dollars) rose by only 46 percent; 1998
Digest of
Educational Statistics, p. 183; 1998 Statistical Abstract of the
United States, p.
476. Since the
passage of the Elementary and Secondary Education Act (ESEA) in 1965,
the federal
government has spent $118 billion on making sure poverty ceased to be “a
bar to learning”—although
with results no one celebrates. For an excellent discussion
of Title I of
the ESEA, see George Farkas, “Can Title I Attain Its Goal?” paper prepared
for
presentation at a Brookings Institution conference, May 17, 1999.
32. National
Center for Education Statistics, Disparities in Public School District
Spending,
1989–1990, NCES 95-300 (Washington, D.C.: U.S. Government
Printing
Office, 1995),
p. 15. William N. Evans has also tabulated census data for 1972, 1982,
and 1992 and
concluded that the average black student and average white student both
live in
districts that spend just under $5,400 per pupil. Evans, Sheila Murray, and
Robert Schwab, “School
Houses, Court Houses, and State Houses After Serrano,”
Journal of
Policy Analysis and Management, January 1997, pp. 10–31.
33. David J.
Armor, Forced Justice: School Desegregation and the Law (New York:
Oxford
University Press, 1995), pp. 92–98.
34. On the
stability of de facto segregation, see America in Black and White, chap.
12.
35. E. D.
Hirsch Jr., The Schools We Need and Why We Don’t Have Them (New
York:
Doubleday, 1996), pp. 43, 54. Shelby Steele has made the point with particular
eloquence about
low expectationspackaged as racial sensitivity.Even minimal academic
demands, he
argues, are often stymied by a deep and painful sense of “racial vulnerability”
that whites and
blacks share. The vulnerability of whites is to the charge of
racism, that of
blacks is to the claim of inferiority. In different ways both are wracked
by powerful
doubts about their own self-worth. See “The Race Not Run,” NewRepublic,
October 7,
1996, p. 23. The Content of Our Character: A New Vision of Race in America
(New York: St.
Martin’s Press, 1990) makes the argument at much greater length.
36. On chaos
and violence in the schools, see Abigail Thernstrom, “Courting Disorder
in the Schools,”
Public
Interest 136 (summer 1999): 18–34.
37. Jencks and
Phillips, eds., pp. 24, 45, 46. The College Board task force also refers
to the “cultural
attributes of home, community, and school” and talks at length about
the attitudes
toward school and toward hard work that Asian parents transmit to their
children. “Reaching
the Top,” pp. 14, 17–18.
38. Jencks and
Phillips, eds., p. 43.
39. All the
information on KIPP comes from the author’s three visits to the school,
from the
literature the school provides, and from Samuel Casey Carter, No Excuses:
Lessons from 21
High-Performing High-Poverty Schools (Washington, D.C.: Heritage
Foundation,
2000).
40. Scholars
have been looking closely at the record of Catholic schools for decades;
there is solid
research tracing the sources of their success with inner-city students. See,
for instance,
Anthony S. Bryk, Valerie E. Lee, and Paul B. Holland, Catholic Schools
and the Common
Good (Cambridge, Mass.: Harvard University Press, 1993);
James S.
Coleman and
Thomas Hoffer, Public and Private High Schools: The Impact of Communities
(New York:
Basic Books, 1987). All the experimental voucher programs are
being carefully
watched as well. For a summary of the evidence on vouchers as of 1998,
see the
collection of essays in Paul E. Peterson and Bryan C. Hassel, eds., Learning from
School Choice (Washington,
D.C.: Brookings Institution, 1998).
41. Personal
communication with Michael Feinberg.
42. Quoted in
Walter A. Jackson, Gunnar Myrdal and America’s Conscience: Social
Engineering&
Racial Liberalism, 1938–1987 (Chapel Hill: University of North
Carolina
Press, 1990),
p. 151. The quotation was from Kontakt med Amerika, a book
co-authored
with Myrdal’s
wife, Alva, but Jackson attributes the sections on race solely to Gunnar
Myrdal.
43. Gunnar
Myrdal, An American Dilemma (New York: McGraw-Hill paperback
ed., 1964), p.
4.
==============================
Schools That Work for Minority Students
CLINT
BOLICK
Hysteria
followed the plummeting admission rates of blacks and
Hispanics at elite public universities in California and Texas following the
curtailment of race and ethnic preferences.1 The concern was appropriate but
overdue and misdirected. Critics claimed that the demise of race-based “affirmative
action” meant the end of college opportunities for many blacks and Hispanics.2
In
reality, the enrollment decline was a long-overdue wake-up call to a dire
crisis that seemingly has escaped the attention of many public policy makers
and the establishment civil rights groups: the appalling failure of the nation’s
public school system to deliver quality educational opportunities to a large
portion of America’s schoolchildren. Though concentrated primarily on
economically disadvantaged youngsters in the inner cities, that failure
manifests itself in disproportionately poor academic credentials for black and
Hispanic students. In a nondiscriminatory college admissions process, that
disparity leads to lower admissions rates for blacks and Hispanics; by
contrast, in a system where blacks and Hispanics are leapfrogged over more
qualified applicants into academic institutions for which they are not
adequately prepared, it leads to disproportionately higher college dropout
rates for the two groups.
No
substitute exists for high standards and adequate academic preparation at the
elementary and secondary school levels, and we are perpetuating a cruel hoax to
assert otherwise. Race-based affirmative action in college admissions is a
purely cosmetic response that allows underlying educational problems to fester
and grow. An immigrant cabdriver recently distilled the policy dilemma: “They
don’t understand that the problem is not in college. The problem is in
kindergarten.” Removing the superficial tool of racial preferences from the
policy-making arsenal means that policy makers must address at last the core
problems that produce racial and ethnic disparities in higher education.
Traditional
“civil rights” responses to educational inequality have focused on (1) racial
balancing through forced busing or other mechanisms or (2) increased spending.
Both approaches have failed utterly to close the gap in educational achievement.3 Fortunately,
promising alternatives are appearing on the horizon, focusing not on social
engineering but on parental empowerment. By giving parents—who have the
greatest stake in their children’s success—greater power over education
decisions and resources, it appears we finally can deliver on the sacred
promise of equal educational opportunities for all of America’s schoolchildren.4
Educational
Crisis and Systemic Failure
It
seems impossible that nearly forty-five years have passed since Brown v. Board
of Education. During that time, much progress has been made
toward erasing the color line from education. As Stephan and Abigail Thernstrom
report in America in Black and White, high school graduation rates now
are nearly the same for blacks and whites. Progress for blacks in this regard
has been explosive: in 1980, only 51.2 percent of blacks over age 25 had
graduated from high school; but by 1995, 73.8 percent of blacks over 25—and
86.5 percent of blacks between the ages of 25 and 29—were high school graduates;
college attendance rates are up, too, from 21.9 percent of blacks in 1980 to
37.5 percent in 1995.5 Those gains are important because education
correlates closely with income. For instance, black women who have graduated
from high school, attended some college, or graduated from college all make
more money on average than their white female counterparts.6
But
from there the news gets bad. Although black high school students steadily were
closing the achievement gap with whites in the 1980s, that gap has widened
substantially during the past decade. The typical black high school student
graduates roughly four academic years behind typical white high school seniors.7 The
National Assessment of Educational Progress (NAEP) reported in 1995 that only 12
percent of black high school seniors (compared with 40 percent of whites) were
proficient in reading.8 The 1997 NAEP found that while 76 percent of white
fourth-graders were proficient in basic mathematics skills, only 41 percent of
Hispanic and 32 percent of black students demonstrated basic proficiency.9
The
crisis is far more pronounced and debilitating among low-income minority
children, who are consigned disproportionately to failing large urban school
systems. Students often must pass through metal detectors and literally risk
their lives on a daily basis for the chance to obtain a woefully substandard
education. Two cities where I have litigated present the problem in especially
graphic terms. In Cleveland, the numbers 1 in 14 are emblazoned permanently on
my memory: children in the Cleveland Public Schools have a 1-in-14 chance of
graduating on time from high school at senior-level proficiency—and an
equivalent 1-in-14 chance each year of being a victim of crime in the schools.
In the Milwaukee Public Schools (MPS), only 48 percent of the students
graduate—a dropout rate more than seven times the statewide average—and only 15
percent of children from families on public assistance graduate. In eleven
Milwaukee public high schools that enroll more than three-fourths of the city’s
black students, the median grade-point average is less than 1.5 on a four-point
scale.
When
poor and minority inner-city students have no greater chance of graduating with
basic proficiency than of being a victim of crime in the schools, we know the
system is failing. With statistics like these, what is surprising is not that
minority schoolchildren are admitted to colleges and universities at rates
lower than their proportionate share; what is surprising is that the numbers are
not much, much worse.
Apologists
for the status quo search frenetically for scapegoats: standardized tests are
biased, the students are too poor to educate, their parents don’t provide
sufficient support, the schools are inadequately funded.10 Yet students
from identical socioeconomic circumstances do much better in private schools. A
recent study by University of Chicago economist Derek Neal found that although
Catholic schools produce negligible academic gains for suburban and white
students, they strongly improve educational outcomes for urban minority
children. Holding other factors constant, Neal found that the odds of high
school graduation for urban black and Hispanic children increase from 66
percent to at least 88 percent in Catholic schools. In turn, he found that
three times as many black students who attend Catholic high schools go on to
graduate from college. Not surprisingly, those academic gains translate into
substantially higher wages in the labor market. Neal concludes bluntly, “Urban
minorities receive significant benefits from Catholic schooling because their
public school alternatives are substantially worse than those of whites or
other minorities who live in rural or suburban areas.”11
Why do
suburban public schools and urban private schools do a relatively good job in
educating children, while urban public school systems as a whole are failures?
That question was addressed in a pathbreaking Brookings Institution study by
John E. Chubb and Terry M. Moe.12 They found that although student ability and
parental background are important factors in student achievement, school
organization also plays a central role. The key differences between effective
and ineffective schools are autonomy, parental involvement, and a sense of
mission. Urban public schools, Chubb and Moe observed, are characterized by
massive bureaucracies that make it difficult for teachers to teach, for parents
to exert influence, or for reform to take hold. Moreover, because poor students
usually have nowhere else to go, large urban school systems are unresponsive to
consumer demands and instead try to satisfy special-interest groups and
politicians who control the purse strings. Meanwhile, parents have little
influence, particularly on an individual basis. Private and suburban public
schools, by contrast, tend to have smaller bureaucracies and to be more
responsive to parental concerns, in part because parents have the resources to
take their children elsewhere. Chubb and Moe found that effective schools boost
student achievement by one year for every four. They concluded that greater
parental choice and control over resources are necessary for low-income parents
to improve their children’s education and to effectively prod public schools to
improve.
The
Catalyst: Parental Choice
Those
were the goals State Representative Annette Polly Williams had in mind when she
proposed the Milwaukee Parental Choice Program, the nation’s first school
choice program targeted to inner-city, low-income families. The program
initially was modest in scope: only 1 percent of Milwaukee Public School
students (roughly 1,000) were eligible to use their share of the state’s
education contribution as full payment of tuition in nine participating
nonsectarian private schools. But the implementation of the program in the fall
of 1990 set off an education revolution. For the first time ever, the program
transferred control over public education funds from bureaucrats to parents and
forced the public schools to compete for low-income youngsters and the resources
they commanded. Predictably, the program prompted litigation by the teachers’
union and a blizzard of regulations designed to destroy the program by
bureaucratic strangulation. Both counterattacks were beaten back.13 So in
the fall of 1990, nearly one thousand low-income youngsters were able to cross the
threshold to a brighter educational future in a dozen or so nonsectarian community
private schools.
The
assessments by the state’s designated researcher, John Witte, produced odd
findings over the program’s first four years: parental involvement was strong,
satisfaction was high, but student achievement failed to rise. Those results
were seemingly contradictory, given that parental involvement and student
achievement are closely linked. That conundrum was magnified by Witte’s refusal
to release data to other researchers.14 The confusion dissipated when a team
of researchers led by Harvard University political scientist Paul E. Peterson
finally obtained the data. For the first time, they compared achievement of
students who had gained access to private schools through the random selection
process with students who had not. The result: little academic change over the
students’ first two years in the program, but significant progress in the third
and fourth years. Peterson found that over its first four years, the program narrowed
the gap between minority and nonminority test scores by between one-third and
one-half—an absolutely momentous accomplishment. 15
Zakiyah
Courtney, director of Milwaukee’s Parents for School Choice and former
principal of Urban Day School, testified:
I was
glad to see . . . a study that reflected what many of us who have been working
directly with the families and the children all along knew. And that is that
parental satisfaction does make a difference; and that oftentimes you may not
see those high achievement scores in the beginning, but if you give those
children the opportunity to stay and work in the program, that you do see those
differences.16
But
apart from its benefits for kids for whose parents now can choose better
schools, the program unquestionably has also had a positive impact on the
public schools, forcing them to pursue long-overdue systemic reforms. At an
evidentiary hearing on the program in 1996, both former MPS superintendent Dr.
Howard L. Fuller, and his successor, Robert Jasna, agreed that the program had
created a prod for long-overdue systemic reforms.17 Fuller supported the program’s
expansion in 1995 to increase the number of eligible children to 15,000 and to
allow religious schools to participate. Fuller explained:
I
think that what it will bring into play would be, in addition to the existing schools,
there will be new schools out there that will come into being that will find
their niche to begin to teach kids that we are not currently reaching or that
we’re losing. I think it will begin to give poor parents some capacity to have
leverage over this entire discussion. And the reason they will have leverage is
because they will begin to have leverage over resources, the same type of
control over resources that people with money have. . . . You begin to create a
synergism for change that I think is key, if the system is going to be changed,
so that we . . . save these kids that we’re losing each and every day.18
The
Milwaukee program’s expansion was enjoined before it could go into operation in
the fall of 1995 as a result of litigation brought by the teachers’ union, the
American Civil Liberties Union, the National Association for the Advancement of
Colored People (NAACP), and others, who asserted that the program violated the
prohibition of religious establishment in the state and federal constitutions.
(Similar lawsuits are pending against school choice programs in Ohio, Vermont,
Arizona, Maine, and Pennsylvania.) In June 1998, the program was upheld by the
Wisconsin Supreme Court, setting up possible resolution of the constitutional
issue by the U.S. Supreme Court.19 In the fall of 1998, the expansion of the Milwaukee
program finally commenced, with an estimated 6,000 lowincome youngsters
attending more than eighty private religious and nonsectarian schools.20
Meanwhile,
a second school choice program championed by Governor George Voinovich and City
Councilmember Fannie Lewis was created in 1996, providing $2,500 scholarships
to approximately 3,000 economically disadvantaged children, allowing them to
attend private secular and religious schools in Cleveland. Again, early results
appear promising.21 Similar promising results are also reported in privately
funded scholarship programs serving low-income schoolchildren in dozens of
other cities across the country.22 As Paul Peterson has observed, “The choice movement
is spreading in good part because its theoretical underpinnings seem more powerful
than ever.”23
Other
forms of parental choice are blossoming. Arizona, which boasts the nation’s
most wide-ranging charter school system, approved a $500 state income tax
credit for contributions to private scholarship funds, which was upheld by the
Arizona Supreme Court.24 In May 1999, a bipartisan majority of the Florida
Legislature enacted Governor Jeb Bush’s A public education reform program,
within which parental choice is an important element. The program creates a
grading system for all public schools in the state, provides financial rewards
for excellent schools, gives extra help to students in failing schools, and
allows families whose children are in failing schools to opt out into better
public schools or private schools. In essence, the program offers the first
money-back guarantee by creating both choice and competition that should
improve public education for everyone. It emphasizes that the proper concern of
public education is not where children are educated but whether they
are educated. The threat of scholarships also is spurring spirited efforts
among public school districts to improve schools that are receiving “F” grades.25
Still,
a school choice program for the District of Columbia, approved in 1998 by
bipartisan majorities in both houses of Congress, was vetoed by President
Clinton, in spite of support from a large majority of residents, particularly
blacks. Powerful special interest groups have combined to stifle parental
choice all around the nation. The question is how long those defenders of the
status quo can delay the day of reckoning with America’s most urgent crisis—and
how many children’s lives and educational opportunities will be sacrificed in
the process.
Parental
Choice and Public Opinion
Public
opinion is moving strongly and steadily in favor of parental choice. There are
several possible explanations: (1) In spite of massive financial resources and
constant excuses from the education establishment, the academic performance of
public schools, even in affluent suburbs, is declining, particularly compared
with schools in other industrialized nations. (2) The news about parental
choice programs such as school vouchers and charter schools is generally
promising; reality is debunking the fears raised by choice opponents. (3)
Changing demographics are influencing public opinion: young people with
children are used to making choices and are comfortable about selecting from an
array of educational options.
Whatever
the explanation, the trend is unmistakable. For the first time, the 1998 Phi
Delta Kappa–Gallup poll found that a majority of Americans support parental
choice. Asked whether they favor allowing parents to send their school-age
children to any public, parochial, or private school of their choice with the
government paying part or all of the tuition, 51 percent of all respondents
support choice, while 45 percent are opposed. Only two years ago, the same idea
was opposed by a margin of 54 to 43 percent. Among the groups who most strongly
support parental options are nonwhites (68 percent), people 18–29 years of age
(63 percent), and, notably, public school parents (56 percent).26
Support
for parental choice is even greater in Wisconsin, which has had eight years of
experience with the Milwaukee program. A 1998 poll by Louis Harris &
Associates found that Wisconsin residents support parental choice by a margin
of 61 to 32 percent.27 Parental choice draws majority support in all areas
of the state and from whites, blacks, men, women, Republicans, Democrats,
independents, conservatives, and liberals. The margin in Milwaukee is 65 to 29
percent, and residents back the Milwaukee Parental Choice Program specifically
by an even greater 71 to 24 percent. The closer people reside to the program,
the more likely they appear to support parental choice.
What
is perhaps most remarkable,and disturbing, is the chasm between mainstream
minority individuals and establishment civil rights organizations on issues
over parental choice. Black Americans consider education the top national
priority.28 That concern is well placed. A 1997 survey by the
Joint Center for Political and Economic Studies found that while 37.5 percent
of white parents considered their schools “fair” or “poor,” 64 percent of
blacks and 61 percent of Hispanics gave their schools the same low grades. Not
surprisingly, the poll found that while support for school choice was evenly
split among whites, it was strong among both blacks (56 to 37.5 percent in
favor) and Hispanics (65 to 29 percent in favor). Support for school choice was
most intense among those in the age bracket most likely to have school-age
children: 86.5 percent of blacks between ages 26– 35 back school choice, with
only 10 percent opposed.29
Similarly,
aWashington
Post poll found that a large majority of District of Columbia
residents backed the low-income scholarship program passed by Congress but
vetoed by President Clinton and opposed by liberal black politicians such as
Delegate Eleanor Holmes Norton.30 The residents supported the scholarship program by
a margin of 56 to 36 percent. While whites and blacks with incomes over $50,000
split fairly evenly over the issue, lower-income blacks favored the legislation
by a margin of 65 to 28 percent. “I would jump at the chance to send my son to
private school,” said Janice Johnson, who lives in one of the poorer sections
of the city.
Meanwhile,
1,001 low-income children from among more than 7,500 applicants received
support from the Washington Scholarship Fund, which is financed by businessmen
Theodore J. Forstmann and John Walton.31 In light of strong minority support
for school choice, there is little wonder that establishment civil rights
groups such as the NAACP are struggling for relevancy. The MilwaukeeNAACP
chapter joined the lawsuit against the Milwaukee Parental Choice Program in
spite of overwhelming support for the program among black city residents. The
national NAACP last year announced an unholy alliance against parental choice
with People for the American Way. Parental Choice is “exploitative of the black
community,” contends Mary Jean Collins, PAW’s national field director. “The philosophy
of the right is always, ‘Give my kid what he wants and to hell with the rest.’
For that attitude to get into the black community would be shameful.”32
Dissenters
such as the Urban League of Greater Miami and former Atlanta mayor and U.N.
ambassadorAndrewYoung reject such patronizing attitudes and support school
choice as an essential component of civil rights. Former representative Floyd
Flake, whose church in Queens, New York, operates a private school, says: “When
a white person kills a black person, we all go out in the street to protest.
But our children are being educationally killed every day in public schools and
nobody says a thing.”33 It is time for politicians to recognize the will of
the people, to reject the entreaties of special-interest groups, and to make
parental choice a reality.
The
Broader Context of Education Reform
Never
has the climate for reform been so vibrant—nor the need for reform so urgent.
In addition to parental choice encompassing private schools, promising reforms
include (1) charter schools, which are autonomous public schools often operated
by private or nonprofit entities; 34 (2) contracting out public schools
to private management firms such as the Edison Project;35 and
(3) tax deductions and credits that allow people to deduct their children’s
education costs or to contribute to privately funded scholarship funds.36
Meanwhile,
private philanthropy is working to meet demand from low-income parents to
secure better education for their children through programs like the Children’s
Scholarship Fund and CEO America. In April 1999, 1.25 million children applied
for 40,000 CSF scholarships. Andrew Young likened the outpouring to Rosa Parks’s
refusal to give up her bus seat and to Martin Luther King Jr.’s letter from a
Birmingham jail. Declared Young:
If
families were allowed to seek a quality education wherever it may be found, who
would benefit? Simple: Those who aren’t getting a quality education and those
who can deliver it. Certainly, some will oppose competition— just as AT&T
once fought the breakup of its monopoly. Others will reflexively resist the
redistribution of power to poor families. Still others will wave their worn-out
ideologies to defend a system of educational apartheid while demonizing anyone
who promotes a parent’s right to choose. . . . I predict that we will one day
look back on the 1.25 million who applied for educational emancipation—for the
chance to seek the light and oxygen of a nourishing education—not as victims,
but as unwitting heroes with whom a great awakening was begun.37
Parental
choice is a central facet of systemic education reform that places equal
resources behind each child and allows the funds to follow children to whatever
schools—public, private, or religious—their parents choose.38 Child-centered
education funding transforms the focus of public education from public schools
as ends in themselves to publicly funded education in whatever schools parents
deem best. If parents choose public schools, the funds stay in those schools
under the control of the schools themselves, rather than filtering down through
an education bureaucracy. Only through a system of choice, competition, and
accountability where parents are sovereign will public schools in the inner
cities begin to improve. If we can do only one thing in public policy to
improve prospects for minority individuals and economically disadvantaged
people, there is nothing more tangible or important than making good on the
promise of equal educational opportunities. As I have acknowledged before, if I
were given the option, straight up or down, of abolishing racial preferences or
adopting parental choice on a nationwide basis, in a heartbeat I would opt for
the latter, for it would reduce the pressure for divisive race-based solutions.
Unfortunately, no one is offering that choice: the same reactionary leaders who
support racial preferences are blocking the schoolhouse doors for the very
people whose interests they falsely claim to represent.
That
won’t last long. Nothing that Jesse Jackson, Kweisi Mfume, Bill Clinton, Al
Gore, or others like them can say to inner-city parents will convince them not
to pursue educational opportunities their children desperately need. Milwaukee
parent Pilar Gonzalez makes that plain: “I will find a way to have my children
attend private school even if it means less food on the table. A quality
education for my children is that important.”39 That is the primary civil rights
goal of the millennium: making it possible at last for Pilar Gonzalez and
millions of others like her to secure the best possible education for their
children.
Notes
The author
expresses appreciation to Daron Roberts, a University of Texas student
who interned at
the Institute for Justice in the summer of 1998, for research assistance.
1. The end of
racial preferences in California was attributable first to a decision
to curb
preferential admissions policies by the Regents of the University of
California,
which
subsequently was extended by the California Civil Rights Initiative
(Proposition
209) to all
public postsecondary schools. In Texas, the cessation of preferences was due
to the decision
striking down preferential admissions at the University of Texas School
of Law in Hopwood v. Texas, 78 F.3d 932
(5th Cir.), cert. denied, 116 S.Ct. 2850 (1986).
2. In any
event, that prediction has now definitively been discredited. See, e.g.,
James Traub, “The
Class of Prop. 209,” New York Times Magazine, May 2, 1999, p. 44.
3. For an
examination of the effects of forced busing, see David J. Armor, Forced
Justice: School
Desegregation and the Law (New York: Oxford University Press, 1995).
For a
discussion of the lack of correlation between increased educational
performance,
particularly in
the context of the lavish Kansas City desegregation decree, see Blake
Hurst, “Runaway
Judge,” American Enterprise, May–June 1995, pp. 53–56.
4. In Brown v. Board
of Education, 347 U.S. 483, 493 (1954), the U.S. Supreme
Court declared
that education, “where the state has undertaken to provide it, is a right
which must be
made available to all on equal terms.”
5. Stephan
Thernstrom and Abigail Thernstrom, America in Black and White: One
Nation,
Indivisible (New York: Simon & Schuster, 1997), pp. 190–91,
192.
6. Ibid., p.
445.
7. Ibid., p.
355.
8. See Dennis
Kelly, “Kids’ Scores for Reading ‘In Trouble,’” USA Today, April
28–30, 1995, p.
1A.
9. See “U.S.
Students Make Progress in Math,” Dallas Morning News, February 28,
1997, p. 6A.
10. In fact,
like many other large urban school districts, the Milwaukee and Cleveland
districts spend
more per pupil than the statewide averages.
11. Derek Neal,
“The Effects of Catholic Secondary Schooling on Educational
Achievement,” Journal of Labor
Economics 15: 100. Neal’s findings echo similar studies
from the 1980s.
See James Coleman, Thomas Hoffer, and Sally Kilgore, High School
Achievement:
Public, Catholic, and Private Schools Compared (New York:
Basic Books,
1982); and
Andrew Greeley, Catholic High Schools and Minority Students (London:
Transaction,
1982). Recent evidence indicates that Hispanic students, too, fare better
in Catholic
schools. See Anne-Marie O’Connor, “Many Latinos Fare Better in Catholic
Schools,” Los Angeles
Times, August 3, 1998.
12. John E.
Chubb and Terry M. Moe, Politics, Markets, and America’s Schools
(Washington,
D.C.: Brookings Institution, 1990).
13. See Davis v. Grover, 480 N.W.2d
460 (Wisc. 1992).
14. Witte
subsequently has concluded that the results of limited school choice are
favorable. See
John F. Witte, The Market Approach to Education:An Analysis of America’s
First Voucher
Program (Princeton, N.J.: Princeton University Press,
2000).
15. Jay P.
Green, Paul E. Peterson, and Jingtao Du, The Effectiveness of School Choice
in Milwaukee: A
Secondary Analysis of Data from the Program’s Evaluation (Cambridge,
Mass.: Harvard
University John F. Kennedy School of Government, 1996).
16. Transcript
of Evidentiary Hearing, Jackson v. Benson, No. 95-CV-1982 (Dane
County, Wisc.,
Circuit Court, Aug. 15, 1996), p. 77.
17. Ibid., pp.
48, 165.
18. Ibid., p.
51.
19. Jackson v.
Benson, 578 N.W.2d 602 (Wisc. 1998).
20. See Jon
Jeter, “As Test of Vouchers, Milwaukee Parochial School Exceeds Expectations,”
Washington Post, August 31,
1998.
21. See Jay P.
Greene, William G. Howell, and Paul E. Peterson, “Lessons from the
Cleveland
Scholarship Program,” in Paul E. Peterson and Bryan J. Hassel, eds., Learning
from School
Choice (Washington, D.C.: Brookings Institution, 1998), p.
357.
22. See, e.g.,
R. Kenneth Godwin, Frank R. Kemerer, and Valerie J. Martinez,
“Comparing
Public Choice and Private Voucher Programs in San Antonio,” in ibid.,
p. 275; and
David J.Weinschrott and Sally B. Kilgore, “Evidence from the Indianapolis
Voucher
Program,” in ibid., p. 307.
23. Paul E.
Peterson, “School Choice: A Report Card,” in ibid., p. 8.
24. Kotterman v.
Killian, 972 P.2d 606 (Ariz. 1999).
25. Carol
Innerst, Competing to Win: How Florida’s A+ Plan Has
Triggered Public
School Reform (2000). (This
report was copublished by five groups.)
26. The 30th Annual
Phi Delta Kappa–Gallup Poll of the Public’s Attitudes Toward
the Public
Schools (1998). The poll surveyed attitudes about a wide
range of parental
choice
alternatives. The pollsters found that one proposal championed primarily by
Republicans—tax
credits for private school tuition—actually is supported by a higher
percentage of
Democrats (by 61 to 37 percent in favor) than by Republicans (57 to 42
percent in
favor).
27. Louis S.
Harris&Associates, Inc., “Wisconsin Residents Strongly FavorVoucher
System and
Choice,” news release, August 17, 1998.
28. A survey
conducted November 5–7, 1996, by the Polling Company found that
a large
plurality of blacks (42 percent) considered education the top national
priority,
compared with 25
percent of whites. Fighting crime and drugs was the second top
priority for
blacks (21 percent).
29. See David
A. Bositis, 1997 National Opinion Poll: Children’s Issues (Washington,
D.C.: Joint
Center for Political and Economic Studies, 1997).
30. See Sari
Horwitz, “Poll Finds Backing for D.C. School Vouchers,” Washington
Post, May 23, 1998,
p. F1.
31. Debbi
Wilgoren, “1,001 D.C. Students Win Scholarships,” ibid., April 30, 1998, p. B1.
32. Quoted in
Samuel G. Freedman, “The Education Divide,” Salon Magazine,
September 30,
1997.
33. Quoted in
ibid.
34. Several
dozen states permit charter schools, although some jurisdictions (such
as Arizona,
Michigan, and the District of Columbia) provide for far greater autonomy
than others.
See, e.g., Clint Bolick, Transformation: The Promise and Politics of
Empowerment
(Oakland,
Calif.: Institute for Contemporary Studies, 1998), pp. 53–60; Bruno
Manno, Chester
E. Finn Jr., and Louann A. Bierlein, “Charter Schools as Seen by
Students,
Teachers, and Parents,” in Peterson and Hassel, eds., p. 275; and Bryan J.
Hassel, “Charter
Schools: Politics and Practice in Four States,” in Peterson and Hassel, p. 249.
35. See, e.g.,
John E. Chubb, “The Performance of Privately Managed Schools: An
Early Look at
the Edison Project,” in Peterson and Hassel, eds., p. 213.
36. In addition
to the Arizona state income tax credit for contributions to private
scholarship
funds, Minnesota provides tax deductions for school tuition, and both
houses of the
Illinois legislature passed a tax credit for tuition in 1999.
37. Andrew
Young, “Let Parents Choose Their Kids’ Schools,” Los Angeles
Times,
April 29, 1999,
p. 9.
38. The concept
of child-centered education funding is championed most prominently
by Arizona
Superintendent of Public Instruction Lisa Graham Keegan. See, e.g.,
Clint Bolick, “Charter
Reformer: Arizona’s Superintendent of Schools Points theWay
to an Education
Revolution,” National Review, April 6, 1998, pp. 42–44.
39. Quoted in
Bolick, Transformation, p. 34. Ms. Gonzalez is one of the parents
defending the
constitutionality of the Milwaukee Parental Choice Program, and I am
proud to
represent her.
==============================
Preferential Admissions in Higher Education
MARTIN
TROW
The historical
and
legal development of racial preferences in higher education, as well as their
impact, have been extensively analyzed.1 This essay approaches the issue from
a somewhat different vantage point, exploring how race-based preferences
operate as they are actually administered in a university setting. Universities
are little affected by Supreme Court decisions, the state of race relations
generally, or broad public opinion about “affirmative action” and the extent of
discrimination in the larger society. On campus, the leading players are the presidents,
chancellors, deans, department chairmen, and the affirmative action bureaucracy
that has emerged in response to the need to implement various affirmative action
laws and regulations. In describing the picture inside the academy, I draw
chiefly on material gathered in the course of watching the dramatic events
surrounding the public policies affecting university admissions in California
since July 1995, when the University of California Board of Regents voted to
prohibit the use of race or ethnicity in admissions and appointments.
It is
important to note that the issue of racial preferences in admissions to
universities and colleges arises only in those institutions that have more applicants
than they can admit. This group includes no more than a hundred or so out of
the 3,700 colleges and universities in the United States, but it consists of
the leading research universities, both public and private, as well as a few
dozen elite private liberal arts colleges that function as feeder institutions
for graduate and professional schools. The private research universities—Yale,
for example—and elite colleges like Amherst and Swarthmore typically choose
their students for admission largely on the basis of academic performance and
promise, although decisions are made on a case-by-case basis. To secure greater
“diversity,” they look with special favor on applicants from certain “underrepresented”
racial and ethnic groups. By contrast, the big public research universities
admit most undergraduates according to general criteria and formulas. In
seeking to secure a racially and ethnically diverse student body, they must
specify exactly how much weight is to be given to racial and ethnic
considerations.
Admissions
Procedures at the University of California
The baseline
formula for admission to the University of California has been prescribed by
the state’s Master Plan for higher education, virtually unchanged since it was
drawn up in the 1950s. It defines “eligibility” for admission to the university
as ranking in the top 12.5 percent in academic achievement of graduates of
California public high schools. The top 12.5 percent is identified by a formula
that combines the student’s high school grade point average and his or her
combined math and verbal SAT scores. In addition, the Regents have allowed each
of the eight campuses that make up the system to admit up to 6 percent of their
entering classes without regard for the 12.5 percent standard. This arrangement
for admission by “special action” permitted many athletes who were not top
students to enter, as well as students with unusual forms of preparation or
talent— for example, outstanding musicians and those who were educated at home or
abroad. Before the statewide ban on racial preferences in admissions, many of
these discretionary places were used to admit students from “underrepresented” racial
and ethnic groups who failed to qualify under the regular requirements.
In the
1980s and early 1990s, a number of the UC’s eight “general campuses” found that
they had more, and in some cases many more, eligible applicants than they could
admit. The solution was to allow each individual school to adopt a policy
somewhat independent of the statewide criteria, out of which came explicitly
preferential policies. The formulas differed on the several campuses. With the
approval of the Regents, Berkeley decided to admit half the entering class on
the basis of their scores on the combined SAT/GPA. In filling the other half, all eligible
minority applicants were automatically admitted. But critics charged the school
with having adopted a quota or “set-aside” for minority applicants, and in 1989
it abandoned the guarantee of admission for all eligible applicants from
minority groups. Yet it continued to give a huge advantage to black and
Hispanic applicants. The average black student admitted, for example, had SAT
scores 250–300 points lower than his or her white and Asian classmates and a
substantially weaker high school grade record as well.
These
students were not necessarily “disadvantaged” by any nonracial criteria.
Berkeley, for example, was especially attractive to the sons and daughters of
the new black middle class; in 1995, 30 percent of black undergraduates came
from families earning over $70,000. It was a troubling fact. Admissions
decisions, especially in public institutions, must appear as legitimate to
those not admitted to their campus of choice, the parents of future applicants,
and the general public. The legitimacy of the institution, supported by
taxpayer dollars, depends on criteria for entrance that are perceived as fair.
And yet most Americans do not believe in judging citizens on the basis of the
color of their skin.
Those
convictions have prevailed in California. The Regents’ vote to ban preferences
in 1995 and the passage of Proposition 209 a year later brought a halt to all
race-based admission procedures. Today, UC Berkeley is developing a selection
policy based on a reading of all applicant files rather than a statistical
formula, a more individualized system like those used by private universities.
Fair
Criteria
Racial
and ethnic preferences, where they are employed, rest on the assumption that
color is the central feature of a person’s identity— that character,
intelligence, energy, initiative, socioeconomic circumstance, and other
qualities are all less important. And thus in California both economically
privileged and low-income black and Hispanic students were equally eligible for
preferential treatment, whereas an Asian immigrant struggling with the language
and trying to support indigent parents got no break for “disadvantage.”
Similarly, whereas a white youngster from a single-parent, low-income household
was treated as a privileged Anglo, neither the son of a ruling family in a
South American country nor the student whose remote ancestors came from Spain
was asked to meet regular academic criteria. The whole Hispanic category as
defining identity was particularly troubling. For inexplicable reasons,
European Spaniards obviously count. But does the term also include Portuguese
and Brazilians? Hispanic was not the only troubling category. The term Asian
covers a wide variety of groups with little in common: old and new Chinese immigrations,
Japanese, Thai, Vietnamese of various kinds, Indonesians, Koreans, among
others. Crudely lumped together they outnumber whites at UCLA and Berkeley—the
most selective campuses—raising questions about their “overrepresentation.” In
April 1995, in Sacramento, President Clinton warned that “there are
universities in California that could fill their entire freshman classes with
nothing but Asian Americans.”2 The Asians had become yesterday’s Jews: an
allegedly too-ambitious group eligible for exclusion on the basis of their
national origins. Ironically, some of the “Asians” who were kept out in order
to make room in the university for more blacks and Hispanics were the grandsons
and granddaughters of the Japanese Americans who were confined to relocation
camps during World War II.
Preferential
admissions policies have a powerful and inherent tendency to reduce people in
all their variety and complexity to their racial or ethnic identity. And yet
higher education is supposed to enhance our sense of individuality, to
encourage and educate distinctive qualities of mind and character. Intelligence
and creativity, if allowed, burst through the constraints of social origin;
nurtured by our origins, we transcend them. In our private lives we may choose
to honor and celebrate the culture of a group to which we feel we belong. Or we
may reject that identification. People differ, and must be allowed to differ,
but the choices they make should be matters of private, not public, policy.
Counting
the “Disadvantaged”
The
policy of group preferences forces impossible choices on the rapidly growing
number of Americans from multiracial backgrounds. The university, in effect,
says to students of mixed race, choose between your mother and your father. If
you decide to identify yourself as a member of a preferred group, you increase
your chances of being admitted and of receiving substantial financial support.
If you identify yourself as Asian, even though your father is black, you are
less likely to get in. If you choose to check the box labeled “other” or refuse
to choose at all, we will simply treat you as if you were white. Which parent
are you prepared to reject? There is an additional problem: the whole process
invites fraud— difficult to discern by large impersonal institutions like the
University of California. One anecdote illustrates the form it takes. A
university officer observed a student filling out his application form and
checking the box labeled “Hispanic.” “Oh, you’re Hispanic,” he said, trying to
make friendly conversation. “No,” came the reply. “Actually I’m Iranian, but my
teacher told me to check Hispanic if I wanted to get into Berkeley.”
Although
no one knows how often such advice was given, such stories were frequently told
with a cynical chuckle when the University of California was still giving
preferences. They led to a general cynicism about the fairness of admissions
procedures and to a broader sense that the whole enterprise was a racket. I
once asked an admissions officer about the problem. “We are not in the business
of enforcing Nuremberg Laws,” he said indignantly. The university (rightly) was
unwilling to decide whether a student one-eighth black was indeed “black” and
who would determine, and by what means, just how large the fraction actually
was. But without clear criteria and a settled process for determining fraud, no
penalties for false representation could be imposed. And UC was certainly not
prepared to set such criteria and procedures. But without the danger of
identification or penalty, a “victimless crime” that carried substantial
benefits was increasingly attractive, at least to high school teachers and
counselors.
How
Much Preference Is Enough? The Case of Boalt Hall
Racial
preferences are ubiquitous in selective institutions of higher education,
except where they have been banned, as in California, Texas, and the state of
Washington. But no one ever defines precisely the point at which “diversity”
has been reached. How large a preference should be given to reach what goal?
Here again some evidence from the University of California may be enlightening,
this time from a professional school. Until the Regents acted to end
race-driven admissions, the policies adopted by UC schools were said to be
guided by the Supreme Court’s 1978 decision in University of
California v. Bakke, which outlawed quotas but permitted institutions
to consider race as “one factor in admissions.” What did this mean, exactly?
Some schools read the Court’s majority as having said, “other things being
equal,” race could be a basis for selection at the margin. Most, though, saw
the decision as a license to achieve diversity by giving heavy weight to race
and ethnicity.
Berkeley’s
Law School, Boalt Hall, was among those that interpreted Bakke permissively.
Unlike most other graduate departments and professional schools, the admissions
process used a formula that placed applicants into one of four “Ability Ranges,”
A through D, on the basis of undergraduate GPAs and LSAT scores. In 1996, only
855 students were admitted to Boalt, out of 4,684 who applied, but the rate of
acceptance for black and Hispanic students in every “Ability Range” below the
top one A was much higher than that for whites and Asians.
For
example, eighteen applicants from the preferred groups fell into the top two
ranges, and all but one of them were accepted. Almost all applicants from all
ethnic groups in the A range were admitted, but among those who fell in the B
range, 69 percent of Asians, 62 percent of whites, and 94 percent of blacks and
Hispanics were admitted. Looking at range C, only 19 percent of Asians and 17
percent of whites were admitted, while 77 percent of the blacks and Hispanics
got in. In the lowest range, the disparities were even greater.
When
we look at specific ethnic groups, the differences are even more striking. Of
applicants in Ability Range C, ten were students of Japanese origin, and ten
were black. All the blacks and none of the Japanese were accepted. In range D,
a significant number of blacks but no students of Chinese origin were admitted.
These
disparities were the consequence of highly race-conscious admissions processes,
and when Boalt Hall’s freedom to engage in race-based admissions was curtailed,
the drop in blacks admitted was dramatic. Just one black student would be
entering the first-year class in 1997, the media widely reported, and that
student had deferred admission after having been accepted previously, when
preferences were still permissible. The end of preferences, it was said
despairingly, meant the virtual end of African American students at the
University of California’s top law school.
The
figures for Boalt were reported before those for other professional and
graduate programs had been made available, and the press presented them as the
sign of things to come. In fact, Boalt Hall, together with other UC law and medical
schools, was distinctive. The proportion of blacks and Hispanics entering
Berkeley’s graduate programs in general was little changed by the change in
admissions policy—news that was basically ignored in the media.
Between
1996 and 1997—before and after preferences—the number of African Americans in
UC graduate schools increased by 2 percent, while the “other” and “declined to
state” categories increased by 25 percent, the Office of the President
reported. (Those figures excluded the professional schools.) One might have
imagined that the UC administration would be eager to spread the good news, but
there were no press conferences or statements by senior administrative officers
calling attention to these surprising figures. Instead, they gave the Boalt Hall
story maximum publicity. Boalt was different from most other graduate and
professional programs in one important respect: it was competing for the most
academically able black and Hispanic applicants with other leading law schools,
especially those at the top private research universities. Unfortunately,
however, it had never been very successful in that competition. Long before the
Regents’ vote and Proposition 209, Boalt had consistently lost all or almost all
its best-qualified non-Asian minority applicants to Harvard, Yale, Stanford, and
other law schools that were both more prestigious and could offer more
financial support and more attractive job prospects upon graduation. But when
no minority students enrolled in Boalt’s 1997 entering class, public statements
by administrators inside and outside the school blamed the results on the
change in admissions criteria.
The
end of race preferences at UC had dramatic effects on Boalt, in other words,
because the school had gone very far down the road of racial double standards
in an effort to compensate for a competitive disadvantage against more
prestigious and affluent schools. But in 1997,3 it could no longer take large
numbers of poorly qualified minority students over white and Asian students
with higher GPAs and LSATs. By contrast, most other graduate and professional
programs within the university system had not had to change their admissions
criteria and practice so drastically after preferences were abolished, and
their black and Hispanic enrollment was almost unaffected.
In
fact, the University of California has an advantage over most other universities
in being a system of eight universities whose central office keeps records of
their enrollments year by year and by the old ethnic-race categories. What
those records show is that after the passage of 209 the non-Asian minority
students who had applied but had not been admitted to Berkeley and other UC
campuses that had been using race and ethnicity as criteria for admission
tended to enroll in one of the other UC campuses, which were admitting all
applicants who were academically qualified for admission to the university. The
result of this process of “cascading” is that by 1999, only two years after the
first class was admitted color blind, the University of California as a whole
showed a decline of only 3 percent in the numbers of non-Asian minority
freshmen enrollees. Even that figure overestimates the decline because it does
not count the minority students who refused to give their race or ethnicity now
that it no longer affected their admission to the university. But 3 percent is
a far cry from the predictions of the effects of Proposition 209 on minority
enrollments in the University of California. By 2000, the number of non-Asian
minorities newly admitted to UC was already higher than in the last year that
preferences were still in effect. The numbers admitted who refused to give
their ethnicity had also risen.
Consensus
and Coercion
Senior
administrators in the academy are solidly behind racial preferences, and they
are the seemingly united voice of almost every university. But in fact there is
considerable division among members of the faculty. A 1995 Roper poll asked
voting members of the University of California Academic Senate which they favored:
granting preferences to women and certain racial and ethnic groups, or
promoting equal opportunity without regard to an individual’s race, sex, or
ethnicity. A wide plurality (48 percent) chose the latter policy; only 31
percent supported preferences.4 Another survey, of a national sample of college
teachers, came up with much the same result.5
These
findings are consistent with American public opinion in general, which has been
deeply divided on the issue for three decades. What explains this curious
combination of outward consensus and internal division in the academy? A
mixture of principle and pragmatism—sincere belief coupled with a keen sense of
who on or around campus can make trouble— explains the unanimity among
university administrators. The officials who administered UC’s large
affirmative action bureaucracies were appointed on the understanding that they
would support the preferential regime, and most of them probably did so
genuinely. But they also know that those who are opposed to race-conscious
admissions will seldom speak out and will never lead marches or sit-ins,
whereas those who profit from preferences are combatants. In part, the silence
on the part of opponents is a consequence of intimidation. Very few academics
wish to offend both the senior administrators who govern their careers and
budgets and the wellorganized affirmative action pressure groups that will
quickly stereotype faculty members as “racists” or, at very least, “right-wingers.”
A
distinguished federal judge who is familiar with academia has summarized the
scene well:
Groups
holding considerable power in the university loathe speech with the wrong
content about topics important to them, and . . . those who say the wrong
things will have little peer or institutional protection. . . . Many ideas may
not be expressed, many subjects may not be discussed, and any discussion on
matters of political salience has to avoid defending groups powerful in the
university.6
The
problem at the University of California went beyond a lack of institutional protection
for dissenting voices. Like other universities, UC over the years developed not
only a strong climate but also an organizational structure in support of
preferences from the president’s office down. Every campus had administrative
offices and academic senate committees to plan and enforce preferential
policies; every department had an “affirmative action” officer to monitor its
behavior. Needless to say, there was no equivalent organization of people and
energy inside the university devoted to criticizing the preference policies or
trying to reform them.
The
pattern of consensual coercion brands dissenting points of view as illegitimate
and deprives those who hold them of protection. Students and other faculty
members need not read or listen to their arguments. Already discredited,
opponents of racial preferences are then demonized. They are not merely
mistaken; they are evil—and fair game for late-night calls and hate mail. But
coercion does not need to reach the point of anonymous name-calling to be
effective. The administrative unanimity behind the policy can itself have a
chilling effect that is enough to stifle debate.
What
Proposition 209 Hath Wrought
The
Regents’ actions and Proposition 209 are slowly liberating UC campuses from the
atmosphere of coercion. Although the president and the chancellors and their
senior staffs may not have changed their views, it is now possible, indeed even
necessary, for people to talk about how to admit students in ways that might
preserve and enhance diversity without allowing race and ethnicity to drive
admissions decisions. California voters and the Regents have forced important
reforms. The university has had to abandon its categorical formulas and admit
students by inspecting their folders rather than simply their scores and race.
Some students have always been admitted on the basis of their individual
qualities and promise, but the process has now been extended more broadly.
In
implementing race-neutral policies, admissions officers need not be blind to
inequalities in American society and their impact on academic performance and
life prospects. California admissions officers can still give a break to
students who, though their scores are a bit low, seem highly motivated and come
from mediocre high schools. And they can pay special attention to the high
school senior who shows academic promise, although he or she has been
struggling with English as a second language.Weighing such disadvantages is
quite different from racial and ethnic preferences.
The
process requires schools to look at individual qualities; they cannot make
stereotypical assumptions about group characteristics. And, as a result, all
students admitted to the University of California today know they have earned a
place in their class under uniform standards. None needs to feel like a
second-class citizen, brought in to keep the “diversity” numbers up. Preference’s
burden of guilt and resentment has been lifted from UC students; one can feel
it in a classroom.
But
Proposition 209’s greatest contribution has been its indirect impact on the
lives of students before they apply to college. With racial preferences abolished,
California residents can no longer ignore the problem of too few blacks and
Hispanics academically prepared for seats in highly selective schools. Racial
and ethnic preferences in higher education simply masked the inadequacies of
California schools; elementary and secondary education must change, the
university finally understands. In fact, with the help of a recent grant of $40
million from the state legislature, each UC campus now has an opportunity to
create a program for improving the quality of K–12 schooling. With better
primary and secondary education, the number of black and Hispanic youth who are
prepared and motivated to continue their education in colleges and universities
should expand. And they will be going to colleges that have looked at their
talents and aspirations, not at their skin color or national origin, in
admitting them. By many criteria the abolition of preferences for admission to
the University of California has been a success.7 The nature and extent of that
success deserve to be studied and made more widely known in other parts of the
country. We no longer have to merely speculate about the effects of ending
racial preferences in higher education. Some results are in.
Notes
1. Portions of
this essay are drawn from the author’s “California After Racial
Preferences,” Public Interest, Spring 1999,
pp. 64–85. For varying perspectives on racial
preferences in
higher education, see Stephan Thernstrom and Abigail Thernstrom,
America in Black
and White: One Nation, Indivisible (New York: Simon & Schuster,
1997), chap.
14; Shelby Steele, A Dream Deferred (New York: HarperCollins, 1998);
William G.
Bowen and Derek Bok, The Shape of the River: Long-Term Consequences of
Considering Race
in College and University Admissions (Princeton, N.J.: Princeton
University
Press, 1998).
Although proponents of preferential policies have hailed the
Bowen-Bok work
as definitive, it has been subjected to serious methodological and
substantive
criticism. The fullest critiques are the author’s “California After Racial
Preferences”
and Stephan Thernstrom and Abigail Thernstrom, “Reflections on The
Shape of the River,” UCLA Law Review, June 1999.
2. Quoted by
Leo Rennert, Sacramento Bee Washington bureau chief, under the
headline “President
Embraces Minority Programs,” Sacramento Bee (Metro Final),
April 7, 1995,
p. A1. One might have imagined that the universitywould protest publicly
that there was
no such danger and, moreover, that that kind of invoking of the Yellow
Peril was
deplorable. Similar remarks from a Pat Buchanan, say, would likely have
produced a
flood of criticism. But no objection was forthcoming from university
officials
because the remarks were made by someone on their side of the preference
issue.
3. The ban on
preferences took effect in graduate and professional schools in 1997;
undergraduate
admissions were not affected until 1998.
4. The Roper
Center Survey of Faculty Opinion About Affirmative Action at the
University of
California, October 1996, sponsored by the California Association of
Scholars, at
http://www.calscholars.org/roper.html.
5. This was an
October 1996 survey of academics in colleges and universities all
over the
country. It found even higher proportions of respondents opposed to raceethnic
preferences in
admissions and appointments than was found in the UC survey.
See
http://www.nas.org/roper/exsum.htm.A recent survey of undergraduates by Zogby
International
found that 79 percent said lowering the entrance requirements for some
students,
regardless of the reason, was unfair to other applicants. And 77 percent said
it was not
right to give preferential treatment to minority students if it meant denying
admission to
other students. Ben Gose, “Most Students Oppose Racial Preferences in
Admissions,
Survey Finds,” Chronicle of Higher Education, May 5, 2000, p. A52.
6. Andrew J.
Kleinfeld, Circuit Judge on the United States Court of Appeals for
the Ninth
Circuit, in an essay, “Politicization: From the Law Schools to the Courts,”
Academic
Questions, Winter 1993–94, p. 17.
7. See Pamela
Burdman, “After Affirmative Action,” Crosstalk 8, no. 1
(winter
2000): 7–8.
==============================