Report: Racism
New Perspectives on Race and
Ethnicity
Part 1
The Demography of Racial and Ethnic Groups
Immigration and Group Relations
What Americans Think About Race and
Ethnicity
PART TWO — PRIVATE LIVES AND PUBLIC POLICIES
Residential Segregation Trends
African American Marriage Patterns
Discrimination, Economics, and Culture
Half Full or Half Empty? The Changing
Economic Status of African Americans, 1967–1996
Discrimination in Public Contracting
==============================
Hoover Institution
http://www-hoover.stanford.edu/publications/books/colorline.html
Beyond the Color Line: New
Perspectives on Race and Ethnicity in America
Edited by Abigail Thernstrom
and Stephan Thernstrom
Hoover Institution Press Publication No. 479
2002
==============================
Abstract
From color-blind to color-consciousness—a counterproductive approach to racial equality?
The American racial and ethnic landscape has been radically transformed over the past three decades. A generation ago, blacks had much less education, much poorer jobs and were more likely to live in solidly black neighborhoods than they are today. Yet the old notion of “two societies, one black, one white—separate and unequal” still persists thirty years after it first appeared in the misguided diagnosis of the Kerner Commission report.
America’s changing racial and ethnic scene is the central theme of Beyond the Color Line. In essays covering a range of areas including education, law, religion, immigration, family structure, crime, economics, politics, and more, this volume examines where we’ve been, where we are, and where we’re going. Along the way, the authors attempt to illuminate how we have moved from Dr. Martin Luther King’s dream of all Americans being judged solely by the “content of their character, not the color of their skin” to today’s vaguely Orwellian civil rights orthodoxy—that it is necessary to treat some persons differently in order to treat them “equally.”
The product of the Citizens’ Initiative on Race and Ethnicity—formed in 1998 as an alternative to the one-sided official “dialogue” on questions of color—many of these twenty-five brief essays offer either explicit or implicit public policy recommendations. A common theme unites them—new realities require new thinking, and old civil rights strategies will not solve today’s problems. Beyond the Color Line takes the first steps toward a new civil rights agenda.
Abigail Thernstrom, a senior fellow at the Manhattan Institute and a member of the Massachusetts State Board of Education since 1995, and Stephan Thernstrom, the Winthrop Professor of History at Harvard University and Manhattan Institute senior fellow, are coauthors of America in Black and White: One Nation Indivisible (Simon & Schuster, 1997) and write frequently for a variety of journals and newspapers, including The New Republic, the Wall Street Journal, and the UCLA Law Review.
Contributors: David J. Armor, Michael Barone, Douglas J. Besharov, Clint Bolick, David Brady, Linda Chavez, William A.V. Clark, Ward Connerly, John J. DiIulio Jr., Tamar Jacoby, Everett C. Ladd, George La Noue, William J. Lawrence, Nelson Lund, Christine H. Rossell, Sally Satel, Thomas Sowell, Shelby Steele, Abigail Thernstrom, Stephan Thernstrom, Martin Trow, Reed Ueda, Eugene Volokh, Finis Welch, James Q. Wilson, C. Robert Zelnick
==============================
Table Of Contents
Foreword ix
John Raisian and Larry Mone
Contributors xi
Introduction 1
PART ONE THE BIG PICTURE
The Demography of Racial and Ethnic Groups 13
Stephan Thernstrom
copyright © 2001 by Stephan Thernstrom
Immigration and Group Relations 37
Reed Ueda
What Americans Think About Race and Ethnicity 53
Everett C. Ladd
Wrestling with Stigma 69
Shelby Steele
PART TWO PRIVATE LIVES AND PUBLIC POLICIES
Residential Segregation Trends 83
William A. V. Clark
African American Marriage Patterns 95
Douglas J. Besharov and Andrew West
Crime 115
James Q. Wilson
Health and Medical Care 127
Sally Satel
Supporting Black Churches 153
John J. DiIulio Jr.
PART THREE ECONOMICS
Discrimination, Economics, and Culture 167
Thomas Sowell
copyright © 2001 by Thomas Sowell
Half Full or Half Empty? The Changing Economic Status of African Americans, 1967–1996 181
Finis Welch
Discrimination in Public Contracting 201
George R. La Noue
PART FOUR EDUCATION
Desegregation and Resegregation in the Public Schools 219
David J. Armor and Christine H. Rossell
The Racial Gap in Academic Achievement 259
Abigail Thernstrom
copyright © 2001 by Abigail Thernstrom
Schools That Work for Minority Students 277
Clint Bolick
Preferential Admissions in Higher Education 293
Martin Trow
PART FIVE LAW
Racial and Ethnic Classifications in American Law 309
Eugene Volokh
copyright © 2001 by Eugene Volokh
Illusions of Antidiscrimination Law 319
Nelson Lund
PART SIX POLITICS
Race, Ethnicity, and Politics in American History 343
Michael Barone
The Politics of Racial Preferences 359
David Brady
From Protest to Politics: Still an Issue for Black Leadership 369
Tamar Jacoby
PART SEVEN ONE NATION, INDIVISIBLE
The New Politics of Hispanic Assimilation 383
Linda Chavez
In Defense of Indian Rights 391
William J. Lawrence
The Battle for Color-Blind Public Policy 405
C. Robert Zelnick
One Nation, Indivisible 415
Ward Connerly
Index 425
==============================
Foreword
Projects
with multiple authors scattered across the country are often arduous and
unfulfilling. To the contrary, this project was neither. There is a reason we
engaged in this effort; we wanted to put together, into one volume, the best
work being conducted by the highest-quality scholars addressing race and
ethnicity issues facing the citizens of the United States. The opportunity for
our two institutions to collaborate with experts in the area of race and ethnic
relations to produce this book was one we could not pass on; the results proved
to be rewarding.
The
exemplary work of the twenty-five scholars and writers that constitute Beyond the Color
Line has made this volume comprehensive and influential.We
thank each of them for their time, patience, and outstanding scholarship. In
addition, we are especially grateful to the editors, Abigail and Stephan
Thernstrom, for their dedication in undertaking and completing this project.
Based
on accumulated knowledge, intellectual rigor, reasoned argument, and sound
principles, the Hoover Institution and the Manhattan Institute are dedicated to
producing and disseminating sound research with public policy implications.
John
Raisian, Director, Hoover Institution
Lawrence
J. Mone, President, Manhattan Institute
==============================
Contributors
David
J. Armor is a research professor at the Institute of Public
Policy, George Mason University. Formerly he was Senior Social Scientist at the
Rand Corporation and Associate Professor of Sociology at Harvard University. He
is the author of Forced Justice: School Desegregation and the Law, and
he has testified as an expert in more than thirty school desegregation cases.
Michael
Barone is a columnist at U.S. News&World Report. The
author of Our Country: The Shaping of America from Roosevelt to Reagan (Free Press,
1992), Mr. Barone regularly appears as an analyst and commentator on various
television and radio news shows. He is a graduate of Harvard College and Yale
Law School.
Douglas
J. Besharov is a resident scholar at the American Enterprise Institute
and director of the AEI’s Social and Individual Responsibility Project. He is
also a professor at the University of Maryland School of Public Affairs. He is
the author of the forthcoming America’s Families: Trends,
Explanations and Choices, and of many other books and articles that have
appeared in major magazines and newspapers across the country. Andrew West was
a research assistant at AEI.
Clint
Bolick serves as vice president and director of litigation
at the Institute for Justice, which he co-founded in 1991 to engage in
constitutional litigation protecting individual liberty and challenging the
regulatory welfare state. He leads the nationwide litigation effort to defend
school choice programs and to challenge regulatory barriers to
entrepreneurship. The New York Times described Mr. Bolick as “the maestro of the
political right on issues of race . . . increasingly setting the tone and
defining the terms of the national debate.”
David
Brady is a senior fellow at the Hoover Institution.He is
also Bowen H. and Janice Arthur McCoy Professor of Political Science and
Leadership Values in the Stanford Graduate School of Business and associate
dean and professor of political science in the School of the Humanities and
Sciences at Stanford University. His recent publications include Revolving
Gridlock: Politics and Policy from Carter to Clinton (Westview
Press, 1998).
Linda
Chavez is president of the Center for Equal Opportunity, a
Washington, D.C.–based think tank devoted to the promotion of color-blind equal
opportunity and racial harmony. She has held a number of political positions,
among them White House Director of Public Liaison and director of the U.S.
Commission on Civil Rights. She is the author of Out of the Barrio:
Toward a New Politics of Hispanic Assimilation (Basic
Books, 1992) and is currently working on her second book.
William
A. V. Clark is a professor of geography at the University of California,
Los Angeles. His research is focused on the internal changes in U.S. cities,
especially in the changes that occur in response to residential mobility and
migration. He is author of The California Cauldron: Immigration and the
Fortunes of Local Communities (Guilford Press, 1998) and Households and
Housing: Choice and Outcomes in the Housing Market (Rutgers,
1996).
Ward
Connerly is chairman of the American Civil Rights Institute,
a national not-for-profit organization aimed at educating the public about the
problems created by racial and gender preferences. A member of the University
of California Board of Regents, Mr. Connerly spearheaded the successful fight
to end the University’s use of race as a factor in admissions. He has since led
campaigns against racial preferences in Florida and Texas. john
j. diiulio jr. is a senior fellow at the Manhattan Institute. He directs
the Jeremiah Project, an initiative of the Manhattan Institute’s Center for
Civic Innovation. He is also Frederick Fox Leadership Professor at the
University of Pennsylvania and senior counsel to Public/Private Ventures.
Tamar
Jacoby is a senior fellow at the Manhattan Institute, who
writes extensively on race issues and other subjects. She is the author of Someone Else’s
House: America’s Unfinished Struggle for Integration (Free
Press, 1998), a book about race relations in three American cities—New York,
Atlanta, and Detroit. Ms. Jacoby’s articles and book reviews have been
published in a variety of periodicals, including the New York Times, the Wall Street Journal,
Los Angeles Times, Washington Post, the New Republic,
New York Review of Books, Commentary, Dissent, City Journal, and Times Literary Supplement.
Everett
C. Ladd, who died in 1999, was director of the Institute
for Social Inquiry at the University of Connecticut and executive director and
president of the Roper Center for Public Opinion Research. He was also an adjunct
scholar of the American Enterprise Institute, as well as a columnist for the Christian
Science Monitor from 1987 through 1995. Dr. Ladd was the author of
seventeen books, most recently The Ladd Report on Civic America (Free
Press, 1999).
George
R. La Noue is a professor of political science in the Policy
Sciences Graduate Program at the Univeristy of Maryland Baltimore County. He is
also director of the Project on Civil Rights and Public Contracts at the University.
Dr. La Noue’s Ph.D. was granted by Yale University.
William
J. Lawrence is publisher of the Native American
Press/Ojibwe News, an independent weekly newspaper that serves
Minnesota’s Native American community. In 1997, Press/ON was
nominated for a Pulitzer Prize for editorial writing and service to the
community. The April 1999 issue of Minnesota Monthly featured
an article about Mr. Lawrence entitled “The Man Tribal Leaders Love to Hate.”
Dr. Lawrence holds a B.A. from Bemidji State University and a J.D. from the
University of North Dakota School of Law. He was a commissioned officer in the
U.S. Marine Corps serving in Vietnam, and he is an enrolled member of the Red
Lake Band of Chippewa Indians.
Nelson
Lund is a professor at the School of Law, George Mason
University. Before joining the faculty in 1992, he was associate counsel to
President George Bush. Mr. Lund has served in the Office of Legal Counsel and
the Office of the Solicitor General of the U.S. Department of Justice and as a law
clerk to Justice Sandra Day O’Connor and to U.S Court of Appeals Judge Patrick
E. Higginbotham.
Christine
H. Rossell is a professor of political science at Boston
University. Ms. Rossell is the author of four books and many scholarly articles
in the areas of school desegregation and bilingual education policy. She has been
an expert witness in more than twenty school desegregation and bilingual
education cases and has helped design and defend more than a half dozen
voluntary “incentive” desegregation plans.
Sally
Satel is a practicing psychiatrist and lecturer at Yale
University School of Medicine. She is staff psychiatrist at the Oasis Clinic in
Washington, D.C. In addition to publishing widely in medical journals and the popular
press, Dr. Satel is the author of PCMD: How Political Correctness Is
Corrupting Medicine (Basic Books, 2000).
Thomas
Sowell is the Rose and Milton Friedman Senior Fellow on
Public Policy at the Hoover Institution. He is the author of a nationally
syndicated column that appears in over 150 newspapers. Dr. Sowell has written
widely on economics, the history of ideas, and social policy. His most recent
book is The Quest for Cosmic Justice (Free Press, 1999).
Shelby
Steele is a research fellow at the Hoover Institution. Mr.
Steele’s most recent book isA Dream Deferred: The Second Betrayal of Black
Freedom in America (Harper Collins, 1998). He is also author of The Content of
Our Character: A New Vision of Race in America (HarperCollins,
1990), which won the National Book Critics Circle Award in 1990.
Abigail
Thernstrom is a senior fellow at the Manhattan Institute and coauthor
of America in Black and White: One Nation, Indivisible (Simon
& Schuster, 1997). Her previous book, Whose Votes Count: Affirmative Action
and Minority Voting Rights (Harvard University Press, 1987), won four academic
prizes. She has been a member of the Massachusetts State Board of Education
since 1995 and writes frequently for a variety of journals and newspapers,
including New Republic, Commentary, theWall Street Journal, the New York Times, and Public Interest.
Stephan
Thernstrom is a senior fellow at the Manhattan Institute and Winthrop
Professor of History at Harvard University, where he teaches American social
history. His most recent book, coauthored with Abigail Thernstrom, is America in Black
and White: One Nation Indivisible (Simon & Schuster, 1997). He is
also the editor of the Harvard Encyclopedia of American Ethnic Groups (Harvard
University Press, 1980).
Martin
Trow is emeritus professor at the Goldman School of
Public Policy, University of California, Berkeley.He holds a degree as a
mechanical engineer from Stevens Institute of Technology and a doctorate in
sociology from Columbia University. He has written widely on the sociology of politics
and higher education. He is a foreign member of the Royal Swedish Academy of
Sciences and was recently awarded the Berkeley Citation for distinguised
service to the University of California.
Reed
Ueda is a professor of history at Tufts University and
on the steering group of the Committee on Migration at the Center for
International Studies of MIT.He is author of Postwar Immigrant America:ASocial
History (Bedford Books of St. Martin’s Press, 1994), among
other books and articles. Dr. Ueda was also research editor for Harvard
Encyclopedia of American Ethnic Groups (Harvard University Press, 1980).
Eugene
Volokh is a professor at the University of California, Los
Angeles, School of Law. Before he joined the faculty at UCLA, he clerked for
Justice Sandra Day O’Connor and for U.S. Court of Appeals Judge Alex Kozinski. Mr.
Volokh teaches free speech law, copyright law, the law of government and
religion, and a seminar on firearms regulation law and policy.
Finis
Welch is a professor of economics and George T. and
Gladys H. Abell Professor of Liberal Arts at Texas A&M University. His
specialty is in labor economics, on which he has written many articles and
papers. Dr. Welch did his doctoral research at the University of Chicago.
James
Q. Wilson taught political science at Harvard University from
1961 to 1987, where he was the Shattuck Professor of Government. From 1985 until
1997 he was the James Collins Professor of Management and Public Policy at
UCLA. He is the author or coauthor of fourteen books, the most recent of which
is Moral Judgment (Basic Books, 1997). In addition, he has edited or
contributed to books on urban problems, government regulation of business, and
the prevention of delinquency among children.
C.
Robert Zelnick, a professor of journalism at Boston University,
spent twenty-one years with ABC News, including reporting assignments in Moscow
and Israel, at the Pentagon, and covering Congress and politics. A former
Hoover Institution visiting fellow, he is the author of Gore: A Political
Life (National Book Network, 1999) and Backfire:A Reporter’s
Look at Affirmative Action (Regnery, 1996).
==============================
Introduction
The
American racial and ethnic landscape has been fundamentally transformed
in recent decades. But public understanding has lagged behind new realities. Our
gaze is often fixed on the rearview mirror, and even that view is distorted. A
color line seems to bifurcate the nation. Blacks appear as permanent victims;
white racism looks ubiquitous. Asian and Hispanic Americans, who together now
outnumber blacks, are but a shadowy presence hovering in the background. Their
experience as “people of color” is portrayed as little different from that of
African Americans.
White
racism, of course, was ubiquitous not that long ago. And it has not entirely
disappeared. But the past is not the present. We have been moving forward. Much
of the territory that now surrounds us is unfamiliar, and yet old notions
persist. The ethnic and racial categories themselves— white, black, Asian, and
Hispanic—never made much sense and are, in any case, dissolving. Half of
native-born Asian Americans are now marrying whites. A third of all Hispanics
marry non-Hispanic whites. The black intermarriage rate is slowly creeping up.
A generation ago blacks had much less education and much poorer jobs and were
much more likely to live in solidly black neighborhoods than they are today.
Differences persist, but they now have multiple and complex causes.
America’s
changing racial and ethnic scene is the central theme of this volume. In essays
on topics ranging from religion and immigration to family structure and crime,
the authors seek to illuminate where we have been, where we are, and where we
are heading. They share a common vision: the color line transcended. One
nation, indivisible is still America’s unrealized dream.
The
Color-Blind Vision
Pessimism
is strikingly pervasive in civil rights circles today. In the heyday of the
civil rights movement, by contrast, those who fought for racial equality were
optimists, and that optimism seemed vindicated by events. With the passage of
the Civil Rights Act of 1964 and the Voting Rights Act a year later, the civil
rights movement achieved its main political objectives. As Bayard Rustin, a
close adviser to the Reverend Martin Luther King Jr., noted at the time, the “legal
foundations of racism in America” had been “destroyed” with dizzying speed. The
“elaborate legal structure of segregation and discrimination” had “virtually
collapsed.”1 Most Americans— not just those directly involved in
the movement—celebrated.
Indeed,
the 1964 election returns were a smashing victory for civil rights proponents.
Barry Goldwater, the Republican candidate for president who opposed the Civil
Rights Act, was resoundingly rejected. Democrats gained an additional thirty-seven
seats in the House and one more in the Senate, giving them majorities of more
than two-thirds in both chambers. It was a partisan imbalance the like of which
has not been seen since.
It is
no coincidence that in 1965 the United States also abandoned the discriminatory
national origins quotas that had governed its immigration law since the 1920s.
The notion that only citizens from countries like Great Britain or Germany
would make good Americans lost popular support in the increasingly tolerant and
cosmopolitan America of the postwar period. Congress amended the Immigration
and Nationality Act to open the doors to prospective immigrants from all
countries on an equal basis.
Immigration
reform and the two landmark civil rights bills—the most important since
Reconstruction—all rested on a central moral principle: it is wrong to judge
Americans on the basis of race, color, creed, sex, or national origin. People
are individuals with equal rights, not fungible members of groups. The
Constitution is “color-blind,” John Marshall Harlan had declared in his famous
dissent in Plessy v. Ferguson, the 1896 Supreme Court decision that upheld “separate
but equal” railroad accommodations.2 It was the message of the civil
rights movement from before the CivilWar to the 1960s.3 Dr.
King dreamed of the day when Americans would be judged solely by the “content
of their character,” not by “the color of their skin.”4 President
John F. Kennedy invoked this core principle in supporting the passage of a
sweeping civil rights bill that would demonstrate the nation’s commitment to “the
proposition that race has no place in American life or law.”5
The
Reversion to Color-Consciousness
The
clarity of this moral vision was lost, however, in the turbulent and chaotic
years of the late 1960s. In 1965 President Lyndon B. Johnson took the first
step in a radically different direction. “You do not take a person who, for
years, has been hobbled by chains and liberate him, bring him up to the
starting line in a race and then say, ‘you are free to compete with all the
others,’” Johnson argued. Opening “the gates of opportunity” would not suffice;
racial “equality as a fact and as a result” had to be the nation’s goal.6 Although
Johnson did not use the term “affirmative action,” his image of blacks as
crippled by racism laid the foundation for a generation of racial
preferences—race-conscious measures designed to ensure “equality as a fact.”
Handicapped citizens were entitled to compete under different rules.
The
rationale for the racial preferences that came to be embedded in policies
involving employment, education, and public contracting was most famously
articulated by Supreme Court Justice Harry Blackmun in 1978. “In order to get
beyond racism,” he said, “we must first take account of race. There is no other
way. And in order to treat some persons equally, we must treat them
differently. We cannot—we dare not—let the Equal Protection clause perpetuate
racial supremacy.”7 It was not clear why policies that were explicitly
race conscious were the only alternative to racial supremacy; in the
extraordinarily long debates on the 1964 Civil Rights Act, no one ever made
Justice Blackmun’s argument. The framers of that statute had envisioned
aggressive enforcement of its race-neutral antidiscrimination provisions. But
by 1978 the vaguely Orwellian notion that it was necessary to treat some
persons “differently” in order to treat them “equally” became civil rights
orthodoxy.
The
Misguided Diagnosis of the Kerner Report
How
did race-conscious policies become so accepted by 1978? The answer, in part, is
the racial crisis that erupted in the nation’s cities within three months of
Johnson’s June 1965 speech. In August, the Watts neighborhood of Los Angeles
exploded in flames, kicking off four “long, hot summers” of looting, burning,
and fighting in predominantly black areas of cities across the land.
The
riots came to an end in 1968, as suddenly and mysteriously as they appeared,
and what caused them is still open to debate. But the explanation offered by
President Johnson’s Kerner Commission was a sweeping indictment of American
society. Indeed, the Commission’s central finding became, and remains,
conventional wisdom in the civil rights community, academia, and the national
media. The 1968 report portrayed America in stark—literally
black-and-white—terms. The American drama was a play with only two characters:
bigoted whites and victimized blacks. Whites were mostly living in suburban
comfort, while blacks were trapped by white prejudice in decaying, dead-end
inner-city neighborhoods. Curiously, the report barely mentioned the great
civil rights statutes that had already irrevocably changed the status of blacks
in both South and North. It portrayed the nation as moving backward, “toward
two societies, one black, one white—separate and unequal.” The riots were
natural and inevitable protests against “the racial attitudes and behavior of
white Americans toward black Americans.” An “explosive mixture” had accumulated
in the cities “since the end ofWorldWar II,” and it was not surprising that the
powder keg had at last detonated. America would be marked by “deepening racial
division” and “ultimately, the destruction of basic democratic values” until “white
racism” disappeared.8
As an
analysis of what had triggered the ghetto riots of the mid-1960s, the Kerner
report was useless. Increasing inequality could not have been the explanation;
by every conceivable measure the status of African Americans had improved.
Their average incomes were rising more rapidly than those of whites—no
surprise, given how far behind they had been. In years of schooling,
occupational status, quality of housing, and life expectancy, the racial gap
was narrowing significantly. The political power of blacks was expanding, and
they had an array of new legal rights.9
Of
course, African Americans were still more likely than whites to live in poverty
and suffered from higher unemployment rates, but those conditions were just as
pervasive in the cities that had not experienced riots. Moreover, the riots
ended in 1968. Why? Inner-city neighborhoods had not been transformed, white
racism had not suddenly disappeared, and in the few months that elapsed between
the Kerner report and the last racial disturbance, the federal government had
not begun the program of massive new spending that the Commission had
recommended.
Looking
Backward: Liberal Orthodoxy Today
In
spite of these and other glaring flaws, the portrait drawn by the Kerner
Commission has had a remarkable life. Its findings are frequently cited as
equally valid today. For instance, in December 1999 the attorney general of
Massachusetts looked at student scores on statewide tests and recalled the
Kerner Commission’s “pessimistic conclusion that our nation was ‘moving towards
two societies, one black, one white, separate and unequal.’”10 Although
the Kerner findings were barely mentioned explicitly, the report of the Race
Advisory Board appointed by President Clinton and chaired by Dr. John Hope
Franklin was a warmed-over version of the Kerner report with updated rhetoric.
Its findings were a prime example of what Orlando Patterson has called the “forever
racism” mindset. 11
New
demographics compelled the Franklin Commission to acknowledge the large and
rapidly growing presence of Asians and Hispanics, though it did so largely by
conflating the experience of all “people of color.” The United States, it said,
is still governed by an oppressive “system of racial hierarchy” in which whites
hold all the power and members of “every minority group” face “significant
barriers to opportunity.” “Racial and ethnic oppression . . . persist.” “Racial
stereotypes” and “racist concepts” abound, as ugly and primitive as ever; no
area of life is free of “subtle biases.”12
A
similarly gloomy and strident note was struck in a recent address by Julian
Bond, the chairman of theNAACP. Though he conceded that African Americans had
made some advances since the 1960s, he insisted that the Kerner Commission’s “indictment
of white America” was still sound. “Everywhere we look we see clear racial
fault lines that divide America now as much as in the past.” Within a few short
years of the Kerner report, a “backlash in the discourse over race” had set in,
Bond claimed. Its findings were rejected by “a curious mix of whites and a few
blacks, academics, journalists and policy makers,” engaged in “blame-shifting”
and determined to pervert reality. These “new racists,” he said, see continuing
blackwhite disparities as the consequence of “family breakdown,” a “lack of middle-class
values,” a paucity of “education and skills,” and the “absence of role models.”
But “these are symptoms. Racism is the cause; its elimination is the cure.”13
Looking
Forward
The
two dozen contributors to this volume disagree about many things; they were not
chosen because they follow a particular party line on racial and ethnic issues.
But they all reject the civil rights orthodoxy expressed by Julian Bond and the
Franklin Commission. The Kerner report was a highly imperfect guide to the
American picture when it was first released, and by now it is about as reliable
as a telephone directory issued thirty years ago. The ritualistic evocation of
a color line perpetuated by old and new racists is futile and
counterproductive.The drive for racial equality is unfinished business, yet the
civil rights community has almost nothing fresh to offer.
What
follows is a guide to the new territory shaped by seismic shifts in American
society over the past three decades. How are various groups faring
economically, both in absolute terms and in relation to each other? What are
the social conditions in the new communities of color? What progress have we
made in closing the gap in educational outcomes? How is the law changing? How
much has the sharp increase in marriages across racial lines blurred the
boundaries between groups and diminished the salience of racial
identifications? How are shifting attitudes—white, black, Asian, Hispanic,
American Indian—reflected in the nation’s politics? Are voters crossing racial
lines in casting ballots for candidates?
The
twenty-five brief essays offered here address these questions and more. The
authors are scholars, journalists, and activists who specialize in the areas
they write about. Grounded in research and close observation, almost every
chapter shatters an old stereotype.
Many
of the essays offer either explicit or implicit public policy recommendations. A
common theme unites them: new realities require new thinking—a new civil rights
agenda. It is undeniable that serious racerelated problems persist—most
obviously for black Americans. But the causes of those problems entail
complexities of which the Kerner Commission never dreamed. White racism does
not work as the simple explanation for the relatively poor academic performance
of most black students in contexts ranging from affuent suburbia to black-run
school districts. Too many black children live in poverty, but almost all are
in single-parent households; how can we encourage young women to postpone
pregnancy until they are married or well positioned to support a family? The
problems of poverty, inadequate education, high unemployment, among others,
appear unchanged, but the facade of continuity is deceptive, and old civil rights
strategies will not solve today’s problems.
This
collection is the work of the Citizens’ Initiative on Race and Ethnicity
(CIRE), formed in April 1998 as an alternative to what many Americans saw as
President Clinton’s one-sided “dialogue” on questions of color. The Hoover
Institution at Stanford University and the Manhattan Institute for Policy
Research generously supported the group’s work and the research and writing
that went into the essays. Lindsay Young, director of communications at the
Manhattan Institute, served as the project coordinator, and Richard Sousa of
the Hoover Institution guided the publication process. All thirteen CIRE
members contributed to the conception and planning of the volume.
Citizens’
Initiative On Race And Ethnicity
Clint
Bolick, Institute for Justice
Elaine L. Chao, Heritage Foundation
Linda Chavez, Center for Equal Opportunity
Ward Connerly, American Civil Rights Institute
Tamar Jacoby, Manhattan Institute
Barbara J. Ledeen, Independent Women’s Forum
Gerald A. Reynolds, Center for New Black Leadership
T. J. Rodgers, Cypress Semiconductor
Shelby Steele, Hoover Institution
Abigail Thernstrom, Manhattan Institute
Stephan Thernstrom, Manhattan Institute
Robert L. Woodson Sr., National Center for Neighborhood Enterprise
C. Robert Zelnick, Hoover Institution
Notes
1. Bayard
Rustin, “From Protest to Politics: The Future of the Civil Rights Movement,”
Commentary, February
1965, reprinted in Rustin, Down the Line: The Collected
Writings of
Bayard Rustin (Chicago: Quadrangle Books, 1971), p. 111.
2. 163 U.S. 537
(1896).
3. See Andrew
Kull, The Color-Blind Constitution (Cambridge, Mass.: Harvard
University
Press, 1992).
4. Martin
Luther King Jr., “I Have a Dream,” speech, 1963 March onWashington.
Reprinted in
James MelvinWashington, ed.,ATestament of Hope: The EssentialWritings
of Martin Luther
King, Jr. (San Francisco: HarperSanFrancisco, 1986), p. 219.
5. Radio and
Television Report to the American People on Civil Rights,” June 11,
1963, in Public Papers of
the Presidents of the United States: John F. Kennedy, Containing
the Public
Messages, Speeches, and Statements of the President, January 1 to November
22, 1963 (Washington,
D.C.: U.S. Government Printing Office, 1964), pp. 468–71.
6. Lyndon B.
Johnson, “To Fulfill These Rights,” address at Howard University,
June 4, 1965,
reprinted in Lee Rainwater and William L. Yancey, eds., The Moynihan
Report and the
Politics of Controversy (Cambridge, Mass.: MIT Press, 1967), p. 126.
7. Regents of the
Univ. of Calif. v. Bakke, 438 U.S. 265, 407 (1978).
8. National
Advisory Commission on Civil Disorders [Kerner Commission] Report
(New York:
Bantam, 1968), pp. 1, 2, 10.
9. The data on
black progress in this period are assembled in Stephan Thernstrom
and Abigail
Thernstrom, America in Black and White: One Nation, Indivisible (New
York: Simon
& Schuster, 1997), chaps. 3–6.
10. Thomas F.
Reilly, “Separate and Unequal Education,” Boston Globe, op-ed,
December 11,
1999, p. A19. For other claims that the Kerner Commission’s findings
were still
correct, see Fred R. Harris and RogerW. Wilkins, eds., Quiet Riots:
Race and
Poverty in the
United States: Twenty Years After the Kerner Report (New York:
Pantheon,
1988); Douglas
S. Massey and Nancy Denton, American Apartheid: Segregation and the
Making of the
Underclass (Cambridge, Mass.: Harvard University Press, 1993),
p. 211;
and Charles
Bullard, J. Eugene Grigsby III, and Charles Lee, eds., Residential
Apartheid:
The American
Legacy (Los Angeles: UCLA Center for Afro-American
Studies, 1994),
pp. 1–2.
11. The
Patterson phrase is cited in Jim Sleeper, “Al Gore, Racial Moralist,” New
Republic, March 2,
1998, p. 21.
12. President’s
Initiative on Race Advisory Board, One America in the 21st Century:
Forging A New
Future (Washington, D.C.: U.S. Government Printing Office,
1998),
pp. 36, 43–44.
13. Julian
Bond, “Hostility to Civil Rights, ‘Color Line’ Problems to Continue,”
Charlestown
Gazette, April 1, 1999, p. 5A.
==============================
PART ONE — THE BIG PICTURE
The Demography of Racial and Ethnic Groups
STEPHAN
THERNSTROM
The
United States has been a racially and ethnically diverse society
from its beginnings. But the conventional wisdom these days is that something
radically new is happening now—that demographic changes are fundamentally
transforming our society in unprecedented ways. Peering into a crystal ball,
many observers have claimed that the groups we currently designate as
minorities are destined to become the new majority. By the middle of the
twenty-first century, they predict, and perhaps even sooner, whites will have
been reduced to minority status and “people of color” will have become the
majority. This, it is claimed, will have momentous implications for the nation’s
political, social, and cultural life.
Such
is the argument, for example, of Peter Brimelow’s Alien Nation, a 1995
volume that contended that current population shifts were “so huge and so
systematically different from anything that had gone before as to transform—and
ultimately, perhaps, even to destroy—the . . . American nation.”1
Table
1 Public Beliefs About the Racial Composition of the U.S. Population, 1995
What percent of
the population is . . .?
minority
|
Responses by |
Black |
Hispanic |
Asian |
Total |
|
Non-Hispanic
whites |
24 |
15 |
11 |
50 |
|
Blacks |
26 |
16 |
12 |
54 |
|
Hispanics |
23 |
21 |
11 |
55 |
|
Asians |
21 |
15 |
8 |
44 |
|
Actual
1995 figures |
13 |
10 |
4 |
27 |
source:
WashingtonPost–Kaiser
Family Foundation–Harvard University survey, as given in Richard
Morin, “A
Distorted Image of Minorities,” Washington Post, November 8,
1995, p. A1. Survey results
are mean
figures. The actual 1995 figures are Current Population Survey estimates
reported in U.S.
Bureau of the
Census, Statistical Abstract of the United States: 1997 (Washington,
D.C.: U.S. Government
Printing
Office, 1997), table 12.
Brimelow
is a conservative, but many observers on the multicultural left are equally
convinced that a profound demographic transformation is under way. They are
cheered rather than dismayed by the prospect, however. They welcome the arrival
of a minority majority and see it as evidence of the need for immediate
action—for more multicultural education in the schools, continued affirmative
action and diversity training programs in higher education and the workplace,
and an expanded welfare state.
The
demographic projections upon which both sides of this debate depend are too
flawed to be taken seriously, as I shall argue later. But the general public
seems to have got the message—so it would appear, at least, from the results of
a 1995 poll that asked Americans to estimate what proportion of the population
belonged to various racial or ethnic groups (see Table 1). This survey revealed
that whites (that is, non-Hispanic whites, a distinction to be discussed at a
later point) thought that the black population was almost twice as large as it
was in fact—24 percent in their minds, just 13 percent in reality—and that
there were 50 percent more Hispanics and almost three times as many Asians in
the country as the Current Population Survey figures revealed there to be.
These three minority groups together, whites thought, made up fully half of the
total population, when they actually were little more than one quarter. The “minority
majority,” in the eyes of whites, was not a possibility in the remote future;
whites were already on the brink of losing their traditional majority status.2
It is
tempting to interpret this misconception as evidence of widespread white
paranoia. But the delusion was not confined to whites. Indeed, blacks and
Hispanics were even more prone than whites to exaggerate their numbers. They
also greatly exaggerated the size of other minority groups: minorities together,
they believed, were already a distinct majority of the population, constituting
54 or 55 percent of the total. Asians were a little better informed than other
groups, but they too greatly overestimated the size not only of their own group
but also of other minorities. Whatever their backgrounds, most Americans tended
to have similar misconceptions about the racial-ethnic composition of the
nation’s population.3
It has
long been claimed that nonwhite people are socially invisible in American
society and that the minority presence deserves to be given far more attention
than it receives on television, in the press, in classrooms and textbooks.
President Clinton’s Race Initiative was based on the premise that most white
Americans do not pay sufficient attention to their fellow countrymen with skins
of a different hue. These polling numbers suggest that the opposite may be
closer to the truth: Americans have become so attentive to racial divisions and
so obsessed with racial matters that they have developed a badly distorted
picture of the shape of their society.
The
Arbitrary and Unscientific Character of the Official Racial-Ethnic Categories
in Current Use
The
survey referred to above employed four crude categories: white, black,
Hispanic, and Asian. Why are these the relevant categories for subdividing the
population into cultural groups? Why are these few groups singled out for
attention, while a great many others with some claim to a distinct identity are
not? What about Italian Americans, for example, or Jews? Are divisions among “races”
deeper, more fundamental, and more enduring than divisions among “ethnic groups”?
The
idea that “race” is a crucial and immutable division of mankind is a product of
the primitive social science of the nineteenth century. According to theorists
of the day, all the peoples of the world were divided into four distinct races:
white or “Caucasian,” black or “Negroid,” yellow or “Oriental,” and red or
Indian. White, black, yellow, and red people were profoundly different from
each other, as different as robins from sparrows, trout from salmon, rabbits
from squirrels.People who belonged to different races were not only distinct
physical types; they differed in innate intellectual potential and in cultural
development. If they were to mate across racial lines, their offspring would be
biological monstrosities.
Since
these race theorists were white, it is hardly surprising that they fervently
believed that Caucasians were the superior race. Orientals were next in line,
with blacks and American Indians at the bottom of the heap. Given this premise,
it was only natural that representatives of the “most advanced” race believed
that they were entitled to rule over the “lesser breeds.”
Such
ideas have long been discredited and are now held only by those on the lunatic
fringe. Scientists today agree that the genetic differences that distinguish
members of supposedly different “races” are small, and that the races have
become so intermixed that few people can claim to be of racially “pure”
origins. The range of biological variation within any one race is far greater
than the average differences among races.
And
yet the government of the United States, remarkably, still utilizes these
antiquated and pernicious categories in compiling statistical information about
the American people. The entry on the black population in the index to the 1997
edition of the Statistical Abstract of the United States gives
230 citations to tables that distinguish African Americans from other Americans.
Another 140 citations direct the reader to data on “Hispanics,” a newly
invented quasi-racial category whose origins will be traced below. Asians and
Pacific Islanders get 42 references, and American Indians and Alaskan natives
47. If you want to know how many African Americans regularly use the Internet,
how many Asians were treated in hospital emergency rooms in the preceding year,
how many Hispanics usually eat breakfast, or how many American Indians were
arrested for burglary, the answers are all there. The federal government
inundates us with data that convey the unmistakable message that Americans of
different “races” differ from each other in many important ways.
It is
very striking that the American public is not bombarded with similar official
statistics on the socioeconomic characteristics of Catholics, Protestants,
Jews, and Muslims, and the many denominational subdivisions within those broad
categories. Why not? Religious groups in the United States differ, often quite
dramatically, in levels of education, income and wealth, SAT scores,
unemployment rates, and most other socioeconomic measures. Why shouldn’t the
public be able to find out if Jews are much wealthier than Presbyterians, on
the average, or if Mormons are more likely to attend college than Southern
Baptists? The government of the United States has never inquired into the
religious affiliations of individual citizens because religion is regarded as a
private matter in American society and not the business of government. If such
information did become readily available, the effect might be to heighten
tensions between people of different faiths, inspiring some to complain that
they did not have their “fair share” of federal judgeships or of seats on the
boards of large corporations and that others were “overrepresented” in those
positions.
If not
religion, why race? The racial categories currently used by the federal
government derive from discredited racial theories more than a century old,
with only minor changes in nomenclature. “Negroid” has given way to “black” or “African
American,” and “Oriental” has been replaced by “Asian.” But the idea that it is
meaningful and socially useful to cram us all into one of the four racial boxes
constructed by racist thinkers more than a hundred years ago remains unchanged.
The previous decennial census, in 1990, still accepted the traditional premise
that every American belongs in one and only one of four mutually exclusive
racial categories; people of racially mixed ancestry were required to record
just one race on the census forms. The Census of 2000 has broken from this
tradition and allowed respondents to give more than one answer to the race
question, but for purposes of civil rights enforcement the results will be
tabulated in the same old crude categories, rendering the change virtually
meaningless.4
The
issue is not confined to the U.S. Census. Nineteenth-century conceptions of
race are also alive and well in the official guidelines that govern the
statistical information that all federal agencies must gather. The
authoritative statement of current practice is the Office of Management and Budget’s
Directive No. 15, “Race and Ethnic Standards for Federal Statistics and
Administrative Reporting,” first issued in 1977 and still in effect.5 Directive
15 declared that the population of the United States was divided into four “races”
and two “ethnic” groups and required all agencies of the federal government to
compile data using these categories in order to assess the impact of their
programs.
The “racial”
groups identified in Directive 15 were the usual ones: whites, blacks, Asians
and Pacific Islanders, and American Indians and Alaskan Natives. Even though
the old idea of a racial hierarchy with whites on top had lost all intellectual
respectability, the guidelines set forth in Directive 15 were designed to
subvert that hierarchy. The rationale for requiring all governmental agencies
to subdivide the population into these particular racial categories was that
these nonwhite groups had been the targets of prejudice in the past. (So had
many white immigrant groups, of course, but the guidelines made no mention of
that.) It was necessary to monitor how the nonwhite races were faring in the
present in order to overcome the allegedly lingering remnants of a history of
white supremacy. The three minority races were victim groups that had once “suffered
discrimination and differential treatmenton the basis of their race.”As
victims, they were—and are—entitled to a variety of special protections and
preferential programs not available to whites.
Does
it make sense at the end of the twentieth century to identify “races” as
defined by nineteenth-century supporters of white supremacy? The authors of
Directive 15 were careful to say that “these classifications should not be
interpreted as being scientific or anthropological in nature.” True enough, but
the admission only makes their decision to utilize them more dubious. If these
categories are not “scientific” or “anthropological,” what are they? Why should
the U.S. government distinguish some citizens from others on a basis that is
not “scientific” or even “anthropological” (whatever that means) and use those
distinctions in allocating public resources? Perhaps the answer is that the OMB
assumed that Americans today habitually draw these crude distinctions in their
daily lives, and that recognition of social reality requires the government to
do the same. This is a feeble argument. What is the evidence of a societal
consensus on precisely these distinctions? Some Americans may see the
population as divided into two groups, whites and nonwhites. Some, on the other
hand, may make much finer distinctions than these racial categories provide,
seeing Japanese Americans as quite different from Korean Americans, for
example. It is certainly questionable whether Koreans and Japanese feel a
strong sense of kinship and solidarity as “Asians”; there is considerable
antipathy between these groups that grows out of the fact that Korea was under
Japanese rule for most of the first half of the twentieth century. Immigrants
from Ethiopia and Jamaica likewise differ from blacks whose ancestors came to
North America as slaves centuries ago, but those differences are obscured when all
are thrown together into the black racial category.
Even
if it could be shown that these unscientific racial categories did correspond
at least moderately well to the way in which the general public perceives the
racial landscape, it does not follow that it is wise for the government to
insist upon the saliency of race. Justice Harry Blackmun argued two decades ago
that “in order to get beyond racism, we must first take account of race. . . .
And in order to treat some persons equally, we must treat them differently.”6 But
the race-conscious policies that have been pursued in the United States for a
generation have plainly not taken us “beyond racism.”7
President
John F. Kennedy was wiser than Justice Blackmun, I believe, when he said that “race
has no place in American life or law.”8 To continue to draw racial
distinctions in our laws and to compile massive amounts of official statistical
data about racial differences among racial groups will not serve to make race
less important in “American life.” We need not go so far as to bar government
from collecting any information whatever about the ethnic composition of the
population. But the evidence necessary to monitor the socioeconomic progress of
groups and to identify problems can be obtained without pertetuating the
dangerous fiction of race. The census currently includes a question about the “ancestry
or ethnic origin” of respondents, a concept broad enough to include African
Americans, Asian Americans, and all other Americans. The answers to this
question will yield information about what arenow classified as racial groups
without contributing to the fallacy that they are fundamentally different from
other groups based on a sense of common origins and peoplehood.
Is
Racial Victimization Hereditary?
The rationale
for making racial distinctions in official statistics is remedial. Directive 15
rests on the premise that being a member of a particular race that was treated
unfairly at some point in the past leaves an indelible imprint on everyone with
the same “blood.” Is there no statute of limitations for complaints of
historical victimization? Does the discrimination experienced by your
grandparents, great-grandparents, or even more remote ancestors have any
relevance to your life today?
The
case for classifying some Americans as belonging to a victim group is, of
course, strongest for blacks. Indeed, it is hard to imagine that official racial
statistics would still be gathered but for the continuing “American dilemma,”
the seemingly never ending problem of how black Americans can be integrated
into American society. The situation of blacks in the United States is sui generis.
Although there are many points of resemblance between African Americans and
immigrant groups that also encountered prejudice and discrimination, the
differences are fundamental. No other group has such a bitter heritage of
centuries of enslavement, followed by several decades of disfranchisement and
legally enforced separation and subordination in the Jim Crow South and by
intense racist hostility in the rest of the country.
Nonetheless,
in spite of this unique history, the assumption that blacks today should still
be regarded as victims who must be treated “differently” in order to be treated
“equally” is mistaken. African Americans made stunning educational and economic
advances in the 1940s and 1950s, which made possible the triumph of the civil
rights revolution and the passage of the Civil Rights Act of 1964 and the
Voting Rights Act of 1965, and since then they have continued to make gains.
And white racial attitudes have changed dramatically for the better.9 Anti-black
racism has by no means disappeared altogether, but it is no longer the chief
obstacle in the way of further progress by African Americans.
Note,
for example, that more than seven out of ten black babies today are born out of
wedlock, and that fully 85 percent of black children living in poverty reside
with a mother and no father.10 Suppose that these children had the same mothers
and (absent) fathers and lived in the same neighborhoods but had somehow
arrived in the world with white skins. If these children were all “white,”
would their life prospects be notably better? It seems highly doubtful. Or
consider the dismal fact that the average black twelfth-grader today reads at
the same level as the average white child in the eighth grade and is about as
far behind in math, writing, and science.11 In an economy that increasingly
rewards those with strong cognitive skills, this pattern of low educational
achievement guarantees that African Americans will be disproportionately
concentrated in the least attractive and poorest-paid jobs. Again, if they had
the same limited cognitive skills but white skins, it would not improve their
job prospects significantly.
With
other “racial” groups, the assumption that exposure to discrimination in the
past continues to be a major obstacle is even more questionable. During World
War II, Japanese American citizens living on the West Coast were presumed to be
of questionable loyalty to the United States because of their “blood” ties to
Japan, and for that reason they were forced to abandon their homes and
businesses and were locked up in relocation camps for the duration of the war.
Almost all of them were deprived of their liberty for four years, and many lost
valuable property, receiving only partial compensation long after the war had
ended. But by 1990 native-born Japanese Americans had median family incomes 47
percent higher than those of whites, and they were 57 percent more likely to have
a college degree.12 Some doubtless still bore psychic scars from their
bitter experience half a century before, but that did not prevent the
dramaticupward mobility of the group in the postwar years. By 1990 most of
those who been locked up because of their race were retired or dead; two-thirds
of the Japanese Americans then alive had been born after the relocation camps
had been shut down.13 And yet Japanese American entrepreneurs today are
given an edge over whites in the competition for federal contracts (and state
and local governmental contracts in many places) because they belong to the Asian
“race.”
An
even more strained historical argument has been made about another Asian
group—Chinese Americans—in the recent report of the Advisory Board to the President’s
Initiative on Race. The report speaks of “the forced labor of Chinese Americans”
as part of “a history of legally mandated and socially and economically imposed
subordination to white European Americans and their descendants.”14 This
is a lurid and tendentious description of the “coolie” system, a form of
indentured servitude in which Chinese merchants advanced passage money to
America to unskilled workers who then paid off their debt through labor. But
even if the coolie system was as bad as the quoted characterization, how is the
indentured labor of the Chinese in California in the 1870s relevant to the
situation of Chinese Americans in the 1990s? Chinese immigrants did indeed
encounter horrendous prejudice in the nineteenth century and after, but the
1990 Census revealed that native-born Chinese Americans were even more
successful than the enormously prosperous Japanese Americans, with median
family incomes some 58 percent higher than those of whites.15 But
Chinese Americans are nonetheless favored over whites in various public
contracting programs on the assumption that their “race” remains a major
handicap.
If the
connection between the coolie system or the internment camps and the Chinese
and Japanese Americans of today is tenuous, it shrinks to the vanishing point
when this purported link is extended to all persons of Asian “race.” It happens
that more than four out of five Asian American adults living in the United
States today were born abroad; indeed, almost all the foreign-born have arrived
in the past three decades, at a time when anti-Asian prejudice was disappearing
and public commitment to equal treatment for all Americans had brought about
strong federal legislation to combat racial discrimination.16 Many
of these newly arrived Asians— Koreans, Cambodians, and Vietnamese, for
example—are from countries that sent virtually no immigrants to the United
States before World War II, so there was no history at all of racism against
their ancestors in the United States. The earlier mistreatment of Chinese and
Japanese Americans did nothing to dissuade these newcomers from moving to
America in search of greater opportunity, nor should it have. It had no bearing
whatever on their prospects for a better life in contemporary America.
The
Invention of “Hispanics” as a Quasi-Racial Group
In
addition to the three groups presumed to be disadvantaged because of their
race, Directive 15 added a fourth—”persons of Hispanic origin.”17 When
the OMB issued its guidelines in 1977, the number of Mexican Americans in the
United States had been growing dramatically, and immigration from Central and
South America was also accelerating. Disproportionately large numbers of the
newcomers from Latin countries had poorly paid unskilled jobs and family
incomes below the poverty line.
Were
their economic difficulties due largely to prejudice against them, or were they
due to the fact that they had arrived in the United States with little
education, limited or no command of English, and few marketable skills? The OMB
did not even acknowledge the question. Directive 15 assumed that the depressed
economic and social position of Hispanics was mainly the result of racism and
that federal agencies accordingly must compile statistics on the group and do
as much as possible to assist them.
Another
problem with the “Hispanic” concept was the attitude of the so-called Hispanics
themselves, most of whom did not regard themselves as members of a nonwhite “race.”
Although activists from the group insisted that they were “people of color,”
that was not the perception of most of those they claimed to speak for. People
of Hispanic ancestry typically identified themselves as whites on the census
and other official forms that included a race question—marriage licenses and
birth and death records, for example.18
At one
point earlier in the century, Mexican Americans were categorized as nonwhite by
the census takers, and the results were instructive. In 1930 the Census Bureau
departed from its earlier practice of classifying Mexican Americans as white
and instead employed a Mexican “race” category. Enumerators were to use it for “all
persons born in Mexico, or having parents born in Mexico” who in their judgment
were “not definitely white.”19 People of Mexican ancestry were lumped together with
blacks, Asians, and American Indians in the reported totals for “nonwhites.”
After Mexican American organizations and the Mexican government furiously protested
the decision to relegate members of the group to the nonwhite category, census
officials abandoned the categorization and restored Mexican immigrants and
their children to the white column.20
This
pattern of racial identification continues today also and applies not only to
Mexican Americans but also to other Hispanics. Although Latinos tend to have
darker skins than the typical American of European ancestry, a large
majority—95.7 percent, according to a 1991 Current Population Survey—report
themselves to be white.21 And very few of those who reject the white
designation identify with any of the other three races; they think of
themselves as being of racially mixed origins, rejecting the Census Bureau’s
traditional view that everyone belongs in one and only one racial box.
To
overcome this awkward difficulty—alleged victims of racism who did not belong
to a nonwhite race—the OMB created a new category, “Hispanic.” According to
Directive 15, Hispanics were frequently the objects of prejudice and “differential
treatment,” not because of their “race” but because of their “ethnicity.”
Federal agencies were required to compile data on Hispanics as well as on the
three nonwhite races because “ethnicity” for Hispanics was presumed to be the
functional equivalent of race for blacks, Asians, and American Indians.
The
concept of “ethnicity” had long been an essential analytical tool for
understanding American society, but Directive 15 used the term in a novel,
indeed bizarre, way. The common understanding of American society was that
immigration had played a central role in its development and that many distinct
“ethnic groups” had emerged out of the immigration experience and then faded
away as later generations became more integrated into the larger society. Being
a stranger in a strange land was difficult, and newcomers naturally felt the
need to associate with other people who spoke their native tongue, liked
similar food, worshiped in the same way, and had similar customs and values.
The Harvard Encyclopedia of American Ethnic Groups describes
more than one hundred such ethnic groups, many of them extinct or close to it
by now.22
It is
thus remarkable that the official guidelines employed by the federal government
maintain that there are just two ethnic
groups in the United States: persons of “Hispanic origin” and those “not of
Hispanic origin.”23 Several dozen white ethnic groups with distinct
identities were suddenly collapsed into a single group with the awkward label “not
of Hispanic origin.” All the white ethnic groups had presumably merged into the
general population, while Hispanics were taken to be an unassimilable,
race-like group that would be as enduring as the “races” that the federal
government was so dedicated to enumerating—even though most Hispanics
considered themselves, and had always been officially classified as, “white.”
Equally
dubious was the assumption that the umbrella label “Hispanic” designated a
coherent entity with a common historical experience of oppression at the hands
of white Americans. What do Mexican Americans, Puerto Ricans, Cubans,
Argentineans, Colombians,Venezuelans, Chileans, and more than a dozen other
immigrant nationalities from Central or South America really have in common?
Not even some variant of the Spanish language as their mother tongue, because
the label has been defined to include people who trace their origins to
Portugal or Brazil and are Portuguese-speakers. And it includes a variety of
Indian peoples whose home language is not Spanish. Perhaps most remarkably, the
rubric includes the descendants of roughly three-quarters of a million
immigrants from Spain or Portugal, although no one could seriously argue they
have encountered more prejudice in the United States than immigrants from countries
like France, Italy, Poland, or Greece. The category Hispanic is more like the
category European than the category Italian or German, and no scholar considers
the dozens of American ethnic groups that derive from Europe a single ethnic
group with a common experience.
A
majority of the Americans now designated as Hispanic are Mexican Americans, and
the case for viewing their history as one dominated by “racism and oppression”
cannot withstand critical scrutiny either. The report of the President’s
Initiative on Race advances this charge, speaking of “the conquest and legal
oppression of Mexican Americans and other Hispanics.”24 This
is absurdly oversimplified history. The five southwestern states from New
Mexico to California were indeed once part of Mexico and were annexed to the
United States at the end of a war between the two nations in the 1840s. But
only a tiny fraction of the Mexican American population today can trace their
origins to that conquest. A mere 13,000 people born in Mexico were recorded as
U.S. residents in the Census of 1850, and they were people who had chosen to
remain and live under American rule following the Mexican War.25 Mexican
Americans did not become a quantitatively significant element of the U.S.
population until well into the twentieth century. As late as 1910, they were no
more than 0.4 percent of the total U.S. population.26 The
real growth of the group was the result of a huge wave of immigration from
Mexico that began during the World War I decade, an immigration that was
basically similar to the peasant migrations from eastern and southern Europe
early in the century. Another much larger immigration wave from Mexico began in
the 1950s and continues today.
The
idea that the lives of Mexican Americans are somehow blighted by a legacy of “conquest”
makes no sense unless one assumes that the historical memory of having lost
territory to the United States a century and a half ago is somehow carried in
the blood of everyone of Mexican American descent. Immigrants from Mexico who
arrived in the twentieth century encountered prejudice, of course, but whether
the hostility was any greater than that met with by Italians, Poles, or Jews is
questionable. Certainly they were not subjected to “legal oppression”
comparable to what blacks experienced in the Jim Crow South.
Because
of their strong historical concentration in the Southwest and their traditional
employment as farm laborers, Mexican Americans tended to have low incomes and
limited opportunities to obtain an education that would facilitate their
mobility in the larger society. In recent decades, movement out of rural areas
and agricultural occupations has gradually resulted in the growth of a Mexican
American middle class, at a pace comparable to that of groups like Italians and
Poles earlier in the century. The impressive upward mobility of Mexican
Americans has been obscured, however, by the continuing influx of large numbers
of relatively uneducated immigrants from Mexico, both legal and illegal, whose
lowly status pulls down the average for the group as a whole.27
To
view American society as divided into four separate, watertight compartments
called “races,” with a fifth compartment for a “Hispanic” race that is not
quite a race, is profoundly misleading. So is the assumption that public policy
should be based on the assumption that three of these races and the Hispanic
ethnic group have been oppressed and victimized by the white majority for so
long that they need preferential treatment in education, employment, and public
contracting into the indefinite future.
The
Myth of the Impending Minority Majority
The
picture of the American people as divided into oppressors and oppressed
racial-ethnic groups is an oversimplification and a distortion. The errors it
entails are compounded when we attempt to peer into the future and calculate
what the racial and ethnic mix of the American population will eventually be.
Projections of precisely this kind have attracted considerable public
attention, thanks to a credulous press. The cover story in the April 9, 1990,
issue of Time featured a Census Bureau projection that concluded
that the United States would have a “minoritymajority” population by the year
2050, Since then, the official estimates have been revised slightly, with the
latest indicating that the “minority” population (blacks, Asians, Hispanics,
and American Indians) will be a shade less than a majority in 2050—49.7 percent
of the population.28 Will this in fact happen? Will it matter if it
does? The first thing to notice is that demographers have never been much good
at prediction. In the l930s, population experts were unanimous in foreseeing a
sharply declining population in the U.S. and other industrial societies. Not
one predicted the postwar Baby Boom or the resumption of mass immigration to
American shores. In the past half century, instead of declining, the U.S. population
has almost doubled. Demographers project future populations on the basis of
currently observable patterns of immigration, fertility, and mortality. The
more remote the future, the greater the possibility that these variables will
change in unanticipated ways.
Indeed,
the Census Bureau recognizes some of the uncertainty by issuing a series of
different projections of the expected population at various future dates. The
projection cited above is based on the “middle series” estimate, which puts the
total U.S. population at 394 million in 2050. But the “low series” estimate the
bureau makes for that year is just 283 million, and the “high series” estimate
is 519 million.29 The high and low estimates vary from each other by
a staggering 236 million. Thus the population half a century from now may be
nearly double what it is today (approximately 270 million), but it might
instead be a mere 5 percent larger than it is now. If there is such great
uncertainty about what the total population will be half a century from now, there
must be similar uncertainty about the size of the various racial and ethnic
subgroups that make up the total.
Why do
these projections vary so enormously? Because they necessarily rest on
assumptions about the determinants of population growth that may prove
mistaken. For example, they require accurate estimates of the level of
immigration to the United States thirty or forty years hence. Obviously, we
cannot know that with any reliability because our immigration policy may become
far more restrictive than it is now. Laws enacted in the 1920s sharply cut back
on the number of new arrivals, and we cannot be sure that a similar
anti-immigrant backlash will not again close the door to newcomers from abroad.
Nor
can we be at all sure about a second variable that determines how the size of a
population changes over time—its fertility patterns. (Changes in mortality
rates can also affect population size, but mortality usually does not fluctuate
dramatically enough to make a big difference, except in the case of demographic
catastrophes like the Great Plague of the fourteenth century.) At the beginning
of the twentieth century, a greatmany Americans of native stock worried about
the consequences of their own rapidly declining fertility. Many feared that
they were being swamped by huge waves of new immigrants and the large families
the new arrivals typically had. Lothrop Stoddard, a leader of the Immigration
Restriction League, warned that Anglo-Saxons were committing “race suicide.”
According to his calculations, after 200 years 1,000 Harvard men would have
left only 50 descendants, while 1,000 Romanian immigrants would have produced 100,000!30
There
was nothing wrong with Stoddard’s math. The problem lay with his straight-line
projection of the fertility differentials of his day 200 years into the future.
He failed to comprehend that in the second and third generations Romanian
Americans would adjust their fertility patterns to the American norm and would
produce many fewer children than did the immigrant generation.31
This
process of assimilation to the prevailing national fertility norm continues to
operate today. Although the current fertility rate of Mexican immigrantwomen is
twice the national average, Mexican Americanwomen born in the U.S. have 23
percent fewer children than did their mothers.32 And Mexican American women who
graduate from college have families that are 40 percent smaller than those of
their ethnic sisters with less than nine years of schooling.33 The
high average fertility of women of Mexican origin will drop in the future if the
group does not continue to be replenished by huge numbers of new immigrants and
if an
increasing proportion of Mexican American females go on to college. Both are
big ifs, which indicates how difficult it is to make confident predictions
about the demographic future.
Stoddard
also erred in his implicit assumption that Romanian immigrants and their
children would keep marrying with the group, perpetuating the cultural patterns
of their country of origin. Quite the opposite happened. Romanians, like most
other immigrants, often married non-Romanians, with the probability rising the
longer they lived in the United States. Ethnic intermarriage complicates ethnic
identification. Are you still a Romanian American if just one of your four
grandparents was Romanian? What if two of the four were? The immigrants of the
early twentieth century, like their nineteenth-century predecessors, usually
chose mates of the same ethnic background, but many of their children and a
great many of their grandchildren did not. The population derived from the
great waves of European immigration is by now so thoroughly interbred that
their ethnic origins are difficult to disentangle and of little consequence.
Assimilation
via the “marital melting pot” has also occurred at a rapid pace among the
immigrants of the post–WorldWar II era. Recent evidence as to how many
Hispanics are marrying non-Hispanics is lacking, but a classic earlier study of
Mexican Americans found that 40 percent of those who wed in Los Angeles County
in 1963 chose non-Hispanic mates. By the third generation, indeed, members of
the group were more likely to marry non-Hispanic whites than persons of Mexican
ancestry.34 The rate may be somewhat lower today because the
volume of recent immigration from Mexico has been so high, but it can be
expected to climb if and when the influx of newcomers declines. Asian Americans
are, if anything, more likely than Mexican Americans to marry outside the
group, almost always to whites.35 In the past three decades, the rate of black-white
intermarriage has also risen precipitously, though it started from a very low
level.36
If
intermarriage continues at such high levels, a very large proportion of all
Americans in 2050 and even sooner will have some Hispanic, Asian, or African “blood.”
But it does not follow that all or even most of these individuals will identify
more with their one Hispanic, Asian, or black ancestor than with those who were
non-Hispanic whites. To believe that nonwhite “blood” or Hispanic “blood”
trumps all other identities is simply an extension of the traditional and
pernicious “one drop” rule, the notion that “one drop of black blood makes you
black.” Even in the case of African Americans, the “one drop” rule is no longer
unquestioned, as the example of TigerWoods suggests. And certainly there is no
consensus that one drop of Asian, Hispanic, or American Indian blood consigns
you to membership in those groups.
The
Census Bureau today has more sophisticated techniques for modeling population
change than were available to Stoddard, but it has been no more successful than
he was at grappling with the reality of ethnic intermarriage, assimilation, and
loss of ethnic identity, a reality that fatally confounds all efforts to
extrapolate contemporary ethnic divisions into the remote future. Even if the
descendants of Romanian Americans and the other “new immigrants” of the early
twentieth century who so worried the Immigration Restriction League are now a
majority of the population, as Stoddard feared, who could possibly care? By the
time that the groups currently classified as “minority” become a majority, if
that ever happens, it will be equally irrelevant, because they will no longer
be thought of as minorities.
Moreover,
if today’s immigrants assimilate into the American stream as readily as their
predecessors did at the turn of the century, there will not be any minority
majority issue. Whatever their origins, they will have joined the American
majority, which is determined not by one’s bloodlines but by one’s commitment
to the principles for which this nation stands.
One
America in the 21st Century?
Still,
assimilation cannot be taken for granted. We cannot reliably predict the shape
of the ethnic and racial future of the United States. The historical parallels
drawn above may not hold because the melting pot ideal that was once so widely
accepted has by now been largely displaced by the competing ideal of
multiculturalism, which implies that racial and ethnic divisions are and should
be permanent.
The
Clinton administration has optimistically labeled the President’s Initiative on
Race “One America in the 21st Century,” and that phrase was used as the title
of the final report of the Race Initiative’s Advisory Board. Rhetoric about “one
America” is good p.r., but in fact the thinking behind the Race Initiative is
likely to lead us toward a balkanized future. Chapter 1 of the Advisory Board’s
1998 report is supposed to illuminate the “common values and concerns” that
Americans “share, regardless of racial background.” 37 But
only its first section, headed “Americans Share Common Values and Aspirations,”
makes the point, and it is just one paragraph long and hopelessly vague—no
mention at all of common commitment to the Constitution of the United States
and to the rule of law, no reference either to the melting pot ideal.
After
this perfunctory nod to the notion of common American values, the chapter
devotes a full sixteen pages to platitudes such as “dialogue is a tool for
finding common ground,” “dialogue helps to dispel stereotypes,” “the role of
religious leaders,” “the role of business leaders,” “the role of young leaders.”
The assumption seems to be that genuine national unity cannot be attained
unless we all participate in group discussions designed to enhance our “awareness
of the history of oppression, conquest, and private and government-sanctioned
discrimination and their present-day consequences.”38 We are
all enjoined to “commit at least one day each month to thinking about how
issues of racial prejudice and privilege might be affecting each person you
come into contact with.”39
Although
the report asserts ritualistically that Americans share “common values and
concerns,” it rejects the idea that a common American culture binds us
together. Highlighted in a box is a quotation from a student who said, at a “children’s
dialogue on race, poverty, and community,” “I don’t think we need to become one
culture. I think we just need to respect the differences of each culture.”40 The
simplistic view that the American people belong to five separate cultures, with
all but non-Hispanic whites the victims of racial oppression, is hardly a
recipe likely to make us “one nation, indivisible.”
If the
assumptions behind the President’s Initiative on Race continue
to
shape public policy in the decades to come, the aim of “One America”
will
not be realized. By continuing race-driven policies in the delusion that
they
will enable us to “get beyond racism,” we will only ensure the perpetuation
of
racial and ethnic divisions far into the future.
Notes
1. Peter
Brimelow, Alien Nation: Common Sense About America’s Immigration
Disaster (New York:
Simon & Schuster, 1995), p. 1.
2. Lest it be
thought that this 1995 poll was an aberration, it should be noted that
a 1990 Gallup
poll found that white Americans thought that blacks were no less than
32 percent of
the population, even further from the mark than the 24 percent estimate
of those polled
in 1995. Similarly, African Americans in 1990 thought that blacks were
42 percent of
the population, 3.5 times as many as there were in fact. See George Gallup
Jr. and Frank
Newport, “Americans Ignorant of Basic Census Facts,” Gallup Poll
Monthly, no. 294
(March 1990), p. 2.
3. For some
perceptive comments on the implications of this survey, see Orlando
Patterson, The Ordeal of
Integration: Progress and Resentment in America’s “Racial”
Crisis (Washington,
D.C.: Civitas/Counterpoint, 1997), pp. 56–60.
4. Although the
Office of Management and Budget has ordered that 63 different
racial
combinations be tabulated, which becomes 126 when you add Hispanics to the
mix, it has
ruled that in order to assess possible civil rights violations, those fine
distinctions
are to be ignored. Persons who report themselves a mixture of white and
some other race
are all to be put in the other racial category, a reversion to the old “one
drop rule.” See
Stephan Thernstrom, “One Drop Still—A Racialist’s Census,” National
Review, April 17,
2000.
5. Office of
Management and Budget, Statistical Directive No. 15, “Race and
Ethnic
Standards for Federal Agencies and Administrative Reporting, as Adopted on
May 12, 1977,” Federal Register, v. 43,
19629–19270. The quotations in this and the
following two
paragraphs are drawn from this document. For an excellent brief analysis
of these
guidelines, see Peter Skerry, “Many American Dilemmas: The StatisticalPolitics
of Counting by
Race and Ethnicity,” Brookings Review, Summer 1996, pp. 36–39. In
October 1997
the OMB announced some revisions in its classification scheme. It
subdivided the “Asian
and Pacific Islander” category into two: “Asian” and “Native
Hawaiian or
Other Pacific Islanders,” so there are now five officially recognized races.
And it allowed
people of mixed race to select more than one racial designation from
the list of
five.
6. Regents of the
Univ. of Calif. v. Bakke, 438 U.S. 265, 407 (1978).
7. See Stephan
Thernstrom and Abigail Thernstrom, America in Black and White:
One Nation,
Indivisible (New York: Simon & Schuster, 1997), part III,
for a critical
analysis of
racially preferential policies.
8. As quoted in
ibid., p. 138.
9. The history
of racial segregation and subordination and the struggle against it
are traced in
ibid., part I. The enormous progress made by blacks since the 1960s and
the sharp
decline in white prejudice are reviewed in part II and the conclusion to the
work.
10. Ibid., pp.
237, 240.
11. The
evidence on the racial gap in cognitive skills at age 17 is set forth in ibid.,
pp. 352–59.
Possible explanations for the gap are reviewed in ibid., pp. 359–82.
12. U.S. Bureau
of the Census, 1990 Census of the Population, Asian and Pacific
Islanders in the
United States, 1990 CP-3-5 (Washington, D.C.: U.S. Government
Printing
Office, 1993), tables 3 and 5; U.S. Bureau of the Census, Current Population
Reports,
P-60-174, Money Income of Households, Families, and Persons in the United
States: 1990 (Washington,
D.C.: U.S. Government Printing Office, 1991), table 13; U.S.
Bureau of the
Census, Statistical Abstract of the United States: 1991 (Washington,
D.C.:
U.S. Government
Printing Office, 1991), table 43.
13. Asian and
Pacific Islanders, table 1.
14. President’s
Initiative on Race Advisory Board Report, One America in the 21st
Century: Forging
a New Future (Washington, D.C.: U.S. Government Printing Office,
1998), pp. 36,
43.
15. Asian and
Pacific Islanders, table 5; Money Income of Households, table 13.
16. Asian and
Pacific Islanders, table 1.
17. Some
precedent for the creation of this category was provided by the 1970
Census, which
identified the “Spanish origin or descent” population by asking respondents
whether they
were Mexican, Puerto Rican, Cuban, Central or South American,
or “other
Spanish.” See A. J. Jaffe, et al., Spanish Americans in the United
States: Changing
Demographic
Characteristics (New York: Research Institute for the Study of Man,
1976),
pp. 347–48.
18. A March
1991 Current Population Survey found that 95.7 percent of those who
identified
themselves as of Hispanic origin considered themselves white, 2.2 percent
black, 0.4
percent American Indian, and 1.5 percent of “other race”; U.S. Bureau of
the Census,
CurrentPopulationReports: Special Studies, P23-182,Exploring
Alternative
Race-Ethnic
Comparison Groups in Current Population Surveys (Washington,
D.C.: U.S.
Government
Printing Office, 1992), table A. The 1990 Census, by contrast, found that
51.7 percent of
Hispanics regarded themselves as white, and 42.7 percent said they
were of “other
race.” The difference is attributable to the fact that the CPS accepts
“other race” as
an answer only when respondents say they are unable to choose among
the four given
to them, whereas the census lists “other race” as an option, and indeed
frames the race
question in a way that encourages Hispanics to check the “other race”
box. For a
critique of the census race question, see Stephan Thernstrom, “American
Ethnic
Statistics,” in Donald L. Horowitz and Gerard Noiriel, eds., Immigrants in
Two
Democracies:
French and American Experience (New York: New York University
Press,
1992), pp. 100,
108.
19. Jaffe, Spanish
Americans, p. 346.
20. S.
Thernstrom, “American Ethnic Statistics,” p. 91.
21. U.S. Bureau
of the Census, Exploring Alternative Race-Ethnic Comparison
Groups, table A.
22. Stephan
Thernstrom, ed., Harvard Encyclopedia of American Ethnic Groups
(Cambridge,
Mass.: Harvard University Press, 1980).
23. Statistical
Directive No. 15, 19629.
24. One America in
the 21st-Century, p. 36. For more sophisticated and nuanced
treatments of
this group, see Peter Skerry, Mexican Americans: The Ambivalent
Minority
(New York: Free
Press, 1993), and the essays inWalker Connor, ed., Mexican-Americans
in Comparative
Perspectives (Washington, D.C.: Urban Institute Press, 1985).
25. Jaffe, Spanish
Americans, p. 134.
26. Ibid., pp.
134–35.
27. For impressive
evidence of upward mobility by Mexican Americans in Southern
California over
the 1980–1990 decade, see Dowell Myers, The Changing Immigrants of
Southern
California, research report no. LCRI-95-04R, Lusk Center
Research Institute,
University of
Southern California, Los Angeles, 1995.
28. The latest
estimates appear in U.S. Bureau of the Census, Statistical
Abstract of
the United
States: 1998 (Washington, D.C.: U.S. Government Printing Office,
1998),
table 12.
29. Ibid.,
table 3.
30. Lothrop
Stoddard, The Revolt Against Civilization: The Menace of the Under
Men (New York:
Scribner’s, 1923), pp. 112–13.
31. Tamara K.
Hareven and John Modell, “Family Patterns,” in S. Thernstrom, ed.,
Harvard
Encyclopedia of American Ethnic Groups, pp. 348–49. The typical Italian
immigrant
woman recorded
on the 1910 Census gave birth to seven children; their
American-born
daughters produced an average of five; see S. Philip Morgan, Susan
Cotts Watkins,
and Douglas Ewbank, “Generating Americans: Ethnic Differences in
Fertility,” in
Susan CottsWatkins, ed., After Ellis Island: Newcomers and Natives in the
1910 Census (New York:
Russell Sage Foundation, 1994), pp. 94–95.
32. U.S. Bureau
of the Census, 1990 Census of the Population, Persons of Hispanic
Origin in the
United States, 1990 CP-3-3 (Washington, D.C.: U.S. Government
Printing
Office, 1993),
table 1.
33. James A.
Sweet and Larry L. Bumpass, American Families and Households (New
York: Russell
Sage Foundation, 1987), p. 135.
34. Leo
Grebler, Joan W. Moore, and Ralph C. Guzman, The Mexican-American
People: The
Nation’s Second Largest Minority (New York: Free Press, 1970), pp.
408–9.
35. Harry L.
Kitano, Asian Americans: Emerging Minorities (Englewood Cliffs, N.J.:
Prentice-Hall,
1995), pp. 176–80.
36. Some 12.1
percent of the African Americans who married during 1993 had
white mates, as
compared with 0.7 of those who wed a generation earlier, in 1963;
Thernstrom and
Thernstrom, America in Black and White, p. 526. Although 12 percent
may not seem a
very high number, it is much higher than the rate of intermarriage
between Jews
and Gentiles in New York City and between Japanese Americans and
whites in Los
Angeles County beforeWorld War II; ibid., pp. 526, 536.
37. One America in
the 21st Century, p. 12.
38. Ibid., p.
35.
39. Ibid., p.
102.
40. Ibid., p.
26.
==============================
Immigration and Group Relations
REED
UEDA
The
United States is the prototype of a country built by immigration
and assimilation. The blurring of ethnic lines through the process of assimilation
has promoted equality of economic opportunity and produced a cultural life open
to popular participation and relatively free of constraints imposed by group
membership.1 African Americans are the obvious exception to this
pattern, since their ancestors came as slaves, not as “immigrants”—as the word
is customarily used—and they are not a subject in this essay.
Those
who arrived as newcomers on the American shore were thrown into a “melting pot,”
almost every scholar once assumed. It was much too simple a notion. Many
immigrants joined the mainstream while preserving much of their own ethnic
culture. In fact, American liberty has allowed precisely that process of
preservation. Freedom and tolerance have permitted religious and cultural
minorities who were marginalized or persecuted in their homelands to maintain a
distinctive way of life free from fear. The consequence of limited government
has been an extraordinarily strong civil society within which groups have
organized on their own terms.2 Widespread assimilation is thus coupled with a
vibrant ethnic pluralism. American society resembles a simmering stewpot of
gradually blending fragments; no crucible immediately melted newcomers into
homogeneous Anglo-conformity.
But
collective ethnic identity has never been a self-evident and permanent “given”;
it has required much energy to sustain. The loose, open, and eclectic
organization of American society has been, at one and the same time, a gift and
a mortal enemy, affording spaces for ethnic life yet confounding those who
would preserve a cultural inheritance in its more or less original form. In the
era of industrialization and urbanization, an immense array of foreign
nationalities settled together in rough propinquity, each group exposed to the
different habits of new neighbors, and to a consumer-oriented mass culture that
eroded their traditions.3
In
addition, although immigrant communities have not “melted,” with each
successive generation they have tended to become increasingly American. Over
successive generations, social mobility and acculturation produced positive
changes in social class, schooling, and participation in public life and
affairs. And thus by intergenerational measures of occupational mobility,
residential patterns, income, property ownership, and education, members of
European and non-European immigrant groups (to varying degrees) came to look
much alike.
Furthermore,
paradoxically, as newcomers from the Western Hemisphere, Asia, and Africa made
American society more culturally and racially pluralistic, the possibilities
for assimilation increased. The influx of newcomers produced a greater
tolerance of intergroup differences, making the society more absorptive. Thus
Poles, for instance, became more willing to shed their Polishness in favor of “the
American way.” Had the society been less tolerant, groups would have held fast
to their ethnic traditions in residential enclaves. As it was, groups underwent
a gradual but steady course of cultural transformation. That process began with
northern and western Europeans in the nineteenth century; they were followed in
the early twentieth century by southern and eastern Europeans, Asians, and immigrants
from Western Hemisphere countries. More recently an influx of people from the
Third World have followed in their footsteps. These new Americans shaped a
creative assimilative process in which they both changed themselves and became
part of the whole by changing the whole. The national culture was porous and
absorbent, but so were the subcultures arising out of the adaptation of
immigrants and their children.4
The
movement of immigrant groups into the center of national life constituted a
creative achievement in the face of imposing challenges and obstacles. The
alienated and disempowered multitudes from abroad arduously devised the arts of
coexistence with others. They learned to act together with culturally
distant—sometimes hostile—natives and other newcomers who had been strangers or
antagonists in the countries they left behind. In their new homes in America,
the Jews, Poles, Russians, and Germans of Chicago came to accept each other as
neighbors and as equals. Immigration was a rigorous school in which new lessons
of group cooperation and interdependence had to be learned for the sake of survival.5
The
new cultural relationships in which immigrants found themselves inevitably
attenuated the transplanted forms of homeland culture. Pathways of
multigenerational change varied in timing and length, but they all tended to
head in the same direction. The English, the Welsh, the Dutch, and the Scots,
and to a lesser degree the descendants of Norwegians, Danes, Swedes, and
Germans—those whose ancestors were part of the American population since the
colonial and early national era—experienced the greatest divergence from
homeland cultural legacies. Americans whose forebears came from southern and
eastern Europe, Asia, the Caribbean, and Latin America exhibited a stronger
tendency to retain distinctive ethnic features. But even for them, the ties and
feelings of a homeland-based identity yielded in degrees to the syncretic and
eclectic forms of American culture.
Immigrants
were often unaware of how far they had departed in habit and custom from the
ancestral culture. An American-born Chinese girl in the 1930s described the
experience of self-discovery on a visit to China:
I gave
up trying to be a Chinese; for as soon as the people in China learned that I
was an overseas Chinese, they remarked, “Oh, you are a foreigner.” Some asked, “Where
did you learn to speak Chinese?” Some thought it remarkable that I spoke
Chinese at all. So you see I was quite foreign to China. I wore Chinese clothes
and tried to pass as a Chinese, but I could not so I gave up and admitted my
foreign birth and education. I lack very much a Chinese background, Chinese
culture, and Chinese manners and customs; I have neither their understanding
nor their viewpoint nor their patience. Sometimes I was homesick for America.
Where I had friends, I felt better.6
The
inescapable forces of social change made ethnic identity only one part of
personal identity. Increasingly, over the generations, individuals were shaped
by the jobs they held, the churches they attended, their places of residence,
and by their schooling, peer culture, and consumer tastes.7 In addition,
the public forms of Anglo-Saxon society became, for immigrants and their
descendants, a cultural lingua franca. For later descendants of European
immigrants, ethnicity itself became increasingly thin and symbolic, a matter of
personal choice.8
Assimilation
also meant a very high degree of linguistic unification in twentieth-century
America, in spite of a mass immigration that introduced a linguistic diversity
greater than that found in any other modern society. In the early twentieth
century, several dozen languages were spoken; in the 1990s, the number of
foreign languages in use probably rose even higher and certainly included many
more non-European languages. But people may know and use both the language of
their homeland and English; over time, immigrantswho speak Vietnamese at home
have nevertheless become absorbed into an English-language culture.
Thus,
a study based on the 1990 U.S. Census showed that among all immigrants, the
proportion of those who spoke only English or who spoke English very well rose
from 36 percent among those who had been in the United States five years or
less, to 57 percent among those who had been residents from sixteen to
twenty-five years, to 77 percent for those who had been here for forty or more years.9
In
addition, the numbers of those who primarily used a foreign tongue dwindled
sharply by the second generation. The federal Census of 1980 showed that almost
all natives (more than four years old) spoke English as their primary language,
although many were of immigrant ancestry. Since many recent immigrants arrived
well educated and had often studied English, they moved rapidly into the
English linguistic mainstream. Even Hispanics, represented by group spokesmen
advocating an official policy of bilingualism, have nevertheless made large
strides toward English usage. In the 1970s, the majority of American-born
Hispanic adults—including three-quarters of Mexicans, four-fifths of Puerto
Ricans and Cubans, and nine-tenths of Central or South Americans—used English
as their principal or sole language.10
The
impressive rise in the rate of intermarriage among the descendants of
immigrants may have been the trend with the most profound impact, however. The
extraordinary degree to which the American population has become defined by
mixed ancestry in the late twentieth century is evident in Census data. “Intermarriage
[became] so common in the postwar era that by 1980 the vast majority of
Americans had relatives, through birth or their own marriage, from at least two
different ethnic backgrounds,” an expert on American pluralism has noted.11
Indeed,
well beforeWorldWar II, social scientists were calling attention to the rise in
ethnic intermarriage. The pioneering sociologist of the University of Chicago,
Robert E. Park, saw the fusion of races in Hawaii where “new peoples are coming
into existence” as a harbinger of the future.12 On the other hand, a well-known
study of religious intermarriage in 1940 found that, yes, Italians were
marrying the Irish, but Catholics were choosing Catholic spouses, Jews other
Jews, and Protestants, too, were sticking to their own. As Will Herberg was
later to put it, the American experience was thus characterized by not one but
three melting pots—Jewish, Catholic, and Protestant. Separate processes of
melting took place within each of these pots.13 Fifty years later, however, that
picture had changed. By the 1990s, half of Catholics and Jews were marrying
outside the faith.14
At the
end of the twentieth century intermarriage among both religious and ethnic
groups of European origin was pervasive.15 Indeed, by the third or fourth
generation intermarriage is frequent, if not the norm, among many European
ethnic groups. In 1972, in a special population survey conducted by the Bureau
of the Census, 40 percent of white respondents chose not to identify with any
specific heritage.16 In subsequent years, the number of Americanswho saw
themselves as simply “American” continued to rise. A 1979 Census survey
encouraged respondents to choose ethnic ancestries, and yet 13.5 million
refused and gave “American” or “United States” as their ancestry; they became
the seventh largest “ethnic” group on the government’s list.17
That
survey included members of non-European groups; newcomers from Asia and Latin
America also have significant rates of mixed ancestry and intermarriage. In the
1979 poll, 31 percent of Filipinos, 23 percent of Chinese, 22 percent of
Japanese, and nearly 22 percent of the Spanish ancestry population claimed
multiple ancestry.18 These rates of intermarriage provoked a heated
debate over whether the federal census of 2000 should include a “multiracial”
enumeration category for the rising number of offspring of such unions.19 These
high rates of intermarriage led to the decision to allow multiple answers to
the race question on the federal census of 2000.
When
Asian or Hispanic minorities marry outside their groups, the spouses are
usually white. A study of 1990 federal census returns found that, looking at
all married couples with an Asian spouse, 27 percent had a white spouse, and 3
percent had a nonwhite or Hispanic. Among married couples with a Hispanic
spouse, 29 percent had a non-Hispanic white spouse, while only 2.1 percent had
a nonwhite. Nearly a quarter of the 2.0 million children who had at least one
Asian parent, and a quarter of the 5.4 million children with at least one
Hispanic parent, lived in interracial households with a white parent or
stepparent.20 The rates of mixed ancestry among Asians and
Hispanics appear especially impressive when one takes into account group
sanctions against exogamy, the operation of laws barring miscegenation that
were not completely stricken from state statutes until the 1960s, and the high
percentage of recent immigrants who might have been expected to maintain group
ties.
These
assimilative patterns obviously took time to take hold, and the process was not
all sweetness and light. In the immediate wake of the migrations of the
twentieth century, ethnic boundaries usually tightened, cultural distances
widened, and social divisions deepened. Large numbers of new immigrants
strained institutions and public services. In the Progressive era, middle-class
natives complained that Italian, Jewish, and Slavic immigrants meant expensive
Americanization programs, overcrowded schools, overburdened charity
organizations, spreading slums, disease, crime, political corruption, and the
propagation of alien cultural values. These disorders were handled by teachers,
policemen, physicians, nurses, inspectors, administrators, bureaucrats, and
elected officials at a high cost to the public. In post–Cold War America, the
same complaints about the burdens of immigration could be heard in updated
form. Those concerned about the continuing flood of newcomers talked about the
costs of bilingual and multicultural school programs, the spread of barrios,
overtaxed hospital and medical facilities, the environmental impact, ethnic
favoritism in the form of racial and ethnic preferences, and the spread of
non-Western values and customs.21
But
such doubts and fears ignore much good news. Immigrants have been producers,
consumers, and entrepreneurs, and their economic energy has increased the gross
national product and made for greater general prosperity. Often self-educated,
hard working, and thrifty, they have also brought to their adopted land
valuable cultural capital. Immigrants have helped, too, to expand the
dimensions of American liberty and democracy. They have insisted on their right
to maintain their ethnic heritage, as well as to modify or reject it. And
wanting to ensure their own self-determination— their right to make social,
cultural, and political choices—they have widened the degrees of freedom for
others.22
As a
corollary, immigrants have demonstrated that American opportunities for the
individual could work to overcome notions of group determinism. They have
affirmed the principle that personal achievement is the basis of self-worth and
have in that way helped to shape and reaffirm a national culture that rewards
individual effort and accomplishment. Immigrants and their descendants have
proved they are productive workers, trustworthy neighbors, and patriotic
citizens, whatever their ethnic origins, thereby making individual behavior,
not background, the standard by which most Americans continue to judge others.23
Immigrants
have also demonstrated the viability of collective organization for mutual
progress. Transplanted communities of Chinese, Japanese, Asian Indians, Greeks,
Jews, and Lebanese in different parts of the nation employed similar forms of
cultural solidarity to promote group economic progress.24 Networks
of kinship and communalism have been the foundation of their ability to build
communities. Immigrant ethnic groups have thus exemplified the formation of
social capital—that set of social connections and social assets that promote
positive collaborative endeavor. They brought with them norms of reciprocity
and networks of civic engagement.25
Immigrants
have furthered the evolution of a society based on achieved status, voluntary
identity, and free association. And what ethnic groups developed in common
through mutual activity became more important than what made them different.
The opportunities of liberal democracy released the innate talents and drive of
immigrants. In the twentieth century, immigrants from Europe, Asia, the Middle
East, Africa, the Pacific, and the Western Hemisphere all contributed to
economic and social progress.
In the
final analysis, the vitality of America’s assimilative pluralism limited the
ability of policy makers and opinion makers to consign immigrants to permanent
compartments. Race, especially, proved an inadequate “container” for ethnic
Americans whose core identities continued to shift and expand as employment,
levels of educational attainment, marriage and other social patterns, consumer
tastes, and places of residence changed. In the era of industrialization,
European immigrants were once divided into “The Races of Europe,” but racial
classifications such as “Southern Italians” and “Hebrews” (actually used by
federal immigration agencies from the 1890s to the 1940s) became practically
meaningless after two or three generations. The classification of the newest
global immigrants as disadvantaged racial minorities labeled African, Hispanic,
and Asian and Pacific American suffers from a similar inadequacy; these
categories fail to capture the fluid character of an individual’s social
identity and social status, which makes the dichotomy “people of color” versus “white”
much too simplistic. The historian Donna Gabaccia has noted:
In
American eyes immigrants of Asian, African, or Native American descent become
Americans by becoming racial minorities. Recently arriving elite, well-educated
immigrants from the third world contemplate this road with much ambivalence.
Many prefer to become ethnic Americans—Korean Americans or Jamaican
Americans—rather than “blacks” or “Asian Americans.” 26
The
capacity for mobility and adaptation possessed by these newest immigrants will,
as Gabaccia points out, “fruitfully challenge American assumptions about class
and race.” As long as immigrant groups have an open society in which to create
new patterns, they will resist the petrifaction of ethnic boundaries into
racial boundaries.
Over
the course of the twentieth century, immigrants increased the power of such
assimilative factors as an expansive economy, an absorbent composite culture, a
fluid social structure, and a cosmopolitan democracy. And deeply woven patterns
of group intermixing immunized the society against ethnic and racial
fragmentation.Whether such assimilative patterns can be carried forward into
the twenty-first century will depend on the degree of public commitment to
America’s nationalizing and democratizing traditions. The successful
integration of current and future immigrants will require maintaining a
framework for ethnicity that encourages assimilative behavior within a
democratic, pluralistic context. Ethnic identities have coexisted with
acculturation, pluralism with assimilation, and differences with commonality.
That is the mix upon which individual opportunity will continue to depend.
Americans
who consider themselves liberal and progressive on ethnic questions often
embrace the notion that people must belong to separate groups and cultures. And
yet the idea that particular groups have a fixed culture and identity has
profound consequences for the future of democracy, especially when it is
manipulated by the forces of statism and modernization.
The
idea that culture and identity are possessed by unique groups encourages a
political language that homogenizes and reduces individuals into stereotypical
collective categories. Even more important, this sort of ethnic reductionism
leads to the dangerous position that in the realm of government only a Hispanic
legislator, for instance, can adequately represent Hispanic voters; an “Anglo”
inevitably speaks only for “Anglo” interests. Similarly, Asians are
disfranchised when a Hispanic is elected from the district in which they live.
This form of functional representation can bring more group solidarity, but at
a cost: the erosion of the freedom of individuals to define themselves and
their interests regardless of their social origins—a freedom fundamental to
liberal democracy.
The
drive to repackage people by labels and categories that can be publicly managed
is not a uniquely American phenomenon; it is well known in other countries with
historically less democratic polities. The University of Chicago political
scientists Susanne and Lloyd Rudolph see similar patterns in the United States
and India:
Which
identities become relevant for politics is not predetermined by some primordial
ancientness. They are crafted in benign and malignant ways in print and the
electronic media, in textbooks and advertising, in India’s T.V. megaseries and
America’s talk shows, in campaign strategies, in all the places and all the
ways that self and other, us and them, are represented in an expanding public
culture.27
In
spite of both the media and the state, which invent official groups, a new
diversity is forming in the United States in which ethnic particularism is
increasingly irrelevant. Deeply rooted universalizing and acculturating forces
are at work. As sociologist Orlando Patterson has argued, American culture is
not owned by any particular group:
Once
an element of culture becomes generalized under the impact of a universal
culture, it loses all specific symbolic value for the group which donated it.
It is a foolish Anglo-Saxon who boasts about “his” language today. English is a
child that no longer knows its mother, and cares even less to know her. It has
been adapted in a thousand ways to meet the special feelings, moods and
experiences of a thousand groups.28
“Ethnic
WASP culture is no longer the culture of the group of Americans we now call
WASP’s,” Patterson concluded. Jim Sleeper, who noted these insights by
Patterson in his book, The Closest of Strangers,
recalled how a stint teaching in a New York high school showed him that “the
Chinese-American students . . . were [not] interested in adopting ‘white’
culture as much as they were interested in becoming part of the larger ‘universal’
culture of constitutional democracy and technological development.” Immigrant minorities
today have a hard time not being affected by assimilation in the globalizing
democratic society that America has become.29
In a
plural society that aims to be democratic, people need to be free to mix and
blend with those outside their ethnic group. All change begins at the margins,
and the margins are where individuals can make new changes and choices a part
of their lives. Without this dimension of personal freedom, group boundaries
and identities tighten and become impassable. It is often today’s immigrants
who truly understand the value of American freedom. The journalist Richard
Brookhiser has reported that when a liberal “pol” tried to tell a Pakistani
immigrant cabdriver about the error of registering Republican, the “cabbie
defended his dislike of ethnic group politics. ‘I came here to get away from
it,’” he said.30
Those
who have seized the opportunity to leapfrog ethnic identities have become the
agents for a creative, open, and voluntary national life. Because of his
transcultural connections, Fiorello LaGuardia, mayor of New York City during
the Great Depression, gained legitimacy and popular support from a variety of
ethnic interest groups. Historian Arthur Mann provided an unforgettable glimpse
of LaGuardia:
Tammany
Hall may have been the first to exploit the vote-getting value of eating
gefullte fish with Jews, goulash with Hungarians, sauerbraten with Germans,
spaghetti with Italians, and so on indefinitely, but this unorthodox Republican
not only dined every bit as shrewdly but also spoke, according to the occasion,
in Yiddish, Hungarian, German, Italian, Serbian-Croatian, or plain New York
English. Half Jewish and half Italian, born in Greenwich Village yet raised in
Arizona, married first to a Catholic and then to a Lutheran but himself a Mason
and an Episcopalian, Fiorello LaGuardia was a Mr. BrotherhoodWeek all by
himself.31
In my
own explorations as a historian, I once stumbled upon a page from a 1911
federal immigration report that recorded the numbers of Albanians, Bosnians,
Herzegovinians, Serbs, and Croatians arriving in the United States. Almost a
century later, their descendants have assimilated and learned to coexist as
members of one American nation. In their homeland of former Yugoslavia, by
contrast, their countrymen reenact a tragic cycle of destructive ethnic
conflict and separatism. The historic American conditions of soft and open
group boundaries, once symbolized by the melting pot, ensured that, in this
country, southeast European minorities would not follow that path.
It is
a cliche´ to say that those who do not learn the lessons of history are doomed
to repeat its errors. But we should not forget that an American framework for
ethnicity that rests on the opportunity to assimilate in a pluralistic
democracy has proved to be highly effective in getting different people to live
and act together productively, on terms of equality and freedom.32 It is
an achievement with important and broad implications. In a time of global
ethnic strife, the United States more than ever can demonstrate to the world
that pluralism works and can work democratically.
Notes
1. See Richard
D. Alba, “Assimilation’s Quiet Tide,” Public Interest 119 (spring
1995): 4.
2. Nathan
Glazer, Affirmative Discrimination: Ethnic Inequality and Public Policy
(New York:
Basic Books, 1975), pp. 24–26; Donald L. Horowitz, “Immigration and
Group
Relations,” Immigrants in Two Democracies: French and American Experience
(New York: New
York University Press, 1992), pp. 23–25.
3. Olivier
Zunz, The Changing Face of Inequality: Urbanization, Industrial Development,
and Immigrants
in Detroit, 1880–1920 (Chicago: University of Chicago Press,
1982), chaps.
4, 7; Lizabeth Cohen, Making a New Deal: IndustrialWorkers in Chicago,
1919–1939 (Cambridge:
Cambridge University Press, 1990), chaps. 1–3; David Ward,
Cities and
Immigrants: A Geography of Change in Nineteenth-Century America (New
York: Oxford
University Press, 1971), chaps. 3, 4; Oscar Handlin, Boston’s
Immigrants:
A Study in
Acculturation, 1790–1880, rev. ed. (Cambridge, Mass.: Harvard University
Press, 1969),
chaps. 4–6; James R. Barrett,Work and Community in the Jungle: Chicago’s
PackinghouseWorkers,
1894–1922 (Urbana: University of Illinois Press, 1987), pp.
75–
76, 78–79.
4. John Higham,
Send
These to Me: Jews and Other Immigrants in Urban America
(New York:
Atheneum, 1975), pp. 18–20, 24–28; Sean Wilentz, “Sense and Sensitivity,”
New Republic, October 31,
1994, p. 46.
5. Oscar
Handlin and Mary Handlin, The Dimensions of Liberty (Cambridge,
Mass.: Harvard
University Press, 1961), p. 130.
6. William
Carlson Smith, Americans in Process: A Study of Our Citizens of Oriental
Ancestry (Ann Arbor,
Mich.: Edwards Brothers, 1937), p. 243.
7. Richard D.
Alba, Ethnic Identity: The Transformation of White America (New
Haven, Conn.:
Yale University Press, 1990), pp. 4–15.
8. Mary
C.Waters, Ethnic Options: Choosing Identities in America (Berkeley:
University
of California
Press, 1990), pp. 147–55.
9. Barry R.
Chiswick and Teresa A. Sullivan, “The New Immigrants,” in Reynolds
Farley, ed., State of the
Union: America in the 1990s, vol. 2, Social Trends (New York:
Russell Sage
Foundation, 1995), p. 238.
10. Alejandro
Portes and Ruben Rumbaut, Immigrant America: A Portrait (Berkeley:
University of
California Press, 1990), tables 28, 31, p. 208.
11. Lawrence H.
Fuchs, The American Kaleidoscope: Race, Ethnicity, and the Civic
Culture (Hanover, N.H.:
University Press of New England, 1990), p. 327.
12. Robert E.
Park, Race and Culture (Glencoe, Ill.: Free Press, 1950), pp. 116, 149,
151, 191–95.
13. Ruby Jo
Reeves Kennedy, “Single or Triple Melting Pot? Intermarriage Trends
in New Haven,
1870–1940,” American Journal of Sociology 49 (1944): 331–39; Will
Herberg, Protestant-Catholic-Jew
(Garden
City, N.Y.: Doubleday & Co., 1960; 1955),
pp. 32–34.
14. In 1990,
Richard D. Alba concluded that “the rising tide of intermarriage is also
sweeping across
religious lines,” thus showing that the triple melting pot theory “does
not seem to be
holding up.” Ethnic Identity, p. 14.
15. Alba
describes “the wide dispersion of ethnically mixed ancestry” as the most
profound ethnic
change among whites in the twentieth century. Ibid., pp. 15, 310–13.
16. U.S. Bureau
of the Census, “Characteristics of the Population by Ethnic Origin:
March 1972 and
1971,” Current Population Reports, P-20, no. 249 (Washington, D. C.:
Government
Printing Office, 1973); Higham, Send These to Me, pp. 9–11.
17. The
English, German, Irish, black, Italian, and French were the only larger
groups. U.S.
Bureau of the Census, Current Population Reports, Ancestry and Language
in the United
States: November 1979, series P-23, no. 116 (Washington, D.C.: U.S.
Government
Printing Office, 1982). Examining this data, sociologists Stanley Lieberson
and Mary Waters
saw the genesis of a “new American ethnic group” whose members
did not
identify with premigration antecedents; Stanley Lieberson and Mary C.Waters,
From Many
Strands: Ethnic and Racial Groups in Contemporary America (New York:
Russell Sage
Foundation, 1988), pp. 264–68. See also Harold J. Abramson, Ethnic
Diversity in
Catholic America (New York: Wiley & Sons, 1973), chap. 4.
18. U.S. Bureau
of the Census, Current Population Reports, Ancestry and Language
in the United
States: November 1979, p. 7; David A. Hollinger, Postethnic
America:
Beyond
Multiculturalism (New York: Basic Books, 1995), pp. 165–66.
19. Michaell S.
Teitelbaum and Jay Winter, A Question of Numbers: High Migration,
Low Fertility,
and the Politics of National Identity (New York: Hill & Wang, 1998),
p.
171; Stephan
Thernstrom, “One Drop Still—A Racialist’s Census,” National Review,
April 17, 2000,
pp. 35–37.
20. Roderick J.
Harrison and Claudette E. Bennett, “Racial and Ethnic Diversity,”
in Reynolds
Farley, ed., State of the Union: America in the 1990s, vol. 2, Social Trends
(New York: Russell
Sage Foundation, 1995), pp. 165–67.
21. U.S.
Immigration Commission, Abstracts of Reports, vol. 1–2
(Washington,
D.C.: U.S.
Government Printing Office, 1911); Oscar Handlin, Race and
Nationality in
American Life (Boston:
Little, Brown, 1957), chap. 5; Peter Brimelow, Alien Nation:
Common Sense
About America’s Immigration Disaster (New York: Random House,
1995).
22. See, e.g.,
Ellen Smith, “Strangers and Sojourners: The Jews of Colonial Boston”
and “‘Israelites
in Boston,’ 1840–1880,” in Jonathan D. Sarna and Ellen Smith, eds.,
The Jews of
Boston: Essays on the Occasion of the Centenary (1895–1995) of the Combined
Jewish
Philanthropies of Greater Boston (Boston: Combined Jewish
Philanthropies of
Greater Boston,
1995), pp. 44, 65.
23. David B.
Davis, “The Other Zion,” New Republic, April 12, 1993, pp. 29–36;
Francis
Fukuyama, “Immigrants and Family Values,” Commentary, May 1993, pp.
26–
32; John F.
Kennedy, A Nation of Immigrants, rev. ed. (New York: Harper &
Row,
1964), pp.
67–68.
24. The
argument that cultural capital operates as an independent variable is found
in Thomas
Sowell, Migrations and Cultures: A World Perspective (New York:
Basic
Books, 1996).
25. On this
point, see RobertD. Putnam, Making DemocracyWork: Civic Traditions
in Modern Italy (Princeton,
N.J.: Princeton University Press, 1993), pp. 167, 168–71;
Robert D.
Putnam, “The Strange Disappearance of Civic America,” American
Prospect,
winter 1996,
pp. 34–48.
26. Donna
Gabaccia, From the Other Side: Women, Gender, and Immigrant Life in
the United
States, 1820–1990 (Bloomington: Indiana University Press, 1994), p.
xvii.
27. Susan
Hoeber Rudolph and Lloyd I. Rudolph, “Modern Hate,” New Republic,
March 22, 1993,
pp. 24–29.
28. Orlando
Patterson, Ethnic Chauvinism: The Reactionary Impulse (New York:
Stein &
Day, 1977), pp. 149–50.
29. Jim
Sleeper, The Closest of Strangers: Liberalism and the Politics of Race in New
York (New York: W.
W. Norton, 1990), p. 234.
30. Richard
Brookhiser, “Melting Pot or Boiling Pot?” New York Observer, May 28,
1990, p. 5.
31. Arthur
Mann, LaGuardia: A Fighter Against His Times (Chicago:
University of
Chicago Press,
1959), p. 21.
32. Recent
arguments for the benefits of immigrant assimilation are Linda Chavez,
Out of the
Barrio: Toward a New Politics of Hispanic Assimilation (New York:
Basic
Books, 1992);
John J. Miller, The Unmaking of Americans: How Multiculturalism Has
Undermined the
Assimilation Ethic (New York: Free Press, 1998).
==============================
What Americans Think About Race and Ethnicity
EVERETT C. LADD
The United States faces two big challenges in ethnic
relations: moving to further eradicate the bitter racial legacy that began with
slavery and Jim Crow; and successfully assimilating into an increasingly diverse
American family millions of new immigrants, drawn heavily from Central and
South America, and Asia. Both areas have problems and tensions aplenty. Norman
Hill, president of the A. Philip Randolph Institute, has reminded readers of an
inescapable fact of American history—that African Americans are the only ethnic
group that was brought here against its will “as chattel,” and then faced
another century of institutionalized racism, known as Jim Crow.1 Even the wisest of subsequent policies could not have swept away this
tragic legacy, and U.S. policies on race over the last half century have often
not been the most enlightened.Onimmigration, this country’s fabled melting pot
has achieved extraordinary successes in making e
pluribus unum a substantial reality rather than a
pious wish. Still, each major wave of immigration has brought with it conflict
between newcomers and older, established groups. The present wave is no
exception. We know that problems still abound in ethnic relations. What we need
to know is how things are trending. How successful is the contemporary United
States in reducing ethnic-based animosity—in giving one of the country’s oldest
groups, African Americans, a surer sense of opportunity and progress, and its
own responsibility, and convincing new immigrants that the promise of American
life is for them and the future, not a thing of the past?
The
Debate over Racial Progress
Events in America’s race relations have periodicallyprompted fear that
we are losing ground. In the midst of the civil rights protests of the late
1960s, a presidential commission chaired by Illinois Governor Otto Kerner
concluded that the United States was “moving toward two societies, one black,
one white.”2 In 1995, following the
verdict in the O. J. Simpson case, a bevy of news magazines and commentators
concluded that the Commission’s prophecy had been realized. A huge literature
on American race relations has appeared in recent years, with authors offering
sharply divergent interpretations of whether data show a narrowing or a
widening of this largest-of-all ethnic divide. Andrew Hacker has forcefully
argued the “two societies” thesis; Stephan and Abigail Thernstrom have found great
progress in black-white relations and in the status of African Americans— much
more than is usually acknowledged.3
A
Lessening of the Divide
For more than two decades now, my colleagues and I at the Roper Center
for Public Opinion Research have been examining survey findings on ethnic
relations. These data show unequivocally that both African Americans and their
fellow citizens who are called whites see the country’s race relations in terms
far more complex and ambiguous than “two societies” envision them. As we would
expect, given their experience, those who are called blacks are much more
inclined than others to emphasize the problems racism has bequeathed. But they
now see comity along with conflict, opportunity as well as discrimination,
progress together with persisting difficulties. And like others, African
Americans find that the problems confronting their communities in the 1990s
have roots running far deeper than present discrimination and requiring new
solutions. For all the legacy of pain and anger, separation and name-calling,
stereotyping and oversimplification, many Americans see race relations today in
hues vastly more subtle than black and white. Let us look at the survey record.
The
Legacy of the Past
Because they have felt racism as others have not, African Americans
remain today more insistent on the assumption of national responsibility for
remedies. They are more inclined than any other group to back calls for
government efforts at remediation. Asked, for example, whether we are spending “too
much, too little, or about the right amount” on assistance to blacks,
two-thirds (65 percent) of African Americans told interviewers for the National
Opinion Research Center in 1996 that we’re spending too little, a position
taken by less than one-fifth (17 percent) of whites. A Gallup poll of early
1997 found whites by roughly two to one saying that government should not make
any special effort to help minorities because they should help themselves,
blacks by a virtually identical two-to-one majority saying that the national
government should make every effort to improve the position of blacks and other
minorities.
Though a majority of African Americans say that they have never personally
been denied a job or promotion because of their race, the proportion who claim
that they have (44 percent) is more than three times that of whites (13
percent; survey by ABC News and the Washington Post, March 16–19, 1998). It is not surprising, then, that blacks are much
more supportive than whites of affirmative action programs designed to give compensatory
preference to minorities. Hispanic Americans are more inclined to endorse affirmative
action than non-Hispanic whites but are significantly less so than blacks (Fig.
1).
Fig. 1. Opinions of affirmative action programs; survey by ABC News/
Question: Do you support or oppose: affirmative action programs
giving preference to women, blacks, and other minorities?
|
|
Support |
Oppose |
|
White |
40% |
56% |
|
Black |
86% |
12% |
|
Hispanic |
65% |
30% |
Washington
Post, August 1–5, 1996.
Beyond
Victimization
Yet if African Americans more than other groups see the need for special
federal remedial efforts, many in the community now reject the view that their
problems are primarily white inflicted. Asked in October 1995 in a Yankelovich
Partners survey for Time/CNN whether they think “the
problems that most blacks face are caused primarily by whites,” only 30 percent
of blacks (and 13 percent of whites) said they are. An NBC News/Wall
Street Journal poll conducted that same month found
only 25 percent of African Americans saying that the most important step in
improving race relations involves “white Americans doing more to recognize and
reduce racism by whites against blacks.”
Fig. 2A. Black attitudes and experience on discrimination; survey by
Yankelovich Partners, Inc., for Time/CNN, September 23–October 2, 1997.
Question: Which of the following statements do you agree with
most: (A) Black job applicants have to be better qualified than whites to get a
job; (B) Black job applicants have to be as qualified as whites to get a job;
(C) Black job applicants can get jobs even when they are less qualified than other
applicants?
|
|
Black teens |
Black adults |
|
A |
31% |
53% |
|
B |
38% |
29% |
|
C |
25% |
12% |
Question: Have you yourself ever been a victim of
discrimination because you are black?
|
|
Black teens |
Black adults |
|
Yes |
23% |
53% |
|
No |
77% |
45% |
Perhaps the most dramatic evidence of African Americans’ rejecting victimization
as a prime or sufficient explanation for their community’s problems comes from
surveys taken by Yankelovich Partners for Time and CNN in September 1997. Along with regular national samples of white
and black adults, the survey added special samples of teenagers. These studies show
dramatic generational changes, away from historical stereotypes of the
respective groups. For example, while a clear majority of black adults attribute
black Americans having worse jobs, income, and housing (compared with whites) “mainly
. . . to discrimination,” a solid majority of black teens reject this view
(Fig. 2A). This difference seems to result in large part from contrasting
generational experiences: whereas a slight majority of adult blacks said they
had been victims of racial discrimination, only one black teen in four said he
or she had been. Moreover, a large majority of adult blacks think most whites
consider blacks inferior, a majority of black teens do not think so.
Important generational shifts are also evident in the white population. A
large majority of white adults said that failure to take advantage of opportunities
is a greater problem for black Americans today than discrimination by whites.
Among teens it was reversed: a large plurality of white teenagers called
discrimination by whites the greater problem for black Americans (Fig. 2B).
The last chart in Figure 2 (Fig. 2C) confounds expectations about current
racial attitudes. All four groups—teens and adults—reject the idea that the
problems most black Americans face are caused primarily by whites. Black
teenagers are as inclined to this stance as are white adults. White teenagers
are more likely than black teenagers to attribute black Americans’ problems to
whites’ prejudice and discrimination. Over half of the black teens think
members of their community have worse jobs, income, and so on because “most
blacks don’t have the motivation or will to pull themselves up out of their
poverty”; only 24 percent of white teens take this view.
These extraordinary findings reflect a growing tendency on the part of both
groups, especially the young among them, to reject past racial stereotypes and
easy, self-serving answers. Both white and black teenagers seem to have moved
toward accepting their own group’s responsibility for racial problems, rather
than dismissing the problems as simply “their fault.”
Comity
and Opportunity
Few blacks or whites believe that a satisfactory state has been reached
in racial comity, but judgments are far from bleak. In a Gallup survey
conducted in June 1998, 59 percent of African Americans said that “only a few”
of their group dislike whites; 27 percent attributed that stance to “many”
African Americans, and only 5 percent to most. The responses were almost
identical when whites were asked to assess blacks’ feelings toward them. Only
20 percent of black respondents told Gallup interviewers in October 1995 that
they believe most white people “want to keep blacks down.”
Fig. 2B. Generational attitude of blacks and whites on questions of
discrimination; survey by Yankelovich Partners, Inc., for Time/CNN, September 23–October 2, 1997.
Question: In your view, which of the following is more of a
problem for black Americans today: (A) failure to take advantage of available
opportunities, or (B) discrimination by whites?
|
|
White teens |
White adults |
|
A |
31% |
52% |
|
B |
47% |
22% |
Question: On the average, black Americans have worse jobs,
income, and housing than white people. Do you think these differences are . . .
. . .
mainly due to discrimination?
|
|
Black teens |
Black adults |
|
Yes |
35% |
56% |
|
No |
56% |
30% |
. . .
mainly because most blacks don’t have the motivation or will power to pull
themselves up out of their poverty?
|
|
Black teens |
Black adults |
|
Yes |
52% |
44% |
|
No |
38% |
42% |
Many blacks see progress and greater opportunity. For example, in a survey
taken for the Washington Post in the summer of 1996,
although 45 percent of black respondents said that they have less opportunity
than whites to live a middle-class life, 44 percent said they have about the
same degree of opportunity, and 6 percent that they have even more. Sixty-five percent
of blacks, compared with 63 percent of whites, told interviewers for
theNational Opinion Research Center in the spring of 1996 that “people like me
and my family have a good chance of improving our standard of living.”
Fig. 2C. White responsibilities—blacks and whites compared; survey by
Yankelovich Partners, Inc., for Time/CNN, September 23–October 2, 1997.
Question: Do you think the problems that most black Americans
face are caused primarily by whites, or don’t you think this is the case?
|
|
Black teens |
Black adults |
White teens |
White adults |
|
Yes |
18% |
29% |
32% |
14% |
|
No |
74% |
61% |
55% |
72% |
Integration
and Shared Values
What is perhaps most striking in our survey findings is the increase in
the proportion of white and blacks alike reporting interaction with members of
the other group as friends and neighbors. For example, ABC News and the Washington
Post have asked whites on a number of occasions
since 1981, most recently in 1997, whether they know any African American whom
they consider a fairly close personal friend, and the counterpart question (for
African Americans) on white friends.We now report many more cross-group
friendships than we did a decade ago (Fig. 3). Similarly, surveys taken by the
National Opinion Research Center of the
Fig. 3. Cross-group friendships, 1981–1997; survey by ABC News/Washington
Post, latest that of June 5–8, 1997.
Question: (asked of blacks only) Do you yourself know any white person whom you consider a fairly close personal
friend?
Question: (asked of whites only) Do you yourself know any black person whom you consider a fairly close personal
friend?
(proportion
answer “Yes”)
|
|
Black |
White |
|
1981 |
69% |
54% |
|
1986 |
69% |
Not
asked of whites in this year. |
|
1989 |
80% |
66% |
|
1997 |
83% |
71% |
University of Chicago since the late 1970s show a fairly steady increase
in the proportion of whites reporting that they live in neighborhoods with blacks
(Fig. 4). The same NORC surveys show a big gain in support for open housing
laws—from 37 percent in 1978 supporting legislation that says “a homeowner
cannot refuse to sell to someone because of their race or color,” to 65 percent
backing it in 1996 (Fig. 5).
Fig. 4. Changes in neighborhood integration, 1978–1996; surveys by the
National Opinion Research Center-General Social Survey.
Question: Are there any [Negroes/blacks/African Americans]
living in this neighborhood now?
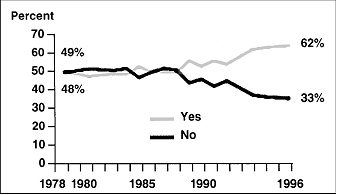
In a survey taken by Gallup in January and February 1997, only 24 percent
of white respondents said they would rather live in a neighborhood with white
families only; 61 percent said that if they could find the housing they wanted
they would rather live in a neighborhood that had both blacks and whites. In
the same study, just 7 percent of blacks opted for a neighborhood exclusively
black; 83 percent preferred one that was racially integrated. Such findings
need to be viewed cautiously and interpreted carefully. Saying one is committed
to integrated housing is now the only acceptable professed norm; some almost
certainly opt for it in polls who would not follow it in real life. But
professed norms are themselves important. The proportion of Americans living in
integrated neighborhoods is on the increase, in fact, and residential
integration as a norm has gained substantially.
Fig. 5. Attitudes toward open housing laws, 1978–1996; surveys by the
National Opinion Research Center-General Social Survey.
Question: Suppose there is a community-wide vote on the
general housing issue. There are two possible laws to vote on. Which law would
you vote for? (A) One law says that a homeowner can decide for himself whom to
sell his house to, even if he prefers not to sell to [Negroes/ blacks/African
Americans]. (B) The second law says that a homeowner cannot refuse to sell to
someone because of their race or color.
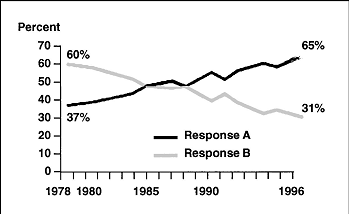
For all the bitter history of black-white relations in the U.S., the two
groups share the same underlying values. There is, then, a real base on which
to build better relations. Norman Hill of the A. Philip Randolph Institute
finds it remarkable “that blacks, who bear the legacy of slavery, segregation,
oppression, exclusion, and the daily indignities of racism are, in many ways,
the most resilient archetypal Americans, still holding on to the notion that
perseverance and hard work will give them a real shot at opportunity and
equality.”4 It is indeed remarkable,
though not, I think, surprising. There is broad ideological agreement across
the American people on such basic ideals as a distinctive understanding of
equality—pegged to opportunity rather than results—and a sense that the
American system, for all its faults, does much to extend opportunity. Asked,
for example, in a Los Angeles Times survey of October 1995 which statement is closer to their opinion, “In
the United States today, anyone who works hard enough can make it economically,”
or “No matter how hard you work you just can’t make it economically in this
country today,” a large majority of blacks took the “anyone can make it”
position. The proportion of whites taking that position was higher than that of
blacks, but only modestly so.
Immigration
and Changing Ethnic Backgrounds
Since its founding, the United States has grappled with vast problems
and inequities in black-white relations. But along with this enduring cleavage
there has been a series of shifting ethnic group conflicts and accommodations,
prompted by succeeding waves of immigration. The U.S. is highly diverse
ethnically, yet for all this heterogeneity, it is a nation, not just a collection of separate ethnic groups. It is hardly
surprising, given our need to create and maintain a nation on the lines e
pluribus unum describes, that we have periodically
worried about our ability to maintain and indeed enhance “one nation” status.
G. K. Chesterton described the continuing challenge in his brilliant opening
chapter of What I Saw in America.5 Chesterton wrote of “the
great American experiment; the experiment of a democracy of diverse races which
has been compared to a melting pot.” This experiment naturally puts great
pressure on the vessel: “That metaphor implies that the pot itself is of a
certain shape and a certain substance; a pretty solid substance. The melting
pot must not melt.” How well is the pot holding now, as a new century begins?
After a period of low immigration that followed a vast tightening of American
immigration law in the 1920s, legal immigration was again expanded in the
1960s. In recent years, too, substantial numbers of immigrants have entered the
country illegally. As a result, the foreign-born population of the U.S. has
climbed—from 5.4 percent in 1960 to 9.3 percent in 1996. And, far more than
their predecessors, recent immigrants have come from Latin America and from
Asia.
Worries about the impact of the new waves of immigration on national unity
and values should be greatly tempered by the fact that such concerns have
proved ill founded in previous periods, when rates of immigration relative to
the base population exceeded those of the present day. They should also be
greatly diminished, if not dismissed, by recent survey findings that show
newcomers to America committed to its values and confident of their chance to
succeed in their adopted home.
In mid-1995, Gallup surveyed a national cross-section of all adult Americans
and large samples of immigrants—including “most recent arrivals” who have been
in the U.S. ten years or less. The survey found that the immigrants closely
resemble the entire adult population on most matters of policy and values. For
example, 59 percent of all adults and 59 percent of immigrants (including 57
percent of the most recent arrivals) said national policy should encourage
immigrants “to blend into American culture by giving up some important aspects
of their own culture.” Only 32 percent of all adults and 26 percent of recent
immigrants favored encouraging immigrants “to maintain their own culture more
strongly.” The idea of the U.S. as a melting pot “in which people of different
cultures combine into a unified American culture” was endorsed by a full
threequarters of the immigrant population.
The Gallup survey found immigrants even more likely than other Americans
to see the country as a land of opportunity: 93 percent of the immigrants
surveyed agreed with the statement that “people who work hard to better
themselves can get ahead in this country,” the position of 85 percent of the
entire population. Immigrants overwhelmingly described the reception they
received upon arrival as welcoming—by margins of nine to one and better.6 Looking ahead, three immigrants in every four said they expect their
children to have even better economic opportunities in the U.S. than they
themselves have had, and that the children will face even less discrimination.
On such matters as the opportunity for themselves and their children to
find good jobs, the amount of political freedom, and the chances of being
treated fairly under the law, immigrants of all arrival times gave the U.S.
extraordinarily positive marks. Seventy-five percent of the immigrants called
the U.S. better than their homeland in the amount of political freedom; only 5
percent ranked it lower on this dimension than their place of birth. In two
areas, however—feeling safe from crime, and the moral tenor of the society—the
U.S. got quite low marks. Only 33 percent said the U.S. was better than their
homeland in realizing moral values; 48 percent ranked it lower.
What is most important, we see no signs in the survey findings of a serious
split between immigrant newcomers and longer-term residents. States like
California and Texas, which have experienced heavy immigration in recent years,
certainly have had conflicton issues like bilingual education. But in all
important regards this latest great wave of immigration to the United States
resembles the earlier ones. The bulk of the new immigrants seek integration
into their new nation and espouse its ideals.
Taking
Yes for the Answer
Societies sometimes find themselves inclined to resist good news.
Developments in ethnic relations in the United States are now a case in point.
It is not hard to see why the extent of the positive trends is resisted. Long-standing
tensions and prejudice, especially involving whites and blacks, have been the
unhappiest chapter in American historical experience. Stressing the positive
now may seem an attempt to gloss over past wrongs and minimize current needs.
Against the backdrop of problems as wrenching as those that have surrounded
race relations, no analyst wants to be cast in the role of Pollyanna.
Nonetheless, tensions in American ethnic relations have diminished in recent
decades. All the groups making up the American mosaic appear more positive and
optimistic today than they were when the civil rights revolution began. Set
against the standard of where we would like our society to be, the present mix
of ethnic group attitudes and relations leaves much ground to be covered. But
set against past experience—indeed that of any previous point since the country’s
founding—today’s ethnic relations manifest striking progress.
Notes
1.
Norman Hill, “Race in America—Through a Glass, Darkly,” Public
Perspective,
February/March
1996, pp. 1–4.
2.
National Advisory Commission on Civil Disorders, Report
(New York: Bantam,
1968),
p. 1.
3.
Andrew Hacker, TwoNations: Black and White, Separate, Hostile,
Unequal (New
York:
Scribner’s, 1992); Stephan Thernstrom and Abigail Thernstrom, America
in Black
and
White: One Nation, Indivisible (New York: Simon &
Schuster, 1997).
4.
Hill, p. 3.
5.
G. K. Chesterton, What I Saw in America (New
York: Dodd, Mead & Co., 1922;
repr.
1968, Da Capo Press).
6.
The survey reported on here was taken by the Gallup organization for CNN
and
USA Today, May 25–June 4, 1995.
==============================
Wrestling with Stigma
SHELBY
STEELE
This essay was
previously published as Part 1 of “Wrestling with Stigma” from A Dream
Deferred: The Second Betrayal of Black Freedom in America, by Shelby
Steele, copyright 1998 by Shelby Steele. It is reprinted here by
permission of HarperCollins Publishers, Inc.
I
have a white friend who has told me many times that he feels no racial
guilt despite the fact that he was raised in the Deep South before the end of
segregation. Though he grew up amid the inequality and moral duplicity of
segregation, and inevitably benefited from it as a white, he says simply that
he did not invent the institution. He experienced it as a fate he was born
into. And when segregation was finally challenged in the civil rights era, any
solidarity that he felt with other southern whites was grounded more in a sense
of pathos than in any resistance to change. So, he says, there is no “objective
basis” for racial guilt on his part.
Recently
I was surprised to hear the novelist William Styron, a southerner by birth and
upbringing, say on television that he, too, felt “no [white] guilt” despite the
fact that his grandmother had owned slaves as a girl. And there was something
emphatic, even challenging in his pronouncement that discouraged questioning.
For as long as I can remember, I have heard white Americans of every background
make this Pronouncement.
This
is certainly understandable. White guilt threatens the credibility of
everything whites say and do regarding race. Specifically it threatens them
with what I have called ulteriorality—the suspicion that their racial stands do
not come from their announced motivations but from ulterior ones driven by
guilt.We can say, for example, that the white liberal bends over backward
because he is motivated by guilt even though he says he is motivated by true
concern. Or we can say the anger of the “angry white male” is simply his way of
denying guilt.We can use guilt to discredit every position whites take on racial
matters. So it is not surprising to hear so many reflexive denials. When people
like my friend or Styron do this, they are disclaiming ulterior motives. They
want us to accept that they mean exactly what they say.
But I,
for one, very rarely do accept this, or at least not without a glimpse past
their words to the matter of ulterior motive. This is because there simply is
no social issue in American life more driven by ulterior forces than race. One
reason for this is that white American motivation in racial matters has gone
largely unexamined, except to attribute support for policies like affirmative
action to white goodwill and nonsupport to white racism. “White guilt” is
almost a generic term referring to any ulterior white motivation. But the degree
of ulteriorality in American race relations is far too great to be explained
entirely by guilt. I think the great unacknowledged event of the civil rights
era was that white Americans became a stigmatized group. I also believe that
our entire national culture of racial and social reform—the policies, programs,
norms, and protocols by which we address race-related problems—has been shaped
more by the stigmatization of whites than by any other factor, including the
actual needs of blacks.
Ironically,
it was the idea of equality that brought stigma to whites. In the civil rights
era, when white America finally accepted a legal equality that would extend to
different races, it also accepted an idea that shamed it. For three centuries
white America had used race to defeat equality. It had indulged in self-serving
notions of white supremacy, had transgressed the highest principles of the
democracy, and had enforced inequality on others while possessing the ideas to
know better.The American racial shame is special in that slavery and
segregation were knowing indulgences. The nation’s first president had
denounced the institution of slavery and freed his own slaves, yet it would
take two more centuries for segregation to be outlawed. An evil strung out over
the centuries and conducted in a full knowledge of itself.
America’s
new commitment to equality in the civil rights era brought with it an
accountability for all this. What no one could have foreseen was that a great
shaming of white Americans and American institutions was a condition of greater
racial equality. In a sense the new embrace of equality floated the nation’s
racial shame, unanchored it, so that it rose to the surface of American life as
a truth that the nation would have to answer for. As a result equality in the
United States has depended on a vigilance that associates this racial shame
with whites and American institutions. This association, of course, is the
basis of white stigmatization.
In
this way the idea of equality has established a social framework in which white
Americans are no longer “universal” people or “Everyman” Americans. Today there
is a consciousness that whites are a specific people, a group with a history, a
fate, and a stigma like other groups. So far equality has worked by bringing
whites down into stigma rather than by lifting lacks and other minorities up
out of it. The morality implied in equality stigmatized whites as racist and
thus gave them a group identity that they are accountable to in the eyes of
others even if they reject its terms. Very often the strongest group identities
form in response to stigmatization because stigmas are a kind of fate, a shared
and inescapable experience. In any case the history of white racism, the idea
of equality, the stigma created by these two things, and the need to wrestle
with this stigma as the way back to decency—all this gave white Americans a new
post-sixties identity that was not universal. In the way that blacks had been
stigmatized as inferior, whites, too, became a group marked by a human
incompleteness.
As
black Americans know only too well, to be stigmatized is to be drawn into a
Sisyphean struggle for redemption from the accusation carried by the stigma. It
is also to lose some of one’s freedom to the judgment, opinion, or prejudice of
others. White Americans now know what it is like to be presumed racist and to
have that presumption count as fact against them. What blacks know is that one
group’s stigma is another group’s power. Stigmatized as inferior, blacks were
deprived by whites of freedom itself. Now stigmatized as racists, whites can
easily be extorted by blacks for countless concessions. So, when a group fights
against its stigma, it is also fighting for its freedom from the power of
another group.
Being
white in America has always meant being free from racial stigma, as if “whiteness”
might be defined as simply the absence of stigma. Until recently we never had
stigmatizing epithets for whites of any real power. “Honky” hardly compared to
the visceral “nigger.” (Today the term “racist” is quite effective against
whites, but this is a post-sixties phenomenon.) This absence of stigma was
always the blessing of being white in the United States, while color, even “one
drop,” was a stigma in itself that defined all who carried it as alienated “others.”
In America whites have been the “it,” not the “other,” so they have always had
a rather myopic view of race as essentially a problem of “others.”
One of
the best-selling books on race during my youth was a book called Black Like Me by a
white man, John Howard Griffin, who had chemically darkened his skin and
traveled the South passing for black. What made the book sensational was that a
white man had volunteered for the black stigma, the experience of the alienated
other. But it was little more than a novelty book that put off many blacks
because its very premise tended to mistake the black stigma for the entire
black experience. The reader, whom the narrator presumed to be white, was
invited to watch one of his or her own in the land of the “other.” And the
black “other” was shown to endure little melodramas of man’s inhumanity to man
at which the “good” white reader could be appropriately aghast. This began an
age when white America was invited not to see black life but to be aghast at
it. However, the book’s greater sin was to suggest that even if whites were morally
obligated to support equality, race was still a problem that affected others.
But
equality finally gave whites their own racial otherness. The idea of democratic
equality—explicitly applied beyond even the boundary of race by the 1964 Civil
Rights Bill—showed white Americans as a group to have betrayed the nation’s
best democratic principles. Even though it was the white embrace of these
principles that brought the civil rights victories, it was the need to embrace
them in the middle of the twentieth century that proved the white betrayal of
them. And this profoundly injured the legitimacy of whites as a group in
relation to principles of any kind. They had used race to give themselves
license from principle.
Of
course, the fact of a group finding a pretext for violating its own principles
was hardly new. What is new is for an oppressive group to embrace equality at
the expense of its own moral legitimacy so that it has to live with those it
once oppressed without the moral authority to enforce the society’s best
principles. This situation, this fate, comprises the “otherness” of white
America today. It is alienating to live with this stigmatic association with
shame, and to have lost standing in relation to the principles one was raised
to cherish, to watch the institutions of one’s society— from the family to the
public schools—weaken for want of demanding principles, and to be without the
necessary authority to restore them, to lose “universality,” to have one’s
angry former victim define social morality, to feel both a little guilty and
falsely accused, to feel pressured toward a fashionable relativism as toward
racial decency itself—all this and more has come to whites as an experience of “otherness”
that I believe is the unexamined source of U.S. racial policy since the
sixties. The idea of racial equality has given a new and unique contour to the
white American experience. Perhaps a White Like Me is now
called for, a book that looks into the world behind the white stigma and
reports back to us.
One
point such a book would no doubt make is that stigmas are often double binds.
The stigma of whites as racists mandates that they redeem the nation from its
racist history but then weakens their authority to enforce the very democratic
principles that true redemption would require. And this is no small problem,
because the United States is no better than its principles. It may be the first
country in the world to have principles and ideas for an identity.
The
promise of the American democracy was that freedom, and the discipline of
principles that supports it, would be the salvation of humanity. This
discipline would replace the atavistic power of divine kings and feudalism with
a power grounded in reason. Principle would be not only the soul of America but
also the basis of its very legitimacy as a nation among nations. The principles
of freedom were the case for a new nation. And yet race is always an atavistic
source of power, going back to a primordial source, back to the natural order.
Like a divine or natural right, it comes from God or nature and presumes that
one’s race is free to dominate other races by an authority beyond reason. The
white racist believes that God made whites superior so that even a democracy
grounded in principle and reason is not obligated to include blacks and other
races. Atavistic power always oppresses because it is immune to reason and principle.
The great ambition of democracy was precisely to free man from atavistic power
through a discipline of principle that would forbid it. I say all this to make
the point that white racism was no small thing. It was a primitivism, a return
to atavistic power, and, most important, a flaunting of the precept that
America was founded on: that the freedom of man depended on a discipline of
fragile and abstract ideas and principles.
White
racism made America illegitimate by its own terms, not a new nation after all,
but an “old world” nation that used God as an excuse for its oppression and
exploitation, a pretender to reason and civilization. So what happens today
when a white American leader, even of the stature and popular appeal of a
Ronald Reagan, questions affirmative action on grounds of principle? The Reagan
administration, famous for its disbelief in racial preferences, refused to
challenge these policies because even this extremely popular president lacked
the moral authority as a white to enforce the nation’s very best
principles—advancement by merit, a single standard of excellence, individual
rather than group rights, and the rest. Not only have white Americans been
stigmatized as betrayers of principle, but also those principles themselves
have been stigmatized by their association with white duplicity.
Here
were whites exclaiming the sacredness of individual rights while they used the
atavism of race to deny those rights to blacks. They celebrated merit as the
most egalitarian form of advancement, yet made sure that no amount of merit
would enable blacks to advance. Therefore these principles themselves came to
be seen as part of the machinery of white supremacy, as instruments of
duplicity that whites could use to “exclude” blacks. The terrible effect of
this was the demonization of America’s best principles as they applied to
racial reform.
This
situation, I believe, has given post-sixties racial reform its most stunning
irony: Because difficult principles are themselves stigmatized as the demonic
instruments of racism, white Americans and American institutions have had to
betray the nation’s best principles in racial reform in order to win back their
own moral authority. For some thirty years now white redemption has required
setting aside the very discipline of principles that has elsewhere made America
great.
If not
principles, then what? The answer in a word is deference. Stigmatized as
racist, whites and American institutions have no moral authority over the
problems they try to solve through race-related reform. They cannot address a
problem like inner-city poverty by saying that government assistance will only
follow a show of such timeless American principles as self-reliance, hard work,
moral responsibility, sacrifice, and initiative—all now stigmatized as demonic
principles that “blame the victims” and cruelly deny the helplessness imposed
on them by a heritage of oppression. Instead their racial reform must replace
principle with deference. It must show white American authority deferring to
the nation’s racial tragedy out of remorse. And this remorse must be seen to
supersede commitment to principles. In fact, any preoccupation with principles
can only be read as a failure of remorse. “Caring,” “compassion,” “feeling,”
and “empathy” must be seen to displace principles in public policy around race.
But
deference should not be read as an abdication of white American authority to
black American authority. American institutions do not let blacks, in the name
of their oppressive history, walk in the front door and set policy. It is
important to remember that these institutions are trying to redeem their
authority, not abdicate it. Their motivation is to fend off the stigma that
weakens their moral authority. So deference is first of all in the interest of
white moral authority, not black uplift. Certainly there may be genuine remorse
behind it, but the deference itself serves only the moral authority of American
institutions.
And
this deference is always a grant of license—relief from the sacrifice, struggle,
responsibility, and morality of those demanding principles that healthy
communities entirely depend on. And virtually all race-related reform since the
sixties has been defined by deference. This reform never raises expectations
for blacks with true accountability, never requires that they actually develop
as Americans, and absolutely never blames blacks when they don’t develop. It
always asks less of blacks and exempts them from the expectations, standards,
principles, and challenges that are considered demanding but necessary for the
development of competence and character in others. Deferential
reform—everything from welfare to affirmative action to multiculturalism—is the
license to be spared the rigors of development. And at its heart is a faith in
an odd sort of magic—that the license that excuses people from development is
the best thing for their development.
Nowhere
in the ancient or modern world—except in the most banal utopian writing—is
there the idea that people will become self-sufficient if they are given a
lifetime income that is slightly better than subsistence with no requirement
either to work or to educate themselves. Nowhere is there the idea that young
girls should be subsidized for having children out of wedlock, with more money
for more children. And yet this is precisely the form of welfare that came out
of the sixties—welfare as a license not to develop. Out of deference this
policy literally set up incentives that all but mandated inner-city inertia,
that destroyed the normal human relationship to work and family, and that
turned the values of hard work, sacrifice, and delayed gratification into a
fool’s game.
Deferential
policies transform black difficulties into excuses for license. The deferential
policy maker looks at the black teen pregnancy problem with remorse because
this is what puts him on the path to redemption. But this same remorse leads
him to be satisfied by his own capacity to feel empathy, rather than by the
teenage girl’s achievement of a higher moral standard. So he sets up a nice
center for new mothers at her high school, thereby advertising to other girls
that they too will be supported—and therefore licensed—in having babies of
their own. Soon this center is full, and in the continuing spirit of remorse,
he solicits funds to expand the facility. It was not Joblessness that bred the
black underclass; it was thirtyfive years of deference.
Deferential
policies have also injured the most privileged generation of black Americans in
history. Black students from families with incomes above seventy thousand
dollars a year score lower on the SAT than white students from families with
incomes of less than ten thousand a year. When the University of California was
forced to drop race-based affirmative action, a study was done to see if a
needs-based policy would bring in a similar number of blacks. What they quickly
discovered is that the needsbased approach only brought in more high-achieving
but poor whites and Asians. In other words, the top quartile of black American
students—often from two-parent families with six-figure incomes and
private-school educations— is frequently not competitive with whites and Asians
even from lower quartiles. But it is precisely this top quartile of black
students that has been most aggressively pursued for the last thirty years with
affirmativeaction preferences. Infusing the atmosphere of their education from
early childhood is not the idea that they will have to steel themselves to face
stiff competition but that they will receive a racial preference, that
mediocrity will win for them what only excellence wins for others.
Out of
deference, elite universities have offered the license not to compete to the
most privileged segment of black youth, precisely the segment that has no
excuse for not competing. Affirmative action is protectionism for the best and
brightest from black America. And because blacks are given spaces they have not
won by competition, whites and especially Asians have had to compete all the
harder for their spots. So we end up with the effect we always get with
deferential reforms: an incentive to black weakness relative to others.
Educators who adamantly support affirmative action—the very
institutionalization of low expectations—profess confusion about the
performance gap between privileged blacks and others. And they profess this
confusion even as they make a moral mission of handing out the rewards of
excellence for mediocre black performance.
A
welfare of license for the poor and an affirmative action of license for the
best and brightest—the perfect incentives for inertia in the former and
mediocrity in the latter. But this should not be surprising. Because “racial
problems” have been a pretext for looking at blacks rather than at whites, we
have missed the fact that most racial reforms were conceived as deferential
opportunities for whites rather than as developmental opportunities for blacks.
Because
deference is a grant of license to set aside demanding principles, it opens the
door to the same atavistic powers—race, ethnicity, and gender—that caused oppression
in the first place. Again, the United States was founded on the insight that
freedom required atavisms to be contained by a discipline of principles. The
doctrine that separates church from state is an example. And race, ethnicity,
and gender are like religion in that they arise from a different authority than
the state. They come from fate, or some would say from God, and so are
antithetical to democracy, which comes from an agreement among men to live by a
social contract in which no single race can be validated without diminishing
all others.
But
thirty-some years of deferential social policies that work by relieving us of
principle have joined atavisms to the state as valid sources of power. (This
also happened recently in Eastern Europe, where the unifying principles of
Communism collapsed so that the atavisms of tribe, clan, and religion surged
back as valid sources of power and entitlement. War has been the all too
frequent result.)Aquick look at America’s campuses reveals what I have elsewhere
called a “new sovereignty,” in which each minority carves out a sovereign
territory and identity based on the atavisms of race, ethnicity, and gender.
And this new atavistic sovereignty supersedes the nation’s sovereignty and
flaunts its democratic principles. One is a black or a woman before one is an
American.
It is
no accident that preferential affirmative action became the model for racial
and social reform after America’s great loss of moral authority in the sixties.
Affirmative action is an atavistic model of reform that legalizes the use of
atavisms in place of principles right in the middle of a democracy. In this way
it mimics the infamous Jim Crow laws that also legalized the atavism of race
over democratic principles. In Jim Crow, white supremacy was the motivation; in
affirmative action it was deference. The first indulgence in atavisms so wiped
out white moral authority that it made the second indulgence inevitable.
To
take all this a step further, liberal whites and American institutions also
shifted the locus of social virtue itself from principles to atavisms. Since the
sixties, social virtuousness has lost its connection to difficult and raceless principles
and become little more than a fashionable tolerance for atavisms. Of course
tolerance of different races, ethnicities, and genders is virtuous. But moving
out of a spirit of deference, white liberals and American institutions have
asked that these atavisms be tolerated as legalized currencies of power. This
is how the virtue of tolerance becomes a corruption of democratic fairness—you
don’t merely accept people of different races; you validate their race or
ethnicity as a currency of power and entitlement over others.
This
is the perversion of social virtue that gave us a multiculturalism that has
nothing to do with culture. The goal of America’s highly politicized multiculturalism
is to create an atavistic form of citizenship—a citizenship of preferential
status in which race, ethnicity, and gender are linked to historic
victimization to justify entitlements unavailable to other citizens. Culture is
a pretext, a cover. The trick of this multiculturalism is to pass off atavisms
as if they were culture. So people think they are being “tolerant” of “cultural
diversity” when, in fact, they are supporting pure racial power.
In
fact multiculturalism actually suppresses America’s rich cultural variety,
because much actual culture does not mesh with victimization. A troublesome
implication of jazz, for example, is that blacks are irrepressible because they
created one of the world’s great art forms in the midst of oppression. It is
images of helplessness that highlight their racial atavism as a source of
entitlement. So the black cultural genius for self-invention and improvisation
that made jazz possible are not drawn out and celebrated in multiculturalism.
Nor are the many other cultural ingenuities—psychological, social, and
political—by which blacks managed to live fully human lives despite their hard
fate. Culture gets in the way of multiculturalism.
But
multiculturalism is the kind of thing that happens when a democracy loses the
moral authority to protect the individual citizen as the only inviolate unit of
rights. In any society atavisms can only be repressed, never entirely
extinguished. They are always waiting for the opportunity to wedge themselves
into the life of society under some high-sounding and urgent guise. No one
invents the moral mask better than those driven to have their race, ethnicity,
or gender bring them a preference over others— whether white segregationists or
minority supporters of affirmative action. And when the majority of a society
is stigmatized for past betrayal of principles, and when those principles
themselves are emblems of duplicity, then primitive atavisms easily present
themselves as salvation itself. Multiculturalism masks a bid for pure atavistic
power; it is an assault on democracy that Americans entertain because they feel
they must. It was conceived not to spread culture but to win some of the
territory opened up by the weakened moral authority of American institutions.
==============================
PART TWO — PRIVATE LIVES AND PUBLIC POLICIES
Residential Segregation Trends
WILLIAM
A. V. CLARK
Ethnic
and racial segregation has declined substantially from the 1960s when the
Kerner Commission Report suggested that the United States was “moving toward
two societies, one black, one white— separate and unequal.” Decade by decade,
residential integration has increased, and it will probably continue to do so.
Of course, this does not mean that segregation has vanished or that housing
discrimination has been eliminated, but it does indicate that there has been
impressive racial progress in the past three decades.
Seventy
years ago, the Chicago school of urban sociology studied the changing
residential map of European newcomers who had flooded into cities on the East
Coast and in the Middle West. Later, with the influx of African Americans from
the South into northern cities, the focus of research shifted to blacks and
whites. Today, scholars look beyond black and white, as urban America has
become multiethnic and, once again, residential patterns have changed. In fact,
two dozen cities now have no majority ethnic or racial group, and the number
will grow with continuing immigration.
The
changing economic status of members of racial and ethnic groups alters
residential patterns, and the evidence from national and selective regional
studies indicates that segregation is declining, especially for the more affluent.
Yet the residential choices people make inevitably will result in a certain
degree of continuing racial and ethnic clustering—a phenomenon that should not
be confused with discrimination. For instance, Koreans have gravitated toward
certain high-status California suburbs; newly wealthy Asian Indians have chosen
to live in certain neighborhoods in Silicon Valley; and Armenians are
concentrated in the Glendale region of Los Angeles. Do such patterns suggest
unequal residential access? In reality, the residential mosaic is shaped in
part by a combination of economic forces and group preferences, and it is
simplistic to assume the driving force to be clearly racial animus.
Changing
Patterns of Residential Segregation
Residential
integration has increased in the past forty years. The changes were slow at
first, but the Civil Rights Act of 1964 and subsequent fair housing laws
accelerated the process. A standard way of measuring the level of residential
segregation is to use what is called the index of dissimilarity, which ranges
from a high of 100 (total segregation) to a low of zero (members of racial and
ethnic groups randomly distributed). Thus, each census tract (a largish
neighborhood of about 4,000 to 6,000 people) in a city with an index of zero would
perfectly mirror the racial and ethnic makeup of the larger community.
Table
1 looks at selected cities in the period 1960–1990. In cities in which the
minority population is predominantly African American, the index of
dissimilarity has dropped from the high 80s to the high 70s; where other
minorities are also present, the decline has been considerably greater. Other
data from the 1980s confirm this general picture of increased integration, especially
in southern and western metropolitan areas with significant new housing
construction.1
Table
1 Housing Segregation in the Twenty-one Largest Cities with Over 50,000 Blacks
index
of dissimilarity a
|
City |
1960 |
1970 |
1980 |
1990 |
|
Mostly Black Minority |
|
|
|
|
|
Chicago |
93 |
93 |
90 |
86 |
|
Philadelphia |
87 |
84 |
85 |
84 |
|
Detroit |
84 |
82 |
84 |
86 |
|
Washington,
D.C. |
80 |
79 |
77 |
76 |
|
Boston |
84 |
84 |
79 |
73 |
|
Atlanta |
89 |
88 |
80 |
81 |
|
St.
Louis |
90 |
90 |
76 |
74 |
|
Baltimore |
90 |
89 |
82 |
80 |
|
Pittsburgh |
85 |
86 |
79 |
77 |
|
Cleveland |
91 |
90 |
88 |
85 |
|
Newark |
72 |
76 |
79 |
79 |
|
Kansas
City, Mo. |
91 |
90 |
83 |
76 |
|
Cincinnati |
89 |
84 |
79 |
75 |
|
Milwaukee |
88 |
88 |
81 |
79 |
|
averages |
87 |
86 |
82 |
79 |
|
Black and Hispanic |
|
|
|
|
|
Los
Angeles |
82 |
90 |
78 |
66 |
|
Houston |
94 |
93 |
79 |
66 |
|
Dallas |
95 |
96 |
81 |
63 |
|
Oakland |
73 |
70 |
71 |
63 |
|
Tampa |
94 |
92 |
76 |
65 |
|
Miami |
98 |
92 |
81 |
74 |
|
San
Francisco |
69 |
75 |
65 |
61 |
|
averages |
86 |
87 |
76 |
65 |
source:
David
Armor and William A. V. Clark, “Housing Segregation and School Desegregation,”
in David Armor, Forced Justice: School Desegregation and the Law (New York:
Oxford University Press, 1995), p. 128.
a For 1960 and
1970 the index is for cities and for whites versus blacks. For 1980 and 1990
the index is for counties and for nonblacks versus blacks.
In
Southern California, for example, in many suburban counties outside Los
Angeles, indexes of dissimilarity are in the mid-30s. The number of Hispanics,
African Americans, and Asians is increasing steadily.2 Thus, though
Orange County may still be viewed as a conservative Republican bastion, by 1990
only a little more than 30 percent of the neighborhoods (census tracts) were
over 80 percent non-Hispanic white. Diversity in general had increased
dramatically—a picture that squares with the work of scholars who stress the
gains brought in recent decades by the drive to reduce discrimination.
The
change in the status of blacks is particularly striking. As late as 1970, rich
and poor blacks were equally likely to be segregated from white households, but
today in Southern California, high-income black households live in highly
integrated neighborhoods. Families with incomes less than $10,000 remain in
areas with an index of dissimilarity close to 90, but the figure for those with
earnings above $60,000 is 40. The civil rights movement is now more than forty
years old, and the sustained attack on American racism has paid off.
In
1960 few African Americans lived in suburbia. By 1999 the number of African
Americans in the suburbs was about 10.9 million, more than 30 percent of the
total black population. Blacks are now about 8 percent of the total population
residing in suburbia, and the proportion will continue to increase with rising
black incomes. Moreover, increasingly, suburban middle-class blacks are almost
indistinguishable from whites with the same education and income.3
As the
racial gap in family income is further reduced, the level of residential
integration will rise. At the same time, it is important to note that the index
of dissimilarity is not likely to drop much below 30. Differences in wealth, in
neighborhood preferences, and in the structure of urban housing all work to
separate members of different racial and ethnic groups.
Residential
Patterns
Just
why racial and ethnic groups tend to cluster in separate residential areas is a
matter of ongoing and contentious debate.4 Some scholars stress the role of
discrimination and argue that income and housing costs play only a minor role
in the segregated residential patterns so evident in large metropolitan areas.5 But
there is also a substantial literature that emphasizes not only economic
factors but also the choices minorities make—that is, their preference for living
with members of their own group (and avoiding others).6
The
debate over the causes of residential separation is one aspect of the attempt
to understand the creation and modification of urban patterns over time. A
large literature has documented the role of socioeconomic and family status, as
well as ethnic characteristics in defining the ecology of the city.7 It is
certainly possible to identify and classify residential areas within cities on
the basis of such variables, and to some degree communities change as the
income, ethnicity, and composition of families within them shift. But the
intersection between class and race is also important. For instance, white
movement out of an inner-city neighborhood that has become heavily African
American and often overwhelmingly poor is central to understanding the
emergence of black urban concentrations and more affluent, predominantly white
suburbs.8 That classic pattern, however, will continue to
change as blacks and Hispanics move up the economic ladder.
Indeed,
some new evidence from Southern California suggests that income and education
may be more important than previously believed.9 Well-educated and higher-income
black households live in relatively integrated settings—a harbinger of the
future in other regions, it would seem (see Fig. 1). Survey data indicate that
changing social status, especially that generated by education, has an
important effect on the acceptance of “other race” residents in a neighborhood.10 At the
same time, however, lowincome households may be experiencing increased
segregation, a phenomenon consistent with the pessimism of scholars like Massey
and Denton, who write of hypersegregation in many cities.11
Fig.
1. Average segregation levels by education and income in 1970 and 1990;
William
A. V. Clark and Julian Wave, “Trends in Residential Integration by
Socio-Economic
Status in Southern California,” Urban Affairs Quarterly 32
(1997).
Education: Average
Segregation Score
|
|
10 urban areas (1970) |
Southern California (1990) |
|
0–8th |
88 |
73 |
|
Some HS |
87 |
70 |
|
HS Grad |
86 |
58 |
|
Some College |
85 |
50 |
|
College Grad |
84 |
49 |
Income (000’s): Average
Segregation Score
|
|
10 urban areas (1970) |
Southern California (1990) |
|
<5 |
87 |
76 |
|
5–10 |
89 |
70 |
|
10–14 |
88 |
72 |
|
15–20 |
87 |
59 |
|
20–24 |
86 |
57 |
|
25–40 |
86 |
53 |
|
40+ |
85 |
49 |
Self-selection
and group avoidance have also shaped the residential patterns of European
immigrant groups, and that process continues today. Preferences for particular
combinations of ethnic neighbors play an important role in the choices families
make. But the African American experience has been different from the European.
Whites and Asians have a stronger desire than do blacks and Hispanics for
neighborhoods of their own race; the ideal mix thus differs for the two groups,
and their separate preferences are not so easily reconciled (see Fig. 2). That
fact, too, is likely to perpetuate a certain degree of urban residential
separation for some time to come.12
Diverse
preferences, along with group differences in education and income, thus shape
the residential landscape, yet some scholars see prejudice as the basic
explanation for racial and ethnic clustering.13 If housing discrimination is indeed
still a major force, then changes in the socioeconomic status of blacks—and
even in racial attitudes—will not suffice to alter the basic picture. Several
studies that have used testers to determine the receptivity of landlords and
real estate agents to black families provide evidence that doors are still
closed.14 But surveys that ask households whether they have
actually experienced discrimination find relatively few respondents who answer
yes. The survey results suggest that the patterns of separation that we see in
our cities are more the result of economic differences among groups, and of
preferences for living in a neighborhood with people who are similar, than they
are of discrimination.15
Prospects
for Stable Integrated Neighborhoods
Fig.
2. Multiethnic racial preferences (choices of preferred combinations of
neighbors) for Los Angeles and Boston; Multi-City Study of Urban Inequality
1993–1994 (MCSUI).
Los Angeles: Percent of choices
|
|
Hispanic |
Black |
|
All Hispanic |
63 |
1 |
|
|
22 |
2 |
|
50/50
Hispanic/Black |
11 |
48 |
|
|
2 |
31 |
|
All Black |
3 |
18 |
|
|
White |
Black |
|
All White |
30 |
1 |
|
|
20 |
5 |
|
50/50 White/Black |
20 |
57 |
|
|
4 |
4 |
|
All Black |
2 |
2 |
Boston: Percent of choices
|
|
Hispanic |
Black |
|
All Hispanic |
26 |
2 |
|
|
43 |
4 |
|
50/50
Hispanic/Black |
24 |
39 |
|
|
1 |
22 |
|
All Black |
2 |
22 |
|
|
Asian |
Black |
|
All Asian |
15 |
5 |
|
|
57 |
8 |
|
50/50 Asian/Black |
25 |
50 |
|
|
7 |
18 |
|
All Black |
3 |
13 |
The
future of residential integration is bound up with the fundamental demographic
changes that are sweeping the nation. The new demography is particularly
apparent in California, New York, Florida, Arizona, and Texas—all entry-point
states for Hispanic and Asian immigrants. And even though the country is still
75 percent Anglo, several states, including California, as well as some
metropolitan areas, already have populations that are majority minority. Some
of the new immigrant groups stick together by choice, and in such a context
notions of segregation and separations become increasingly antiquated. In Los
Angeles, for example, the index of dissimilarity for Armenians is roughly 90,
which means almost total segregation. Several Asian groups (Cambodians,
Koreans, Vietnamese, for example) are also residentially concentrated.16
There
is thus intense clustering for some groups. But, at the same time, old patterns
of white flight from incoming African Americans appear to be changing. Overall
levels of separation may therefore be declining.17 On the other hand, stable racially
integrated communities are still unusual, and greater integration may simply be
the consequence of an influx of white Hispanics rather than of Anglos. Whites
and blacks may be living apart, but the arrival of Hispanics has integrated
neighborhoods that were formerly overwhelmingly one race—that is, black. The
change in the demographic makeup of the nation as a whole, in other words,
inevitably has an impact on living patterns.
The
two processes—increasing segregation and greater integration— are thus
occurring at the same time, although the latter is the stronger (if slower)
trend. The future remains unpredictable. As more blacks acquire middle-class
status, urban neighborhoods are more and more likely to become a mix of new
immigrants and African Americans. But it is also possible that very large scale
immigration could undermine the progress made over the past three decades.
Moreover, income separates people. The Kerner Report warned against two
nations, one black and one white; the real worry may be two societies, one poor
and the other affluent—living apart.
Observations
and Summary
Pessimists
argue that declines in segregation occur only where there are small numbers of
African American households, not in the places where most blacks live. And on
that basis they conclude that whites want only limited interracial contact. But
more affluent and more highly educated black families are clearly welcome in
suburban communities, and that fact suggests real change. Will that change be
sustained? It will take another decade before we know for certain. Already,
however, it is legitimate to ask whether urban concentrations of low-income
black households are the result primarily of prejudice or of income
constraints.
Notes
1. Reynolds
Farley and William Frey, “Changes in the Segregation of Whites from
Blacks During
the 1980s: Small Steps Toward a More Integrated Society,” American
Sociological
Review 59 (1994): 23–45.
2. William A.
V. Clark, “Residential Patterns, Avoidance, Assimilation, and Succession,”
in R. Waldinger
and M. Bozorgmehr, eds., Ethnic Los Angeles (New York:
Russell Sage
Foundation, 1996), pp. 109–38.
3. Joel
Garreau, Edge City: Life on the New Frontier (New York: Anchor Books,
1992); Richard
Morrill, “Racial Segregation and Class in a Liberal Metropolis,” Geographical
Analysis 27 (1995):
22–41.
4. William A.
V. Clark, “Residential Segregation in American Cities: A Review and
Interpretation,”
Population
Research and Policy Review 5 (1986): 95–127; William A.
V. Clark, “Residential
Segregation in American Cities: Common Ground and Differences
in
Interpretation,” Population Research and Policy Review 8 (1989): 193–97;
George Galster,
“Residential Segregation in American Cities: A Contrary Review,”
Population
Research and Policy Review 7 (1988): 113–21.
5. Nancy
Denton, “The Persistence of Segregation Links Between Residential Segregation
and School
Segregation,” Minnesota Law Review 80 (1996): 795–824; John
Farley, “Race
Still Matters: The Minimal Role of Income and Housing Cost as Causes
of Housing
Segregation in St. Louis, 1900,” Urban Affairs Review 3 (1995):
244–54.
6. David Armor
and William A. V. Clark, “Housing Segregation and School Desegregation,”
in David Armor,
Forced
Justice: School Desegregation and the Law (New
York: Oxford
University Press, 1995), pp. 117–53.
7. Brian Berry
and John Kasarda, Contemporary Urban Ecology (New York: Macmillan,
1979), provide
a review of the ecological background of the urban mosaic.
8. William
Frey, “Mover Destination Selectivity and the Changing Suburbanization
of Metropolitan
Whites and Blacks,” Demography 22 (1985): 223–43; William J.
Wilson, The Declining
Significance of Race: Blacks and Changing American Institutions
(Chicago:
University of Chicago Press, 1986).
9. William A.
V. Clark and Julian Ware, “Trends in Residential Integration by
Socio-Economic
Status in Southern California,” Urban Affairs Quarterly 32 (1997):
825–43.
10. Howard
Schuman, Charlotte Steeh, and Lawrence Bobo, Racial Attitudes in
America: Trends
and Interpretations (Cambridge, Mass.: Harvard University Press,
1985).
11. Douglas
Massey and Nancy Denton, American Apartheid (Cambridge,
Mass.:
Harvard
University Press, 1993).
12. William A.
V. Clark, “Residential Preferences and Neighborhood Racial Segregation:
A Test of the
Schelling Model,” Demography 28 (1991): 1–19; William A. V.
Clark, “Residential
Preferences and Residential Choices in a Multi-Ethnic Context,”
Demography30 (1992):
451–66; Schuman, Steeh, and Bobo, Racial Attitudes in America:
Trends and
Interpretations.
13. George
Galster and William Keeney, “Race, Residence, Discrimination and
Economic
Opportunities,” Urban Affairs Quarterly 24 (1988): 87–117.
14. See, e.g.,
John Yinger, Closed Doors, Opportunities Lost: The Continuing Costs of
Housing
Discrimination (New York: Russell Sage Foundation, 1995).
15. Armor and
Clark, “Housing Segregation and School Segregation,” p. 145.
16. James Allen
and Eugene Turner, The Ethnic Quilt: Population Diversity in
Southern
California (California State University, Northridge: Center
for Geographical
Studies, 1997).
17. Barrett Lee
and Peter Wood, “Is Neighborhood Social Succession, Place Specific?”
Demography 28 (1991):
21–40.
==============================
African American Marriage Patterns
DOUGLAS
J. BESHAROV and ANDREW WEST
In
1968, the Kerner Commission declared that the United States
was “moving toward two societies, one black, one white—separate and unequal.”1 Happily,
many of the Commission’s most distressing predictions have not come true. But
with respect to marriage and child rearing, black and white Americans do live
in substantially different worlds. Over the past fifty years, for all
Americans, marriage rates have declined while divorce rates and out-of-wedlock
births have climbed. But the negative changes have been greatest among African
Americans.
The
Decline of Marriage
NONMARRIAGE
Compared
with white women, African Americanwomenare 25 percent less likely ever to have
been married and about half as likely to be currently married. According to the
Census Bureau’s Current Population Survey (CPS), in 1998, about 29 percent of
African American women aged fifteen and over were married with a spouse
present, compared with about 55 percent of white women and 49 percent of
Hispanic women.2 African American women are estimated to spend only
half as long as white women married (22 percent vs. 44 percent of their lives).3
In the
1950s, after at least seventy years of rough parity, African American marriage
rates began to fall behind white rates. In 1950, the percentages of white and
African American women (aged fifteen and over) who were currently married were
roughly the same, 67 percent and 64 percent, respectively. By 1998, the
percentage of currently married white women had dropped by 13 percent to 58
percent. But the drop among African American women was 44 percent to 36
percent—more than three times larger.4 The declines for males were
parallel, 12 percent for white men, 36 percent for African American men.
Among
Hispanics, the decline in marriage rates appears to have been less steep, but
only because we have no information on Hispanics prior to 1970. From 1970 to
1998, the percentage of currently married Hispanic women dropped 13 percent,
from 64 percent to 56 percent (see Fig. 1).5
Even
more significant has been the sharp divergence in never-married rates. Between
1950 and 1998, the percentage of never-married white women aged fifteen and
over rose from 20 percent to 22 percent, a 10 percent rise. But the percentage
of never-married African Americanwomen about doubled, from 21 percent to 41
percent.6 For Hispanics, the data begin only in 1970; since
then, the percentage of Hispanic never-married women has risen from 24 percent
in 1970 to 29 percent in 1998, about a 21 percent rise.7
Later
marriage among African Americans accounts for only some of this difference. For
example, between 1950 and 1998, the percentage of never-married white women
aged forty and over actually fell from 9 percent to 5 percent, a 44 percent
drop. But the percentage of never-married African American women aged forty and
over rose by 200 percent, from 5 percent to 15 percent.8 (Thus,
even adjusting for age at first marriage, marriage rates decline after about
1970 for whites and 1960 for African Americans).9
Fig.
1. Marital trends, 1890–1998. Although the 1890 data have not been analyzed,
results from 1910 indicate that about 2 percent of black women classified as
widows in that year were actually never-married or divorced. See Samuel H.
Preston, Suet Lim, and S. Philip Morgan, “African-American Marriage in 1910:
Beneath the Surface of Census Data,” Demography 29
(February 1992): 1–15. Data for 1890–1990 from decennial census data for those
years; data for 1998 from Bureau of the Census, Marital Status
and Living Arrangements: March 1998, by Terry A. Lugailia (Washington,
D.C.: U.S. Government Printing Office, 1999), p. 1, table 1.
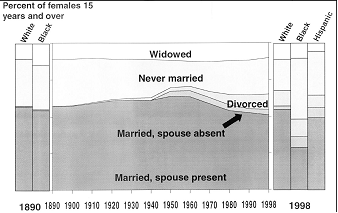
Among
Hispanics, there has been almost no change in the percentage of never-married
women. In 1970, about 7 percent of women forty and over were never married. By
1998, that figure had risen by only one percentage point.
DIVORCE
AND SEPARATION
At the
same time that African American women are half as likely to marry as whites,
they are more than twice as likely to divorce. Although African American
divorce rates have long been higher than those of whites, they are now more so.
For example, in 1890 (the first year for which national census data are
available) the number of divorced women per thousand married women was 45
percent higher for African Americans than for whites, 9 vs. 6.10 These
are relatively small numbers, but they suggest that even when families were on
the whole much stronger than they are today, African American women were still
much more likely to face marital disruption. These early divorce figures may
not be completely accurate, however.11
Not
only was divorce highly stigmatized before the 1960s, making it likely that
divorces were underreported in early census years, but also, as E. Franklin
Frazier pointed out sixty years ago, “divorces”among rural African Americans
were most likely informal agreements (between two married people or two people
living together) or the de facto result of long-standing separations.12 Thus,
it is likely that formal divorces among African Americans were much lower, and
perhaps much lower than among whites.
Regardless
of the reliability of earlier census data, however, the racial difference in
divorce is now quite large. By 1998, the African American divorce rate was more
than twice as high as the white rate (422 per thousand compared with 190 per
thousand). The divorce rate for Hispanic women doubled between 1970, the first
year for which data are available, and 1998, from 81 to 171 per thousand
(compared with a quadrupling of the African American rate and a tripling of the
white rate over the same time period).13
Separation
is about four times more common among African Americans than among whites and
about one and a half times more common than among Hispanics. In 1998, according
to CPS data, over 20 percent of married black women aged fifteen and over had
an absent spouse, compared with 5 percent of married white women and 13 percent
of married Hispanic women of the same ages.14 Some experts question whether the black
separation rate is really this high, speculating that black women consider the
breakup of a long-term cohabitation (an informal commonlaw marriage, if you
will) to be a “separation.”15
NONMARITAL
BIRTHS
Along
with the weakness of marriage, there has been an increase in nonmarital births,
especially among teenagers. Once again, African Americans have experienced the
greatest increases, although they have also been responsible for most of the
recent decline in both teen births and nonmarital teen births. According to
Larry Bumpass and Hsien-Hen Lu, an African American child is three times more
likely to be born out of wedlock than a white child and, on average, will spend
only six years in a two-parent family, compared with fourteen years for a white
child and thirteen years for a Hispanic child.16
The proportion
of births to unwed mothers has risen steadily since 1950, so that now almost
one-third of all American children are born out of wedlock (see Fig. 2). From
1950 to 1997, the proportion of births to unmarried white women (non-Hispanic)
increased almost twelvefold, from 2 percent to 22 percent. The African American
proportion increased fourfold, from 18 percent to a striking 69 percent. (The
African American rate could not have risen much more because it was already so
high.) The proportion of births to Hispanic unwed mothers has also increased by
5 percent between 1992 and 1997, rising from 39 percent to 41 percent.17
A
major factor driving these rates has been the decline in the birthrates for
married couples—rather than an explosion of births outside of marriage (Fig.
3). As Thernstrom and Thernstrom point out, “In 1987 the birth rate for married
black women actually fell below the birth rate for unmarried black women, the
first time that has ever happened for any ethnic group.”18
Among
white women, the overall fertility rate fell from 102.3 births per thousand
women aged fifteen to forty-four in 1950 to 63.9 in 1997. (At the same time,
the unwed fertility rate rose from 1.8 to 16.5, in part because there were many
fewer marriages.) Had the fertility rate of white married women remained at
102.3 (while the rate for white unwed women rose to 16.5), the proportion of
births in 1997 to unwed white mothers would be only 16 percent, not 26 percent.
Fig.
2. Nonmarital birthrates, 1940–1995, by race. Data on nonmarital birthrates for
white and black women 1950–1990 and for Hispanic women in 1980 from Department
of Health and Human Services, National Center for Health Statistics, Births to
Unmarried Mothers in the United States, 1980–92, by Stephanie
J. Ventura, Vital and Health Statistics, series 12, no. 53 (Hyattsville, Md.:
National Center for Health Statistics, 1995), p. 27, table 1; data on nonmarital
birthrates for white, black, and Hispanic women for 1995 from Department of
Health and Human Services, National Center for Health Statistics, Births: Final
Data for 1997, by Stephanie J. Ventura et al., National Vital
Statistics Report 47, no. 18 (Hyattsville, Md.: National Center for Health Statistics,
1999), p. 43, table 18.
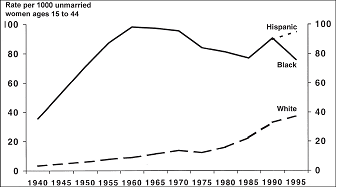
Similarly,
the fertility rate of married African American women fell from 137.3 per
thousand in 1950 to 70.7 in 1997 (Fig. 4). Had their fertility rate remained
the same, the percentage of African American children born out of wedlock in
1997 would have been 36 percent, not 69 percent.19 Unfortunately, data for Hispanic
out-of-wedlock births are not available for years earlier than 1989, making it
impossible to make the equivalent calculation for Hispanics.
Fig.
3. White fertility rates for married and unmarried women, 1940–1995. From
authors’ calculations based on data from Department of Health and Human
Services, National Center for Health Statistics, Births: Final
Data for 1997, by Stephanie J. Ventura et al., National Vital
Statistics Report, vol. 47, no. 18 (Hyattsville, Md.: National Center for
Health Statistics, 1999), p. 22, table 1; Department of Health and Human
Services, National Center for Health Statistics, Births to
Unmarried Mothers in the United States 1980–92, by Stephanie
J. Ventura, Vital and Health Statistics, series 12, no. 53 (Hyattsville, Md.:
National Center for Health Statistics, 1995), p. 35, table 4; data for 1995 taken
from Department of Health and Human Services, National Center for Health
Statistics, Report of Final Natality Statistics, 1995, by
Stephanie J. Ventura et al., Monthly Vital Statistics Report, vol. 45, no. 11,
supplement (Hyattsville, Md.: National Center for Health Statistics, 1997), p.
40, table 14.
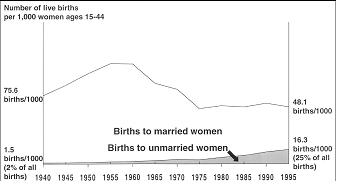
TEENAGE
BIRTHS
Having
a baby out of wedlock is difficult enough; having a baby as an unwed teenager
is even more difficult. One in five African American babies is born to a
teenage mother, about twice the white rate and one and a half times the
Hispanic rate. In 1996, about 22 percent of all live births to African
Americans were to women under age twenty, compared with just over 10 percent
for white women and 13 percent for Hispanic women.20
Fig.
4. Black fertility rates for married and unmarried women, 1940–1995. From
authors’ calculations based on data from Department of Health and Human Services,
National Center for Health Statistics, Births: Final Data for 1997, by
Stephanie J. Ventura et al., National Vital Statistics Report, vol. 47, no. 18
(Hyattsville, Md.: National Center for Health Statistics, 1999), p. 22, table
1; Department of Health and Human Services, National Center for Health Statistics,
Births
to Unmarried Mothers in the United States, 1980–92, by Stephanie
J. Ventura, Vital and Health Statistics, series 12, no. 53 (Hyattsville, Md.:
National Center for Health Statistics, 1995), p. 35, table 4; data for 1995 taken
from Department of Health and Human Services, National Center for Health
Statistics, Report of Final Natality Statistics, 1995, by
Stephanie J. Ventura et al., Monthly Vital Statistics Report, vol. 45, no. 11,
supplement (Hyattsville, Md.: National Center for Health Statistics, 1997), p.
40, table 14.
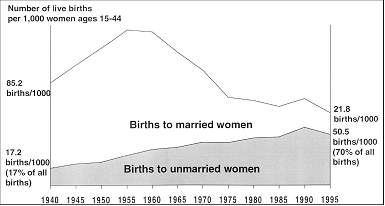
Over
the past forty years, the overall teenage birthrate first rose and then
declined. Throughout, though, there were sharp racial and ethnic differences.
According to theNational Center for Health Statistics (NCHS), the birthrate for
females aged fifteen to nineteen peaked in 1960, at 79.4 per thousand for
whites and 156.1 for African Americans. The rates then declined until 1985 or
1986, when the white rate hit 42.3 and the African American rate 94.1.21 The
rates continued to rise for a few more years and began declining again in 1992
to their 1997 levels of 36 for whites and 91 for African Americans.22 Among
Hispanics, the teen birthrate rose from 100.8 per thousand in 1989 to a 1994
peak of 107.7 per thousand. The birthrate for Hispanic teens has since declined
to 97.4 per thousand in 1997.23
For
those concerned only about too early parenthood, the recent decline in teenage
parenthood is good news. But out-of-wedlock birthrates are still at 1975
levels. More important, the decline is largely driven by the sharp drop in
teenage marriage (so that there are fewer married couples trying to have a
baby). This is, moreover, all teenage births, marital as well as nonmarital.
The trend for nonmarital teenage births, as opposed to marital births, is
sharply up. Almost all births to black teens are now out of wedlock. As overall
births to teenagers were falling, the proportion of out-of-wedlock teenage
births continued to rise because teens just don’t marry very much any more, but
many are still having babies. For African Americans, between 1950 and 1997, the
proportion of births to teenage unwed mothers rose from 36 percent to 96
percent, a 166 percent rise. For whites, the rise was steeper, almost
twelvefold (because the base was so much lower), 6 percent in 1950 to 71
percent in 1997. The proportion of Hispanic teenage unwed births rose by 71
percent from 1980 to 1997, from 42 percent of all teenage births to 72 percent
of all teenage births.24
RECENT
DECLINES
Recent
trends are much more hopeful. For the past few years, nonmarital births have
been declining. The rate for whites peaked in 1994 at 28.5 per thousand single
women and has declined slightly since then to 27 per thousand. The African
American rate has declined more sharply, following a 1989 peak of 90.7. It is
now 73.4. The rate for Hispanics reached its zenith in 1994 at 101.2 and has
also declined to 91.4.25 Since 1991, teen births are down 8 percent for
whites and 21 percent for African Americans.
Teenage
nonmarital births have declined even more, again most significantly for blacks.
Nonmarital birthrates for white teenagers peaked in 1994 at 28.1. Since then
the rate has declined to 25.9, an 8 percent decline, but this is not a large
enough drop to tell us what is happening. The rate for black teens, on the
other hand, dropped a substantial 20 percent, from a high of 108.5 in 1991 to
86.4 in 1997. The drop for Hispanics has been only slightly larger than for
whites. The rate of nonmarital births to Hispanic teenagers has fallen 9
percent, from a high of 82.6 in 1994 to 75.2 in 1997.26
Second-order
births are also declining, once again most significantly for African Americans.
Data from the NCHS indicate that, in 1992, the second-order or higher birthrate
for teens was 15.6 per thousand. In 1997, the rate had fallen by 27 percent to
11.4. In 1992, the rates by race had been 8.3 for white teens, 39.5 for African
American teens, and 28 for Hispanic teens. In 1997, the rates had fallen to
6.4, 25, and 23.5, respectively.27
A
Balanced Perspective
At
least since the appearance of Daniel Patrick Moynihan’s controversial 1965
report, The Negro Family: The Case for National Action, “the
plight of the black family” has been the focus of much anxiety and debate. On
the one side have been those who think the black family is a “tangle of
pathology,” to use Moynihan’s phrase.28 On the other side have been those
who see the black family as strong and vibrant, emphasizing its “adaptability,”
to use Belinda Tucker’s phrase.29
TERMINOLOGY
The
disagreement about the state of the black family is partly the result of
misunderstanding. The first side tends to use “family breakdown” primarily to
mean nonmarriage, divorce, and nonmarital childbearing. The other side tends to
use the term “family” more broadly, to include kin networks of parents,
grandparents, aunts, uncles, cousins, and so forth, that often help support
single mothers and their children and sometimes take them into their own homes.
In an attempt to bridge this disagreement, this paper seeks to make a clear
distinction between the breakdown of marriage, which it calls “marital
breakdown,” and the role of extended family structures, which, in all
communities, is more important when marriages are weaker.
Without
doubt, today’s unprecedentedly high rates of divorce and nonmarital
childbearing—across all American society and indeed in most other Western
nations—should be a matter of grave concern. Marital breakdown harms many of
the adults and children involved and, because of its disproportionate impact on
African Americans, is a particular tragedy in that community. Public discourse,
however, often goes too far in blaming marital breakdown for all the poverty
and social dysfunction that afflict the black community. That is an equally
terrible mistake because marital breakdown, poverty, and social dysfunction
interact. They are, simultaneously, both causes and effects of each other.
MARITAL
BREAKDOWN OR POVERTY?
At
first glance, marital breakdown has devastating effects on children, and to
African American children in particular because so many are born to unwed
teenagers. Children born out of wedlock fall substantially below children from
intact families on many important measures.30 A 1995 report to Congress from the
Department of Health and Human Services summarizes:
Unmarried
mothers are less likely to obtain prenatal care and more likely to have a low
birthweight baby. Young children in single-mother families tend to have lower
scores on verbal and math achievement tests. In middle childhood, children
raised by a single parent tend to receive lower grades, have more behavior
problems, and have higher rates of chronic health and psychiatric disorders.
Among adolescents and young adults, being raised in a single-mother family is
associated with elevated risks of teenage childbearing, high school dropout,
incarceration, and with being neither employed nor in school.31
According
to Robert Rector of the Heritage Foundation, data from the National
Longitudinal Survey of Youth (NLSY) show that children born out of wedlock to
never-married mothers spend 51 percent of their childhood in poverty, compared
with only 7 percent of children born to twoparent, married families. Such children
spend 71 percent of their childhood receiving some form of welfare (AFDC,
Medicaid, food stamps, WIC, or SSI), compared with 12 percent for children born
to two-parent, married families.32 The children of teenaged parents, especially if
unmarried, have even more serious problems. For example: “Children of young
teen mothers are almost three times as likely to be behind bars at some point
in their adolescence or early 20s as are the children of mothers who delayed
childbearing.” 33
Although
the children in female-headed households tend to do less well on various
measures, these are only correlations. Because family poverty and various other
characteristics are such important determinants of a child’s well-being and
life prospects, many children would not have fared well even if their parents
had been married or had waited until their twenties to have children.34 In
recent years, a number of researchers have attempted to disentangle the effects
of marital breakdown, poverty, and other personal and contextual factors.35 Doing
so substantially reduces the apparent effects of marital breakdown. For
example, when Sara McLanahan and Gary Sandefur analyzed Panel Study of Income
Dynamics (PSID) data, they found that young people from single-parent families
did substantially worse on a variety of measures:
Compared
with teenagers of who grow up with both parents at home, adolescents who have
lived apart from one of their parents during some period of childhood are twice
as likely to drop out of high school, twice as likely to have a child before
age twenty, and one and a half times as likely to be “idle”—out of school and
out of work—in their late teens and early twenties.36
Controlling
for income cuts these differences in half. The negative effects of growing up in
a single-parent family were still large—just not as large as some of our public
rhetoric would suggest.37 Thus, it is important to maintain a balanced
perspective on the consequences of “marital breakdown.” Although it is an
extremely serious problem, it is not the sole determinant of a person’s success
or happiness. In fact, as other contributors to this volume describe, on many
macro indicators of social and economic well-being, African Americans are doing
better than ever before. Gaps between whites and African Americans are getting
smaller, and in some cases African Americans are making gains relative to
whites. Most African Americans—including a majority of those who are unmarried,
or divorced, or even born out of wedlock—get up in the morning and go to work
or school, like everyone else. Marital breakdown makes things worse, not
hopeless.
WORLD-WIDE
TRENDS
As we
have seen, on every measure of marital stability, African Americans do more
poorly than whites and Hispanics. The weakness of African American marriages
is, however, more accurately viewed as an exacerbated version of the decline in
marriage across the entire postindustrial,Western world. Between 1960 to 1986,
mostWestern societies saw divorce rates rise and total birthrates fall while
unwed births rose (see Table 1).
The
most broadly accepted explanations for marital breakdown are essentially
race-blind: greater acceptance of nonmarital sex and unwed parenthood so that
young people feel less need to marry, widespread affluence so that it is easier
to leave an unhappy marriage, less emotional and economic gain from marriage so
that there is less reason to get married, and welfare’s marriage penalties that
discourage low-income couples from marrying.
Table
1 Worldwide Marital Weakness, 1960–1986/88
|
|
divorce rate |
|
birthrate |
|
unwed births (%) |
|
|
Country |
1960 |
1988 |
1960 |
1988 |
1960 |
1986 |
|
United
States |
9.4 |
21.2 |
3.6 |
2.1 |
5.3 |
23.4 |
|
Canada |
1.7 |
12.9 |
3.8 |
1.9 |
4.3 |
16.9 |
|
Austria |
5.0 |
2.7 |
1.6 |
13.0 |
21.0 |
|
|
Denmark |
6.0 |
12.8 |
2.5 |
1.6 |
7.8 |
43.9 |
|
Finland |
4.1 |
2.7 |
1.7 |
4.1 |
15.0 |
|
|
France |
2.8 |
8.5 |
2.7 |
2.0 |
6.1 |
24.0 |
|
Germany |
3.4 |
8.3 |
2.4 |
1.4 |
6.3 |
9.6 |
|
Italy |
1.1 |
2.4 |
1.4 |
2.4 |
5.6 |
|
|
Netherlands |
2.2 |
8.7 |
3.1 |
1.7 |
1.3 |
8.8 |
|
Norway |
2.8 |
2.9 |
2.0 |
7.0 |
24.0 |
|
|
Sweden |
4.9 |
10.7 |
2.2 |
1.9 |
11.3 |
48.4 |
|
United
Kingdom |
2.2 |
12.9 |
2.7 |
2.0 |
5.4 |
21.0 |
Source:
Sheila
B. Kamerman, “Gender Role and Family Structure Changes in the Advanced
IndustrializedWest:
Implications
for Social Policy,” in Katherine McFate, Roger Lawson, and William Julius
Wilson, eds., Poverty,
Inequality, and the Future of Social Policy:Western States in the NewWorld
Order
(New York:
Russell Sage Foundation, 1995), pp. 231–56.
African
Americans do seem especially vulnerable to these worldwide trends, however. As
Figure 5 indicates, nonmarital birthrates vary from a high of 72 percent for
American-born African Americans to a low of 4 percent for Korean Americans.
What can it be about African Americans— or their more than three centuries
living on this continent—that has made them so vulnerable to the forces that
weaken families? A number of factors seem to be at work: the devastating
effects of slavery and Jim Crow laws on black marriages; endemic poverty, which
puts added stress on already weak families; even fewer gains from marriage,
especially for women; too early sex that puts young girls at greater risk of
unwanted pregnancy; and racial concentration that magnifies the impact of these
conditions.38 This same set of explanations, with a few
modifications, helps explain what is happening to Hispanic marriages, which are
often included only as an afterthought in discussions about the family.
Although separate data on Hispanic marriages span only the last thirty years,
we do have enough information to make some preliminary conclusions.
Fig.
5. Nonmarital births by race-ethnicity, 1992–1997. Data for all ethnic groups
except Koreans and South Pacific Islanders from Department of Health and Human
Services, National Center for Health Statistics, Births: Final
Data for 1997, pp. 38–39, tables 13 and 14; data for Koreans and
South Pacific Islanders from Department of Health and Human Services, National
Center for Health Statistics, Birth Characteristics for Asian or
Pacific Islander Subgroups, 1992, by Joyce A. Martin, Monthly Vital
Statistics Report, vol. 43, no. 10, supplement (Hyattsville, Md.: 1995), p. 5,
table 4.
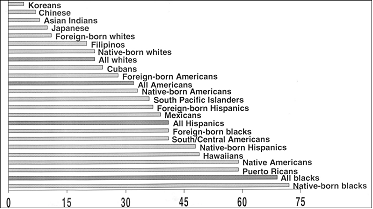
On
most indicators, Hispanic marriages lie somewhere between those of whites and
African Americans. This suggests that some of the same factors that affect
African Americans, such as endemic poverty, too early sex, and residential concentration,
also affect Hispanics. At the same time, the different cultural and historical
background of Hispanics appears to ameliorate some of the forces that
contribute to further marital weakness among African Americans.
The
overriding point is simple: The forces that weaken marriage strike all families,
albeit in different ways for different groups. The sooner we realize this
reality, the sooner progress will be made in strengthening all American
families, including African American families. This is not a message in black
and white, but perhaps it is a message for blacks and whites (and browns).
Notes
1. The National
Advisory Commission on Civil Disorders, Report of the National
Advisory
Commission on Civil Disorders (New York: Bantam, 1968), p. 1.
2. Bureau of
the Census, Marital Status and Living Arrangements: March 1998, by
Terry A.
Lugailia (Washington, D.C.: U.S. Government Printing Office, 1999), p. 1,
table 1.
3. Andrew J.
Cherlin, Marriage, Divorce, Remarriage, rev. and enlarged ed. (Cambridge,
Mass.: Harvard
University Press, 1992), p. 95. A similar estimate for Hispanic
women is not
available.
4. Data for
1950 from Bureau of the Census, Census of the Population: 1950, vol.
1, General
Population Characteristics (Washington, D.C.: U.S. Government Printing
Office, 1952),
p. 182, table 104. Data for 1998 from Bureau of the Census, Marital
Status, p. 1, table
1.
5. Data for
1970 from Bureau of the Census, 1970 Census of the Population, vol.
1, General
Population Characteristics (Washington, D.C.: U.S. Government Printing
Office, 1972),
p. 688, table 216. Data for 1998 from Bureau of the Census, Marital
Status, p. 1, table
1.
6. Data for
1950 from Bureau of the Census, Census of the Population: 1950, p.
182, table 104.
Data for 1998 from Bureau of the Census, Marital Status, p. 1, table
1.
7. Data for
1970 from Bureau of the Census, 1970 Census, p. 688, table
216. Data
for 1998 from
Bureau of the Census, Marital Status, p. 1, table 1.
8. Data for
1950 from Bureau of the Census, Census of the Population: 1950, p.
182, table 104.
Data for 1998 from Bureau of the Census, Marital Status, p. 1, table
1.
9. Marriage
rates for Hispanic women have been declining since the 1970s, but
lacking data
before 1970, we cannot determine when marriage rates among Hispanic
women began to
decline.
10. The divorce
rate presented here represents the number of currently divorced
women aged
fifteen and older per thousand married, spouse-present women. This rate
is different
from the standard rate used by the National Center for Health Statistics
(NCHS), which
is equal to the number of divorces decreed in a given year per thousand
married women
aged fifteen and over. There are three reasons for using the rate
presented here.
(1) the NCHS divorce rate is not available by race over time; (2) the
NCHS rate does
not control for the apparent higher rate of separation among African
American women;
(3) the rate used here, by focusing on divorced women as opposed
to the number
of divorces, avoids the problems (although admittedly small) created
by divorces
among interracial marriages. Data for 1890 from Bureau of the Census,
Census Reports:
Twelfth Census of the United States,Taken in the Year 1900(Washington,
D.C.: U.S.
Government Printing Office, 1901), p. lxxxvii, table 49. Data for 1998 from
Bureau of the
Census, Marital Status, p. 1, table 1.
11. The Census
Bureau has recognized the problem in the recording of divorces
and has in many
cases issued public statements cautioning that the number of divorced
persons is
underreported. See, e.g., Samuel H. Preston and John McDonald, “The
Incidence of
Divorce Within Cohorts of American Marriages Contracted Since the
CivilWar,” Demography 16 (February
1979): 1–25.
12. E. Franklin
Frazier, The Negro Family in the United States (Chicago: University
of Chicago
Press, 1939), chaps. 5 and 18, cited in Samuel H. Preston, Suet Lim, and S.
Philip Morgan, “African-American
Marriage in 1910: Beneath the Surface of Census
Data,” Demography 29 (February
1992): 10.
13. Data for
Hispanics in 1970 from Bureau of the Census, 1970 Census, p. 688,
table 216; data
for 1998 from Bureau of the Census, Marital Status, p. 1, table
1.
14. Data for
1998 from Bureau of the Census, Marital Status, p. 1, table
1.
15. See
Preston, Lim, and Morgan for a discussion of how data recorded by the
Census Bureau
may be inaccurate.
16. Dataon
likelihood of nonmarital births from Departmentof Health andHuman
Services,National
Center for Health Statistics, Births: Final Data for 1997, by Stephanie
J. Ventura et
al., National Vital Statistics Report, vol. 47, no. 18 (Hyattsville, Md.:
National Center
for Health Statistics, 1999), p. 42, table 17. Data on the number of
years a child
can expect to live with two parents correspond to the number of years
between birth
and age seventeen a child can expect to live in a home with two parents
(either married
or cohabiting); from Larry Bumpass and Hsien-Hen Lu, “Trends in
Cohabitation
and Implications for Children’s Family Contexts in the U.S.,” working
paper,
University of Wisconsin–Madison, Center for Demography and Ecology, 1999,
p. 36, table 6.
17. Data for
1950 from Departmentof Health andHumanServices,National Center
for Health
Statistics, Births to Unmarried Mothers in the United States, 1980–92, by
Stephanie
J.Ventura, Vital and Health Statistics, series 12, no. 53 (Hyattsville, Md.:
National Center
for Health Statistics, 1995), p. 40, table 5. Data for 1997 from Department
of Health and
Human Services, Births: Final Data for 1997, pp. 22, 28, 45,
tables 1, 6,
and 19.
18. Stephan
Thernstrom and Abigail Thernstrom, America in Black and White: One
Nation,
Indivisible (New York: Simon & Schuster, 1997), p. 240;
emphasis in original.
19. Authors’
calculations based on data from Department of Health and Human
Services, Births: Final
Data for 1997, p. 22, table 1; and Department of Health and
Human Services,
Births
to Unmarried Mothers, p. 35, table 4.
20. Department
of Health and Human Services, Births: Final Data for 1997, p. 39,
table 14.
21. Department
of Health and Human Services, Declines in Teenage Birth Rates,
1991–97:
National and State Patterns, by Stephanie J. Ventura, T. J. Mathews, and Sally
C. Curtin,
National Vital Statistics Report, vol. 47, no. 12 (Hyattsville, Md.: National
Center for
Health Statistics, 1999), p. 9, table 1.
22. Department
of Health and Human Services, Births: Final Data for 1997, p. 34,
table 9.
23. Department
of Health and Human Services, Declines in Teenage Birth Rates, p.
10, table 2.
24. Data for
1950 and 1980 from Kristin A. Moore et al., “Data on Teenage Childbearing
in the United
States” (prepared by Child Trends, Inc., for the American Enterprise
Institute/White
HouseWorking Seminar on Integrated Services for Children and
Families,Washington,
D.C., January 1993), p. 11, table 5. Data for 1997 from Department
of Health and
Human Services, Births: Final Data for 1997, p. 42, table 17.
25. Department
of Health and Human Services, Births: Final Data for 1997, p. 43,
table 18.
26. See note
24.
27. Data for
1992 from Departmentof Health andHumanServices,National Center
for Health
Statistics, Advance Report of Final Natality Statistics, 1992, by Stephanie
J.
Ventura et al.,
Monthly Vital Statistics Report, vol. 43, no. 5, suppl. (Hyattsville, Md.:
National Center
for Health Statistics, 1994), pp. 34, 41, tables 3 and 7. Data for 1997
from Department
of Health and Human Services, Births: Final Data for 1997, pp. 24,
32, tables 3
and 8.
28.
Departmentof Labor, Office of Planning andPolicy Research,The Negro
Family:
The Case for
National Action, by Daniel Patrick Moynihan (Washington, D.C.:
U.S.
Government
Printing Office, 1965), p. 75.
29. M. Belinda
Tucker, “Family,” in New Directions: African-Americans in a Diversifying
Nation, ed. James S.
Jackson (Washington, D.C.: National Policy Association,
forthcoming).
30. Sara McLanahan
and Gary Sandefur, Growing Up with a Single Parent: What
Hurts, What
Helps (Cambridge, Mass.: Harvard University Press, 1994).
31. Department
of Health and Human Services, National Center for Health Statistics,
“Nonmarital
Childbearing in the United States,” executive summary of Report to
Congress on
Out-of-Wedlock Childbearing (Hyattsville, Md.:National Center for Health
Statistics,
1995), p. xiii.
32. Robert
Rector, data presented at Welfare Reform Seminar Series sponsored by
the American
Enterprise Institute and the Brookings Institution, Washington, D.C.,
April 1999).
33. Rebecca A.
Maynard, “The Study, the Context, and the Findings in Brief,” in
Kids Having
Kids: Economic Costs and Social Consequences of Teen Pregnancy, ed.
Rebecca A.
Maynard (Washington, D.C.: Urban Institute Press, 1997), p. 16.
34. The impact
of poverty is complex, however. As Susan Mayer of the University
of Chicago
points out: “My review of the research suggests three major conclusions.
First, though
the effect of parental income is nowhere near as large as many political
liberals
imagine, neither is it zero, as many political conservatives seem to believe.
Second, though
the effect of parental income on any one outcome measure appears to
be fairly
small, higher income has some effect on most outcomes, so its cumulative
impact across
all outcomes may be substantial. Third, one reason that parental income
is not more
important to children’s outcomes is probably that government policies
have done a lot
to ensure that poor children get basic necessities most of the time.”
What Money Can’t
Buy: Family Income and Children’s Life Chances (Cambridge,
Mass.:
Harvard
University Press, 1997), p. 143.
35. The first
major work was Arline T. Geronimus and Sanders Korenman, “The
Socioeconomic
Consequences of Teen Childbearing Reconsidered,” Quarterly
Journal
of Economics 107 (November
1992): 1187–1214.
36. There was,
for example, a 10 percentage point difference between the high
school
graduation rates of children from two-parent families and children from
singleparent
families, 15
percent vs. 25 percent. They also found a 17 percentage point
difference in
teen birthrates, 14 percent for those from two-parent families compared
with 31 percent
for young women from single-parent families. There was also a 15
percentage
point difference in “idleness” rates for young women. About 26 percent of
young women
from two-parent families were out of school and out of work, compared
with 41 percent
of young women from single-parent families. Similarly, 19 percent of
young men from
two-parent families were idle, compared with 29 percent of young
men from
single-parent families. McLanahan and Sandefur, Growing Up with
a Single
Parent, pp. 2, 41,
47, 50.
37. Ibid., p.
89, fig. 10.
38. This is not
to say that other explanations have not been propounded. But such
explanations,
such as the existence of extensive kin networks and differing male-female
expectations
about marriage, do not appear strong enough to account for a substantial
share of
African American–white differences.
==============================
Crime
JAMES
Q. WILSON
A central
problem—perhaps the central
problem—in improving the relationship between white and black Americans is the difference
in racial crime rates. No matter how innocent or guilty a stranger may be, he
carries with him in public the burdens or benefits of his group identity. If
you are walking down a street alone at night and you encounter two men in
business suits, you are not frightened. If you encounter two teenage boys in blue
jeans, you may become a bit nervous. And if you encounter two teenage boys
wearing leather jackets and sporting Mohawk haircuts, you will probably be very
nervous. You know in advance that the appearance of these six males is no sure
guide to their behavior, but given the magnitude of the possible harm—perhaps a
sudden assault, possibly a serious injury—you assign a high value to what
little you can observe about them. And what you can observe is their group
identity.
Estimating
the crime rates of racial groups is, of course, difficult because we only know
the arrest rate. If police are more (or less) likely to arrest a criminal of a
given race, the arrest rate will overstate (or understate) the true crime rate.
To examine this problem, researchers have compared the rate at which criminal
victims report (in the National Crime Victimization Survey, or NCVS) the racial
identity of whoever robbed or assaulted them with the rate at which the police
arrest robbers or assaulters of different races. Regardless of whether the
victim is black or white, there are no significant differences between victim
reports and police arrests. This suggests that, though racism may exist in
policing (as in all other aspects of American life), racism cannot explain the
overall black arrest rate.1 The arrest rate, thus, is a reasonably good proxy
for the crime rate.
Black
men commit murders at a rate about eight times greater than that for white men.
This disparity is not new; it has existed for well over a century. When
historian Roger Lane studied murder rates in Philadelphia, he found that since
1839 the black rate has been much higher than the white rate.2 This
gap existed long before the invention of television, the wide distribution of
hand guns, or access to dangerous drugs (except for alcohol). America is a
violent nation. The estimated homicide rate in this country, excluding all
those committed by blacks, is over three times higher than the homicide rate
for the other six major industrial nations.3 But whatever causes white Americans
to kill other people, it causes black Americans to kill others at a much higher
rate.
Of
course the average African American male is not likely to kill anybody. During
the 1980s and early 1990s, fewer than one out of every 2,000 black men would
kill a person in any year, and most of their victims were other blacks. Though
for young black men homicide is the leading cause of death, the chances of the
average white person’s being killed by a black are very small. But the chances
of being hit by lightning are also very small, and yet we leave high ground
during a thunderstorm.
However
low the absolute risk, the relative risk—relative, that is, to the chances of
being killed by a white—is high, and this fact changes everything. When whites
walk down the street, they are more nervous when they encounter a black man
than when they encounter a white one. When blacks walk down the street, they
are more likely than whites to be stopped and questioned by a police officer.
It is important, of course, for whites to know that a chance encounter with a
black creates little risk and for police officers to know that they should have
more criteria than just skin color to decide who is worth questioning. Many
whites and many police officers know this, but in spite of what people know,
the racial tension persists. Countless white pedestrians have been worried by
the sight of a young black male, and countless innocent black men have had
their cars stopped or their walk interrupted by a suspicious cop. White
pedestrians may be embarrassed by their own caution; certainly black
pedestrians are upset by unwarranted police intrusions.
The
differences in the racial rates for property crimes, though smaller than those
for violent offenses, are still substantial. The estimated rate at which black
men commit burglary is three times higher than it is for white men; for rape,
it is five times higher.4
The
difference between blacks and whites with respect to crime, and especially
violent crime, has, I think, done more to impede racial amity than any other
factor. Pure racism—that is, a visceral dislike of another person because of
his skin color—has always existed. It is less common today than it once was,
but it persists and no doubt explains part of our racial standoff. But pure
racism once stigmatized other racial minorities who have today largely overcome
that burden. When I grew up in California, the Chinese and Japanese were not
only physically distinctive, but they were also viewed with deep suspicion by
whites. For many decades, Chinese testimony was not accepted in California
courts, an Alien Land Law discouraged Asian land purchases, the Chinese
Exclusion Act (not repealed until 1943) prevented Chinese immigration, and a
Gentlemen’s Agreement, signed in 1907, required Japan to cut back sharply on
passports issued to Japanese who wished to emigrate to California. When World War
II began, the Japanese were sent to relocation camps at great personal cost to
them. Yet today Californians of Asian ancestry are viewed by Caucasians with comfort
and even pride. In spite of their distinctive physical features, no one crosses
the street to avoid a Chinese or Japanese youth. One obvious reason is that
they have remarkably low crime rates.
The
black murder rate, though it is much higher than the rate for whites or Asians,
does not always change in the same way as the white rate. Between 1976 and
1991, the murder arrest rate for black males aged twenty-five and older fell
dramatically even though the murder arrest rate for the nation as a whole did
not change at all. Apparently, adult black men were becoming less violent.5 But in
some years, such as 1965 to the early 1970s, the black murder rate increased
much faster than the white rate. By the late 1960s the black rate was over
eighteen times higher than the white one.
Then,
beginning around 1975, the black rate declined while the white rate continued
to increase, so that the ratio of black arrests to white arrests fell to around
six to one. From 1980 until the present, the rate at which adult blacks and
whites are arrested for murder dropped more or less steadily. By contrast, the
rate at which black and white juveniles are arrested for murder increased
sharply from 1985 to the early 1990s, with the white rate almost doubling and
the black rate more than tripling. Starting in the mid-1990s, the juvenile rate
fell again, almost down to the level it was at in 1985.6 In
short, though the gap sometimes widens and sometimes narrows, white and black
homicide rates tend to remain different.
What
are we to make of all this? There are four possible responses. One is to deny
the facts, but this makes no sense to any objective observer. The high black
crime rate cannot be wished away by talk of racism, overarresting, excessive
punishment, or whites having allegedly drugged or armed blacks. A second
response is to admit the facts and say that people are behaving rationally.7 Of
course whites avoid blacks; of course police officers stop and question blacks.
What can you expect? Though it is true that this may be a rational response, it
comes at a very high price. Whites are fearful of living amid large numbers of
blacks and of sending their children to predominately black schools. Any hope
of residential or school integration is dealt a powerful blow by high black
crime rates. Moreover, blacks interpret the way they are treated on the streets
by white strangers and by police officers as a sign that they can never make
much social progress. “No matter what I do, I can never be regarded as
innocent,” many embittered black men will say. “I cannot hail a cab as easily
as a white, and I will be stopped and questioned by the police more than any
white. Integration is a joke.” Race matters, and race is unchangeable; hence,
race differences that put people at risk pose a difficult burden on almost
everyone.
A
third strategy, suggested by Professor Randall Kennedy, is to change police
practices so that they do not single out blacks for undue attention. He directs
our attention to a number of court cases that evaluate the legality of police
behavior that uses race as a proxy for dangerousness. In his summary, “Most
courts that have confronted the issue have authorized police to use race in
making decisions to question, stop, or detain persons so long as doing so is
reasonably related to efficient law enforcement and not deployed for purposes
of racial harassment.”8 Some state and federal judges have dissented from
this view, but it appears to be the leading one. Though in most areas of public
policy, the use of a racial test must pass the tough standard of “strict
scrutiny,” in police investigations a much lower standard is allowed.
To
deal with this problem, Kennedy proposes that the courts never, except in
extraordinary cases, sustain the use of race as a clue. Because this might lead
the police to ignore some forms of suspicious behavior, he suggests spending
more money on law enforcement so that it can be an equal burden for whites and
blacks. I am not entirely clear, however, how his proposal would work in practice.
Should the police question blacks no more often than they now question whites?
That raises the question of what, if any, would be the law enforcement losses
from abandoning the race proxy. Would there be more crimes? Fewer arrests?
Fewer solved crimes? We do not know; as far as I am aware, no information on
this subject exists. As an alternative, should the police question whites as
often as they now question blacks? How many more police would this require? Is
there much chance of hiring them?
If these
practical questions are resolved, more principled ones persist. Race is not the
only proxy for crime. So also are age and sex, and, like race, neither can be
changed by plan. If the courts impose their traditional strict scrutiny test on
police questioning of blacks, should they impose a similar test on questioning
young men (most of whom, like most blacks, are not offenders)?
Perhaps
the courts should adopt a tougher posture on the use of race as a proxy. If a
racial distinction is suspect and has to meet the test of strict scrutiny in
employment and contracting, there is a case for its meeting that test in police
behavior. But producing, by statute or court decision, this outcome will not be
easy. And if it can be achieved, it is not obvious that it will change much
behavior. Innocent people questioned by the police rarely go to court, and so
their complaints would rarely be heard whatever view the courts took. Police
practices might change little when the oversight mechanism is so weak. And many
police officers can easily find justifications other than race alone to support
street stops. (“A crime was reported in the neighborhood.” “The black man
attempted to flee.” “The black man resembled known suspects.”) Moreover,
restraining police behavior will have little effect, as Kennedy admits, on
private behavior. Taxicab drivers may still ignore black customers, and people
can still cross the street to avoid young black men. Neither residential nor
educational integration will be hastened by tighter rules on police conduct.
Schools and neighborhoods will still tend to become overwhelmingly white or
black.
The
fourth option is to find ways of driving down the high black crime rate. This
is a far more difficult task than passing laws, altering court rules, or raising
more money to support the police. Though there are programs that help reduce
the crime rate of people exposed to them, they have generally been small
demonstration programs that as yet have had no significant effect on society as
a whole.9 (This may change if and when the programs become
more generally applied.) The rate at which young black men were murdered
tripled between 1960 and 1990, and all this in spite of the government’s having
spent hundreds of billions of dollars on education, welfare, vocational
training, food stamps, and crime prevention programs. It is not hard to think
of reasons why many programs have failed to reduce crime. Character is formed
by families and reinforced by schools. If, as is the case, families have become
weaker and schools less effective, then no one should be surprised that
whatever was spent on new schools and social welfare has done little to
strengthen character.
Consider
families. Though for many years, some sociologists urged us to believe that
single-parent families were an “alternative” to two-parent ones, hardly anybody
believes that any more. The evidence shows that single-parent families are a
major source of misconduct. A federal survey of the families of sixty thousand
American children found that at every income level except the highest (over
$50,000 a year) and for whites, blacks, and Hispanics, children living with a
never-married or a divorced mother were much worse off than those living in
two-parent families.10 A survey of all the leading studies shows that both
poverty and living in a singleparent family contribute to children’s problems.11 When
William Comanor and Llad Phillips examined data in the National Longitudinal
Survey of Youth (NLSY), they found that “the most critical factor affecting the
prospect that a male youth will encounter the criminal justice system is the presence
of his father in the home.”12 Another look at the NLSY data suggests that African
American boys without fathers were 68 percent more likely to be in jail than
those with a father. Fatherless Latino boys were nearly three times as likely
to be in jail than those with fathers; fatherless white Anglo boys were over
four times as likely to be in jail than those with fathers.13
These
facts suggest that any effort to change a boy’s prospects must somehow
compensate for an absent father. Many of the crime-prevention programs that
have been most rigorously evaluated contain some form of this compensation. Big
Brothers–Big Sisters programs equip children with adult mentors, nurse home
visitation programs instruct single mothers on how to cope with children, and
multisystemic therapy programs try to improve family life. Not all successful
programs have these elements, and no one can be certain what it is about any
given program that makes it effective.
Compensating
for an absent father is no easy task. Some programs, led by a dedicated, highly
motivated staff, can make a difference. But whether what such talented staffs
do for 100 or 500 children can also be done by ordinary staffs for 100,000 or
500,000 remains to be seen. Scaling up prevention programs so that they reach
most of the families that can benefit from them is no easy matter. Happily,
some of these efforts are now being tried on a wider scale, and in time we
shall learn whether they can be effective on a broad scale.
But
the problems that these programs must tackle are not of recent origin. Since
the early 1960s there has been a dramatic increase in the number of children
living in single-parent families. In 1960 only 6 percent of white children
lived with one parent; by 1990 that number had more than tripled. For black
Americans, matters are much worse. The proportion of black children living with
only one parent rose from about 20 percent in 1960 to 53 percent in 1996. And
among black children in single-parent families, those who were living with a
mother who had never married rose from less than 10 percent in 1960 to nearly
58 percent in 1996.14
In
1965 Senator Daniel Patrick Moynihan pointed out these worrisome trends and
suggested that blacks suffered because so many of them were the product of
single-parent families. He was immediately attacked for having been wrong on
the facts and mistaken in their implications.15 Many writers said that blacks had
had two-parent families until they experienced economic disadvantage, after
which their families broke apart. In any event, single-parent families were
resilient alternatives to two-parent ones. We now know, however, that these
revisionist attacks on the Moynihan view were wrong.
Careful
studies of census data now make it clear that at least back to 1880, and
perhaps much earlier, black children were more than twice as likely to grow up
in a mother-only family than were white children.16 These differences were not the product
of blacks having suddenly moved from farms to cities or from the South to the
North, for they existed in both urban and rural locations and in all
geographical regions. The differences were universal, but their cause is not
well understood. One possibility is that slavery, by denying to blacks the
ordinary rites of marriage, destroyed the possibility of family life that had
already been powerfully undermined by the African capture and transatlantic
shipment of slaves. Another is that in Africa itself nuclear family ties were
weak. A third is that the combined effect of slavery and postslavery racism
produced this effect.
Whatever
the explanation, in the early 1960s differences that had long existed suddenly
exploded in magnitude. These new trends affected white as well as black
families, though the latter were hardest hit. What caused these trends is a
matter of dispute. Some believe the dramatic decline in family unity was the
result of the expansion of welfare payments, others that it was caused by the
decline in social stigma that attached to out-ofwedlock births, and still
others that it was the result of the growing inability of some men, especially
black men, to find jobs.
If
crime is to a significant degree caused by weak character; if weak character is
more likely among the children of unmarried mothers; if there are no fathers
who will help raise their children, acquire jobs, and protect their
neighborhoods; if boys become young men with no preparation for work; if school
achievement is regarded as a sign of having “sold out” to a dominant white
culture; if powerful gangs replace weak families—if all these things are true,
then the chances of reducing by plan and in the near future the crime rate of
low-income blacks are slim. In many cities there are programs, some public,
many private, that improve matters for some people. But the possibility that
these programs can overcome the immense burdens confronting poor, badly
educated, fatherless children is remote.
What,
then, is left? Only, I think, broad social and cultural changes as great as
those that caused our problem in the first place. Crime is not, happily, the
chief feature of African American life today. There has developed, along with a
black underclass, a large and growing black working class and a black middle
class. Black and white children now complete high school at the same rate.
Birthrates among black women, including teenagers, have fallen dramatically.
These changes are about what one would expect when the material condition of a
people improves. The principles on which these changes have occurred are
evident to most of the beneficiaries. They embody three old-fashioned rules:
Work hard, get an education, and get married before you have children. These
principles are so obvious to so many people that even American professors
cannot talk people into ignoring them.
They
are principles that most people learn from intuition and experience. They are
reinforced by churches and required by life. In the decades ahead, I hope that
the reach of these principles will grow and that more and more people learn
that the opposite rules—have fun, ignore school, and get sex for free—are, for
all but a few entertainers, recipes for disaster. But I also know that there
will be reversals. In bad times or when the culture takes an odd spin, fun,
drugs, gangs, and sex will appear more attractive. If my hope is correct,
economic growth will stimulate the elemental forces that shape human society to
reduce the size and power of any underclass, white or black. In many of our
large cities, after all, matters were much worse at the end of the nineteenth
century. Life in many parts of Chicago, New York, and San Francisco was
dominated by criminal gangs, corrupt police, quick tempers, and floods of
alcohol. At night you did not walk in the Five Points area of New York without
guards. Crime data are not available in any systematic way for these periods,
but the rates were, according to contemporaries, very high. Except for juvenile
crime, matters are, I think, much better today.
If
they continue to improve, the issue of police “profiling” black persons will
slowly disappear. In the long run, I think they will improve, but I confess
that my optimism rises and falls with changes in the crime rates. And in the
short run, the tension that irritates so many whites and angers so many blacks
will persist.
We can
do one thing: adopt rules that constrain police freedom to stop and question
people based on race alone. We can hope for another: the slow reduction in
black crime rates. Doing the first is relatively easy, but it will have little
effect. Achieving the second is harder and will take much longer, but it will
have a large effect. For the foreseeable future, we must accept small changes
with little results and hope for large changes with greater ones.
Notes
1. By estimated
crime rate, I mean the racial differences in arrest rates. For nondrug
crimes, these
arrest rates conform rather closely to the underlying crime rate as shown
by Alfred
Blumstein, “On the Racial Disproportionality of U.S. Prison Populations,”
Journal of
Criminal Law and Criminology 73 (1982): 1259–81, and Blumstein, “Racial
Disproportionality
of U.S. Prison Populations Revisited,” University of Colorado Law
Review 64 (1993):
743–60.
2. Roger Lane, Violent Death in
the City (Cambridge, Mass.: Harvard University
Press, 1979),
p. 113.
3. Randall
Kennedy, Race, Crime, and the Law (New York: Pantheon, 1997), p.
145.
4. These
estimates are from Franklin E. Zimiring and Gordon Hawkins, Crime Is
Not the Problem (New York:
Oxford University Press, 1998), p. 75.
5. Arnold
Barnett and Jesse Goranson, “Misapplication Reviews: Good News Is
No News?” Interfaces 26 (May–June
1996): 35–39.
6. These data
were kindly supplied to me by Professor Alfred Blumstein of Carnegie
Mellon
University.
7. On the
concept of “rational discrimination,” see Cass R. Sunstein, “Three Civil
Rights
Fallacies,” California Law Review 79 (1991): 751–74; Edmund Phelps, “The
Statistical
Theory of Racism and Sexism,” American Economic Review 62 (1972): 659–
61.
8. Kennedy, Race, Crime, and
the Law, p. 141.
9. For lucid
and scientifically careful summaries of the leading crime prevention
strategies, see
Delbert S. Elliot, ed., Blueprints for Violence Prevention (Boulder:
University
of Colorado
Center for the Study and Prevention of Violence, 1998). As of July
1998, ten
effective programs have been described in these reports.
10. Deborah A.
Dawson, “Family Structure and Children’s Health: United States,
1988,” Vital and Health
Statistics, series 10, no. 178 ( June 1991).
11. Sara
McLanahan and Gary Sandefur, Growing Up With a Single Parent: What
Hurts, What
Helps (Cambridge, Mass.: Harvard University Press, 1994).
12. William S.
Comanor and Llad Phillips, “The Impact of Income and Family
Structure on Delinquency,”
working paper in economics 7-95R, Department of Economics,
University of
California at Santa Barbara.
13. This
analysis of the NLSY data was done for me by Charles Murray (personal
communication).
14. 1998 Green Book, Committee on
Ways and Means, U.S. House of Representatives,
May 19, 1998,
pp. 1252–53.
15. The
Moynihan Report, as it was called, was The Negro Family: The Case for
National Action (Washington,
D.C.: U.S. Government Printing Office, 1965). The
debate it
engendered is analyzed in Lee Rainwaterand William L.Yancey, The Moynihan
Report and the
Politics of Controversy (Cambridge, Mass.: MIT Press, 1967).
16. Steven
Ruggles, “The Origins of the African-American Family Structure,”American
Sociological
Review 59 (1994): 136–51; Ruggles, “The Transformation of
American
Family
Structure,” American Historical Review 99 (1994): 103–28; S. Philip Morgan
et
al., “Racial
Differences in Household and Family Structure at the Turn of the Century,”
American Journal
of Sociology 98 (1993): 798–828.
==============================
Health and Medical Care
SALLY
SATEL
The medical
establishment is strongly supportive of racial preferences in
admission to medical school. The most active proponent is the Association of
American Medical Colleges; the American Medical Association, the federal
Council on Graduate Medical Education, and health philanthropies like the
Robert Wood Johnson Foundation advocate racial preferences as well. Their goal
is not necessarily to promote diversity for its own sake but to improve the
health of minority patients. Support for affirmative action programs has indeed
become a test of medical schools’ commitment to minority health. “This is not a
quota born out of a sense of equity or distribution of justice, but a principle
that the best health care may need to be delivered by those that fully
understand a cultural tradition,” said George Mitchell, the former Senate
majority leader and the chairman of the Pew Health Professions Commission.1
It is
now claimed that a mismatch in race between doctor and patient— especially when
the doctor is white and the patient is not—may be enough to trigger subtle, or
not so subtle, biases that result in second-rate medical treatment and poorer
health. In 1999 the U.S. Civil Rights Commission informed Congress that “racism
continues to infect” the health care system. 2 No less an authoritative voice than
the American Medical Association’s official newspaper has claimed that “a
growing body of research reports that racial discrepancy in health status can
be explained, at least in part, by racism and discrimination in the health care
system itself.”3 This is why, according to the Reverend Al Sharpton,
health will become the “new civil rights battlefront,” a prediction echoed by
other black leaders, including the Reverend Jesse Jackson and NAACP Chairman
Julian Bond.4 President Clinton himself has spoken of race and
health. “Nowhere are the divisions of race and ethnicity more sharply drawn
than in the health of our own people,” he said in a 1998 radio address
delivered during Black History Month. It is indeed true that black Americans
have higher infant mortality rates, more death from cancer, and lower life
expectancies than whites and Asians. But it is far less certain that one of the
possible explanations put forth by the president—”discrimination in the
delivery of health care services”—is accurate.5
Given
the history of systematic racial discrimination and segregation in the health
care system, residual bias seems, at first, plausible. Indeed, medicine, like
other institutions, once practiced overt discrimination. Black patients were
treated on separate and inferior hospital wards—a policy that persisted among
many hospitals in the Deep South until 1968. Black physicians were once
routinely barred from joining hospital staffs and medical societies and started
their own institutions to treat other blacks who were denied adequate care by
the white-controlled medical facilities.6 A particularly frightening episode
in medical research was the unethical Tuskegee Syphilis Study.
Decades
later, however, accusations of medical bias still linger. According to Vanessa
Northington Gamble, a physician and director of the Division of Community and
Minority Programs at the Association of American Medical Colleges, “Tuskegee
symbolizes for many African-Americans the racism that pervades American
institutions, including the medical profession.”7
But
the known facts suggest other interpretations of race-related differences (or “health
disparities”), and I shall present some of them here.
This
is not to minimize the facts of real discrepancies in access to care, certain
medical procedures (even with insurance coverage), and in disease rates
by race.8 But I intend to show that they cannot be
convincingly traced to bias against minority patients. My second aim is to look
critically at one program intended to help close the health gap: racial
preferences in medical school admissions.
Do
Physicians Treat Minority Patients Differently?
A
study in the New England Journal of Medicine in 1999 described differences in
treatment of lung cancer between black and white patientswho were beneficiaries
of Medicare insurance.9 In a careful analysis, Peter B. Bach and his
colleagues at Memorial Sloan-Kettering Cancer Center in New York City looked at
records of more than 10,000 patients who received diagnoses of operable lung
cancer. Seventy-seven percent of the white patients underwent surgery compared
with 64 percent of the blacks. Five years after diagnosis, only one-quarter of black
patients were still alive compred with one-third of whites.
What
accounted for the different rates of surgery? Did doctors not suggest the
treatment as often to their black patients, or did these patients more often
choose to forgo the recommendation for surgery? Were the black patients more
likely to have poor lung function, such as more carbon dioxide buildup, or
other problems that would have prohibited surgery or contributed to earlier
demise? Details like these would go a long way toward explaining why surgery
was never offered and why death rates differed, but those were not the
questions that Bach and his colleagues set out to answer.10 Indeed,
the authors specifically said they could not offer an explanation based on the
kinds of data they collected.
Other
physicians, however, were ready with hypotheses. “Possibly, physicians are
treating cancer patients not just based upon their illness and recommended
treatment, but on the basis of their race,” suggested Dr. Hugh Stallworth of
the American Cancer Society.11 Dr. Harold Freeman, a surgeon and president of
North General Hospital in Harlem, wondered whether white doctors might have
been more scrupulous in getting white patients to accept surgery. “If you [as a
doctor] were dealing with somebody who looked exactly like you, would you take
another step?” he asked.12 A more emphatic reaction greeted a report in the Annals of
Emergency Medicine that found that 74 percent of white patients with
fractures received pain medication compared with 57 percent of black patients.13 “I think
it’s racism, flat out,” said Dr. Lewis Goldfrank, director of emergency services
at Bellevue Hospital in New York City.14
Responses
like these would not surprise John Landsverk of Children’s Hospital in San
Diego. As he observed: “The usual implication of such disparities [in treatment
rates] is that the health care system is biased against persons of the ethnic
minority group and that the bias is likely to be found even in professional
clinicians’ perceptions of clinical problems and [referrals for] clinical
procedures.”15 In light of this, Landsverk was especially enthusiastic
about a study by a group of doctors at the University of Pittsburgh that found
no race-related differences in treatment of children with behavioral problems.16 Their
report appeared in the journal Medical Care one
month after Bach’s study, but it attracted no public attention. It should have;
it was “an important non-finding,” as Landsverk noted in an accompanying
editorial in the same journal. Not only did the Pittsburgh study include a very
large sample—almost 15,000 children treated in clinics across the country and
Canada—but also, most important, the researchers interviewed the parent and
doctor of every patient. The results: race and ethnicity of the
child had no relationship to clinician patterns in drug prescribing, referral,
or diagnosis of behavioral problems. The clinicians also spent slightly more time
with minority children than with their white counterparts.
This
handful of studies is emblematic of the challenges inherent in interpreting
health disparities research. First, the vast majority of treatment disparity
studies are what scientists call “retrospective.” That is, the raw data already
exist in hospital records, and researchers use them (in retrospect) when they
want to explore a specific question (e.g., are there more visits to emergency
rooms on nights with a full moon?). The disadvantage of this approach is that
key questions cannot be asked directly of the very people being studied: for
example, did subjects in the study want or refuse a specific treatment? Did
physicians offer it, and if not, why? Second, as Landsverk’s reaction to the
University of Pittsburgh study suggests, the absence of
alleged racial bias does not make news. Consider the following example of a
study that made a media splash the first time around.
A
Misdiagnosed Case of Physician Bias
We
know that black persons generally undergo cardiac catheterization less
frequently than whites. Catheterization is a procedure used to discern whether
there is blockage in the coronary arteries, the vessels that feed blood to the
heart itself, and therefore whether the patient is at risk for a heart attack.
The delicate process involves introducing a catheter into an artery in the leg
and threading it upward toward the heart. When it reaches the point were the
coronary arteries branch off, dye is squirted and the arterial patterns show up
on a real-time X-ray. This is generally the first step in determining whether
the vessels can be opened wider via a tiny balloon or whether some or all of
the vessels must be replaced in a bypass operation.
Struck
by the observation that black patients undergo catheterization less often than
whites, Dr. Kevin A. Schulman and others at Georgetown University Medical
Center wanted to examine how doctors made their decisions to refer patients for
the procedure.17 The researchers recruited 720 general internists at
medical conventions and asked them to participate in a study of clinical
decision making. The internists were not told that a primary purpose of the
study was to explore how the race and sex of the patient might affect those
decisions, nor were they told that the researchers expected to find that
African Americans (and women) would be referred for cardiac catheterization
less frequently than white men.
The
doctors watched videotapes of actors wearing dressing gowns and answering
questions posed to them by an interviewer who elicited their complaints about
chest pain and other relevant medical and personal history, including their
insurance status. All the questions asked of the actors and their responses,
down to the gestures used to describe the symptoms, were scripted to minimize
inconsistencies. Overall, the doctors, who were mostly white, viewed 144
different videotapes, one for every possible combination of race, sex, and age
and including differing clinical variables like the nature of the chest pain
and the patient’s stress test and EKG results. The physicians were asked
whether the patients’ complaints appeared to reflect heart disease or another
kind of distress, such as indigestion, and to rate the likelihood that the pain
was indeed heart-related. As it turned out, all eight groups received similar
ratings, leading the authors to assume the doctors would also refer for
catheterization at similar rates. Yet, according to Schulman, “women and blacks
were significantly less likely to be referred for catheterization than white
men.” About 9 percent of the white men were not referred versus 15 percent of
the women and black patients. If representative of actual clinical outcomes,
Schulman said, this would mean that blacks and women “were 40 percent less
likely to be referred.” Schulman misspoke, however: what it really would have
meant was that white men had a 40 percent lower chance of not being
referred. Quite a difference.
These
findings were presented in an article titled, “The Effect of Race and Sex on
Physicians’ Recommendations for Cardiac Catheterization,” published in the New England
Journal of Medicine in the winter of 1999. In the article Schulman and
his associates speculated:
Our
findings that the race and sex of the patient influence the recommendations of
physicians independently of other factors may suggest bias on the part of the
physicians. However, our study could not assess the form of bias. Bias may
represent overt prejudice on the part of physicians, or, more likely, could be
the result of subconscious perceptions rather than deliberate actions or
thoughts. Subconscious bias occurs when a patient’s membership in a target
group automatically activates a cultural stereotype in the physician’s memory
regardless of the level of prejudice the physician has.18
The
study was a media sensation. On ABC’sWorld News This Morning, Juju
Chang told viewers: “How your doctor treats your heart may depend on the color
of your skin. . . . The bias shows up in the diagnosis and doctors don’t even
realize it.”19 Peter Jennings predicted that the study would make “political
waves” because it showed that “prejudice among doctors causes a gap in the
quality of health care between blacks and whites.”20 On Nightline, Ted
Koppel set up the story like this: “Last night we told you how the town of
Jasper, Texas, is coming to terms” with the racially motivated murder of a
black man; “Tonight we will focus on [doctors] who would be shocked to learn
that what they do routinely fits quite easily into the category of racist
behavior.”21 Newspaper headlines echoed the theme: “Cardiac
Testing: Study FindsWomen, Blacks Are Being Shortchanged,” the Chicago Tribune said.22 “Health
Care: It’s Better If You’re White,” announced the Economist.23 The
articles repeated Schulman’s statement that black patients were 40 percent less
likely to be referred.
Some
of the most intense—indeed, self-flagellating—reactions came from the medical
profession itself. An editorial in The Lancet,
Britain’s foremost medical journal, saw the findings as being “as close to a
definition of institutionalized racism as doctors and health care providers may
dare to get.”24 Aubrey Lewis, a Long Island cardiologist, warned on
Nightline
that “if
this [physician bias] continues on, you’re looking at literally a decimation of
the African-American population.”25
A
Second Sober Look at Schulman’s Study
A
revelation came six months after the Schulman study appeared when the New England
Journal of Medicine, the same journal that had printed Schulman’s
study, published a powerful rebuttal. This analysis was by Lisa M. Schwartz,
Steven Woloshin, and M. Gilbert Welch, all physicians at the White River
Junction Veterans Administration Hospital in Vermont, who reanalyzed Schulman’s
data to show that the average referral rates for three of the four groups were
in fact the same.26 White men, white women, and black men were all
referred at the rate of 9 in 10; only black women, for unclear reasons, had a
lower referral rate, about 8 in 10. Put another way, black women were 87
percent as likely as white women and men of both races to be referred for
catheterization. And black men were treated just as aggressively as both white
men and white women.
The
doctors from White River Junction also expressed dismay at what might be called
the statistical sleight-of-hand that supported the Schulman hypothesis of
physician referral bias. “The probability of referral for blacks was 7 percent
lower. . . . These exaggerations serve only to fuel anger and undermine the
trust between physicians and their patients,” the White River Junction doctors
wrote. They were not alone in expressing concern; the NEJM editors
published a note in the very same issue regretting that they had not required
the authors to use more straightforward statistical measures. “We take
responsibility for the media’s over-interpretation of [this] article,” they
admitted.27
Even
after seeing how his findings had been interpreted by the press and used to
goad racial resentments, Schulman would not budge. “Our study will . . .
encourage the medical profession to seek ways to eliminate unconscious bias
that may influence physicians’ clinical decisions,” he maintained.28 Also
sticking with Schulman’ s interpretationwas Paul Douglass, a cardiologist at
Morehouse School of Medicine. “You can argue with statistics all day,” he told USA Today; “we
have to face the reality of our situation: There is a gender and racial bias.”29 Compared
with the tidal wave of coverage triggered by the Schulman study, the article by
Schwartz and her colleagues generated a mere trickle of media interest, as
noted by columnist John Leo and the media magazine Brill’s Content.30
Alternative
Explanations for Differences in Treatment
Accusations
of bias make headlines. Less catchy are the mundane but meaningful explanations
that are more faithful to the clinical situations that doctors and patients
face every day. A judicious approach to the topic has been adopted by the
Kaiser Family Foundation. “Even when differences persist, it should be noted
that every differential in care is not necessarily a problem,” says a 1999
foundation report, “and that the level of care obtained by whites may not be
the appropriate standard for comparison.”31
One
reason, for example, that procedure rates differ is that medical problems do
not necessarily occur with the same frequency across races. Consider: Uterine
fibroid tumors, and thus hysterectomies, are more common in black women than in
whites, while osteoporosis-related fractures, and thus hip replacement, are
rarer. Limb amputation is more common among black patients because thicker
atherosclerosis of the blood vessels in the leg makes it harder to perform
limb-saving surgery.32 African Americans suffer stroke at many times the
rate of whites, yet undergo a procedure to unclog arteries in the neck
(endarterectomy) only one-fourth as often. Racism? Unlikely. It turns out that
whites tend to have their obstructions in the large, superficial carotid
arteries of the neck region that are readily accessible to surgery. Blacks tend
to have their blockages in the branches of the carotids. These smaller branches
run deeper and farther up into the head where the surgeon cannot reach them.33
Another
consideration is the clinical condition of the patient. Does he have other
medical problems that alter the risk-to-benefit ratio of a procedure, making it
less favorable? The treatment of heart disease, for example, often needs to be
modified in the presence of uncontrolled high blood pressure and
diabetes—conditions more typical of black patients with heart disease than of
white patients.34
Then
there is the site of care itself. Some hospitals, for example, simply do not
offer certain cardiac procedures. Dr. Lucian L. Leape and his colleagues at the
Harvard Medical School found that about one-quarter of all patients needing
cardiac procedures failed to get them, in large part because they were admitted
to hospitals that did not offer them. Notably, Leape found that failure to
undergo procedure occurred at equal rates across all groups of patients—black,
white, and Hispanic.35
Conversely,
under systems of available medical care in the United States (e.g., veterans’
affairs medical centers, the military services), some differences in treatment
melt away. For example, patients with colorectal and prostate cancer treated in
those systems showed no race-related differences in treatment availability,
treatment methods, or survival rates. Yet in other instances, even with good
health insurance coverage, African American patients may have a lower chance of
receiving certain procedures.36 If money is not an issue in those instances, then
the difference in treatment must represent bias on the part of the
doctors, say those who are quick to charge bias when outcomes differ by race.
As we’ve
seen, this charge makes very lively headlines. But a different interpretation
is plausible: that the patients’ clinical needs rather than the doctors’
personal biases are dictating the care. After all, if not for concern about the
patient, why wouldn’t physicians perform a reimburseable procedure? The factors
discussed so far are only some of the determinants of whether patients undergo
procedures. We must also consider patients’ attitudes toward care. For example,
what is the nature of a person’s belief in his susceptibility to disease, the
seriousness with which he perceives disease, and his confidence that treatment
will work?37 Social scientists call this the health belief
model. Culturally influenced ideas about illness also play a role in patients’
decisions to refuse or delay screening tests and interventions. Fatalistic
attitudes toward the value of preventive care and the outcomes of disease as
well as magical thinking (e.g., that the devil can cause cancer, that
mammography machines cause breast cancer) and the use of folk remedies are more
prevalent in minority groups.38
Says
Lorna G. Canlas, a nurse with an East Harlem clinic that cares for a Latino
population, “Most clients I encounter need to be persuaded of the validity and
utility of modern medical practices.39 Other studies have documented a
greater aversion to surgery among African American patients compared with
whites, even when the white patients’ perceptions of current health state,
level of education, and age were all taken into account.40
A
Hasty Allegation of Bias
Kidney
transplantation has come under scrutiny of the U.S. Commission on Civil Rights
in its 1999 report as a case of “health care inequity,” in part because African
American patients spend considerably more time on the waiting list for a new
kidney than do white patients.41 This means that they spend more time on the
dialysis machine—a thriceweekly, hours-long process that cleans the blood of
toxic products. The ideal treatment is kidney transplantation, but the process
is a complicated one. Before a patient can receive a kidney, there must be
attempts to “match” the donor with the recipient so that the recipient’s immune
system does not attack, or “reject,” the new kidney. The better the match of biological
variables, the better the outcome. According to a report issued by the UNOS
Histocompatibility Committee, black recipients wait longer owing to factors
such as blood type, sensitization, and some antigens (immune proteins made by
the cells).42
A
technique called antigen matching is used to test for different combinations of
six major antigens found on tissues. A perfect six-out-of-six match is the
ideal condition for compatibility between donor and recipient. Unfortunately, a
complete match is far less common in African American transplant candidates
than in whites because they have more possible antigen combinations than whites
and some of those antigens are very rare in the general population.
Scientists
are still debating the precise physiology of organ rejection and the importance
of near-perfect antigen matching. What they do know is that black transplant
recipients are more likely to reject their new kidneys. Possible reasons
include poor control of hypertension or a more vigorous immune response.43 Even
well-matched transplants can be lost to rejection, suggesting that the standard
antigen-matching system may be too simplistic. 44 Clearly, we need a better
understanding of transplant immunology so that we can develop new and better
medications to prevent rejection.45 Meanwhile, if the compatibility is
marginal, it is sometimes most practical for the physician to have the patient
stay on dialysis longer to wait for a better match. Losing scarce organs to
rejection from mismatch actually makes the recipient more likely to reject
future kidneys. Also, every rejected kidney means one less donor kidney
available to the other people on the waiting list. This is a critical point
because donor kidneys are among the nation’s scarcest resources. In 1996, for
example, more than 70,000 Americans began dialysis for severe renal disease,
but only 12,000 received transplants. 46
Most
patients on dialysis, especially black persons, get their organs from donors
that are deceased, so called cadaveric donors. Once on the waiting list, how do
black patients fare in the allocation of kidneys from cadavers? In 1997 black
patients represented one-third of the waiting list for cadaveric kidneys and,
as a group, donated 11 percent of all cadaveric kidneys and received 27 percent
of them. Thus, more than half of all kidneys received by black transplant
recipients came from donors of other races (predominately white). Donation is a
gift of life that transcends racial scorekeeping— but it is important to look
closely at the numbers when bias in allocation of kidneys is alleged.
Rationale
for Affirmative Action in Medical School
Whether
the quality of health care for minority patients truly depends upon producing
greater numbers of minority physicians is an unresolved empirical question.
Nonetheless, proponents of racial preferences in medical school admissions
contend that white physicians treat white patients better than minority
patients, with whom, it is said, they have difficulty developing a rapport.47 To be
sure, understanding a patient’s cultural tradition is important, but need one
actually be a product of that tradition to be sufficiently sensitive to a
patient? Virtually all the major medical organizations say yes.
Foremost
among them is the Association of American Medical Colleges (AAMC).48 When
California and Texas were planning to dismantle racial preferences in 1996, the
AAMC formed Health Professionals for Diversity, a coalition of major medical,
health, and educational associations, to lobby for the preservation of
preferences. By the time Initiative 200, the Washington State referendum to
prohibit preferences by race, ethnicity, or gender in public institutions, was
on the ballot in 1998, the coalition included fifty-one associations among its
membership. According to an association vice president, the true message of
race-neutral policy to minority students was: “We don’t want you.”49
Given
the relatively small numbers of black, Hispanic, and Native American physicians
(3 percent, 5 percent, and less than 1 percent of the nation’s medical
workforce, respectively), compounded by the declining number of minority
applicants in the late 1990s, many feel that medical schools need to rely on
racial preferences if they are to boost these numbers in the next few years.50 (Asian
Americans are not considered a minority because they are well represented among
practicing physicians: 10 percent versus 4 percent of the general population.)
Racial
preferences played a role in raising first-year enrollment to the point where,
by 1999, it had reached 8 percent black and about 7 percent Hispanic, though it
remains 1 percent Native American.51 But recruitment has been difficult.
In 1995, when racial preferences in medical schools were nearly universal, only
about 12 percent of first-year students were black, Hispanic, orNative
American. The recruitment challenge was characterized by Robert G. Petersdorf,
former president of the AAMC, as follows: “We cannot produce underrepresented
minority medical students if there is an insufficient number who are applying
to our schools, graduating from college, or even finishing high school with
sufficient skills to enable them to survive a premedical course of study.”52 Nonetheless,
by 2010 the AAMC hopes to attain racial and ethnic representation among
physicians that is in proportion to the general population.
The
impact of race-neutral policies in some states will make the 2010 parity goal
even more elusive. Within two years after Proposition 209 passed in 1996, there
was a 29 percent drop in applications by minorities to six public medical
schools in California.53 This set alarm bells ringing throughout the medical
establishment. “There is a national health need for physicians who, after the
Tuskegee Syphilis Study, for example, are trusted by large segments of our
population,” wrote Michael J. Scotti Jr. of the American Medical Association. “It
would be deplorable,” he went on, “if medical schools were not permitted to
consider the needs of patients when determining their criteria for selecting
the best qualified applicants.”54 H. Jack Geiger, a professor of public health at the
City University of New York, in an essay in the American Journal
of Public Health, “Ethnic Cleansing in the Groves of Academe,”
foresaw these “reversals in minority admissions [as] merely the leading edge of
a potential public health disaster.”55 A public health disaster? Only if
there is nothing more important to Americans about their doctors than race.
Caring
Trumps Color
Only a
handful of studies have been devoted to the question of whether patients’
outcomes are better if they and their doctors are of the same race. Many of
these studies were conducted with psychiatric patients, and the majority show
that the clinician’s race has very little to do with how black and white
patients fare in their treatment and recovery.56
According
to a 1994 Harris poll for the Commonwealth Fund called Health Care Services and
Minority Groups, race does not play an especially large role in patients’
attitudes about their doctors. When asked to cite the “things that influence
your choice of doctor,” the physician’s “nationality/ race/ethnicity” ranked
twelfth out of thirteen possible options; just 5 percent of whites and 12
percent of minorities said it was important. A greater portion of Asians, 28
percent, rated race/ethnicity as important, probably because of language
barriers. Even so, over 60 percent of white, black, and Hispanic respondents
said they did not consider the doctor’s ability to speak their language
particularly relevant to their choice of doctor.57 For the entire group of 4,000
respondents, factors such as ease of getting an appointment, the convenience of
office location, and the doctor’s reputation were most influential, cited by
about two-thirds of respondents.
When
respondents who expressed dissatisfaction with their regular doctors were asked
for details, only Asians claimed that race or ethnicity was the problem (and
the percentage was small, only 8 percent of all Asian respondents). Among the
subset of the entire sample who said they “did not feel welcome” at their
doctors’ offices, a mere 2 percent of African Americans and Hispanics
attributed the discomfort to racial/ethnic differences.58 The
main complaint of almost all groups was “failure to spend enough time with me.”
And of those who were so dissatisfied that they changed doctors, only 3 percent
of Asians and 2 percent of blacks did so on the basis of the physician’s race
or ethnicity. The most common complaints were “lack of communication,” “didn’t
like him or her,” “couldn’t diagnose problem,” or “didn’t trust his or her
judgment.” Less than one percent of people polled said that they felt limited
in their options for care because of racial or ethnic discrimination.
Thus,
in this era of managed care’s fifteen-minute doctor visit, what much of the
research on attitude really tells us is that most patients attach more value to
the amount of time they can spend with their doctors than they do to the doctor’s
race or ethnicity. When patients see a different doctor each time they go to
the clinic, as is often the case with municipal clinic patients and those whose
HMOs have high turnover, it is even harder to establish comfort and trust.
Academic
Performance and Racial Preferences
Acceptance
rates for minority students to medical schools have long been higher than rates
for white and Asian applicants with similar qualifications, according to the
Association of American Medical Colleges. In 1979, for example, a minority
student with high grades and board scores had a 90 percent chance of being
admitted to medical school, while a white applicant with comparable
qualifications had a 62 percent chance. By 1991, the last year for which AAMC
has published data, the figures were 90 percent versus 75 percent. And a
low-scoring minority applicant had a 30 percent chance of admission, while a
similarly low scoring white applicant had a 10 percent chance.
At the
University of South Florida College of Medicine, for example, between 1995 and
1997, black applicants with a B+ grade-point average had a roughly 13 percent chance
of admission, whereas white and Hispanic applicants with the same grade-point
average had only a 4 to 5 percent chance.59 Even with the passage of Proposition
209 in 1996 in California, minority applicants to some of California’s public
medical schools were two to almost three times as likely to be admitted as
whites and Asians with considerably higher grades.60
Notwithstanding
the clear race-based advantages in admission to medical schools, the U.S.
Commission on Civil Rights charged discrimination, noting a “persistent yet
baffling denial of the social, economic, and historical realities depriving our
profession of minority physicians.”61 True, many minority students have
suffered unfairly in second-rate primary and secondary schools, but medical
school seems a risky point in the academic pipeline at which to give an academic
break.
Sadly,
black and Hispanic applicants,who are favored in medical school admissions,
also are overrepresented among students who encounter trouble in medical
school. According to the AAMC, they are more likely than other students to
repeat their first year or to drop out.62 Of the medical school class admitted
in 1989, over 20 percent of minority students did not graduate four years
later, as is typical, with the class of 1993; of white and Asian students in
the same class, only 8 percent failed to graduate.63 In 1996
the picture worsened across the board: 39 percent of minority students were
unable to keep pace compared with 15 percent of nonminority students. 64 A 1994
study published in the Journal of the American Medical Association found
that in 1988 51 percent of black medical students failed Part 1 of the National
Medical Boards (taken after the second year of medical school), more than four
times the 12 percent rate of white students. (Failure rates for Hispanic
students were 34 percent, and for Asians, 16 percent.)65
The
typical path for students after graduating from medical school is application
to residency programs in a chosen specialty. At this level, too, there are
different outcomes. “It has been documented consistently over the past decade
that a higher proportion of underrepresented minority students failed to obtain
first-year residency positions through [the standard process],” wrote Gang Xu
of Jefferson Medical College in Philadelphia and colleagues.66 Moreover,
for the period 1996–1999, the yearly dismissal rate for black residents in
residency programs (14.4 percent) was almost double that for other groups (7.7
percent).67 Reasons for dismissal can include persistently
unprofessional behavior, chronic absenteeism, and lack of aptitude or interest.
These
problems encountered by black and Hispanic medical students are the result of
admitting students who are underqualified. When black students were compared
with whites who had similar academic credentials, the failure rates were
similarly low.68 A 1987 study by the RAND Corporation found that
only about half of black physicians obtained board certification compared with
80 percent of white physicians. Yet African Americans were more likely
than white physicians to obtain “board certification” in a recognized medical
specialty if their grades in college and on the Medical College Admissions Test
were strong enough to get them admitted on a competitive basis in the first
place.69
Though
the subject deserves more research, a handful of studies have linked medical
school performance with the quality of the physician produced. Robyn Tamblyn of
McGill University and colleagues found that licensing examination scores were
significant predictors of whether Canadian physicians sought consultations from
specialists, prescribed appropriately, and ordered screening mammograms for
female patients aged 50–69. Given Canada’s universal health insurance, these
referral and medicating patterns were unlikely to have been influenced by
patients’ ability to pay.70 Another study, among American doctors, found that
passing grades on the test to become a specialist (e.g., a cardiac surgeon, a
neurologist) and the scores received on the internal medical licensing exam
correlated with ratings of performance in practice by fellow doctors.71
An
Honest Debate
Instituting
racial preferences toward the goal of diversity for its own sake or in the
spirit of compensation for historical mistreatment are philosophical
abstractions for debate in courtrooms, classrooms, and legislatures. But
instituting preferences in order to enhance minority health is a practical
proposition that can actually be tested using real-world data. Thus far, in my
view, the case has yet to be made that improving minority health depends on having
more minority doctors.
Racial
preferences would seem, for several resons, to be an inefficient way to
increase the number of minority doctors—and, thus, minority health. First,
simply put, minority representation over the last decade has been fairly
stagnant in spite of aggressive admissions policies. Second, minority
recruitment has resulted in a two-tiered system of academic standards for
admission that has created attendant problems of fairness to other potential
medical students and of propelling some students into a career for which they
are ill prepared. Third, we lack compelling evidence that same-race (minority)
doctor-patient relationships result in better patient outcomes.
No
matter who treats our nation’s poor and minority patients, we must recognize
that they tend to have multiple, chronic medical conditions and are often
clinically complicated. They need the best doctors they can get, regardless of
race. Not enough doctors choose to work in rural community clinics and poor,
inner-city neighborhoods; moreover, in a number of states such as Florida,
Illinois, North Dakota, Texas, and New York graduates of foreign medical
schools represent one-fourth to one-half of the physician workforce in
underserved areas.72 California has approved legislation requiring its
public medical schools to increase the number of training slots for
primary-care physicians and to decrease slots for specialists.73 Other approaches
use creative financial incentives (e.g., loan forgiveness, rent rebates, higher
pay) to draw young doctors into rural and inner-city communities. We should be
capitalizing on these strategies, not lowering standards for admission to
medical school.74 As far as patient preferences are concerned, again
it would make more sense to create mechanisms that ensure patient choice than
to open the doors of medical schools to unprepared students.
Finally,
we must not forget that the physician is part of a larger network of health
care providers. For some preventive care (e.g., vaccinations for children and
the elderly, prenatal care, routine infant checkups, and blood pressure
surveillance), physicians are not even needed. Specially trained nurses can
help provide after-hours medical appointments and give basic advice over the
telephone; public health nurses or physician assistants cooperating with local
churches and community organizations can deliver these services at least as
effectively. Inner-city hospitals are now hiring health educators (ideally from
within the community) to teach fellow residents about diet and exercise,
smoking cessation, and screening for cancer, diabetes, and hypertension. These
workers also participate in outreach efforts to get people into clinics for
routine care—an important task because medically indigent people tend to
underuse available care, show up in emergency rooms for minor problems, and
receive diagnoses for conditions like cancer at an advanced stage.
While
well-meaning groups like the AAMC advance the questionable belief that minority
health is dependent on minority physicians, evidence points more vigorously
toward the virtues of promoting health literacy, the formation of
community–health organization partnerships, and the expansion of health
coverage to the uninsured. What patients most seem to want is a qualified
doctor who will spend unhurried time with them. The racial disparities in
health are real, but data do not point convincingly to systematic racial bias
as a determinant—nor to the need for racial preferences in medical school
admissions as a remedy for health disparities.
Notes
1. Quoted in
Laura Meckler, “Panel: Diversify Medical Workforce,” Associated
Press, December
9, 1998.
2. The Health Care
Challenge: Acknowledging Disparity, Confronting Discrimination,
and Ensuring
Equality, vol. 11, The Role of Federal Civil Rights
Enforcement Efforts:
A Report of the
U.S. Commission on Civil Rights, September 1999, p. 14.
3. Deborah
Shelton, “A Study in Black and White,” American Medical News, May
1, 2000, p. 22.
4. Curtis L.
Taylor, “Mistakes in the Past, Fears in the Present: Wary of System,
Many Blacks
Reluctant to Seek Timely Care in the Health Divide Series,” Newsday,
December 4,
1998.
5. Changing
America: Indicators of Social and Economic Well-Being by Race and
Hispanic Origin, prepared by
the Council of Economic Advisors for the President’s
Initiative on
Race, published by the National Center for Health Statistics, Centers for
Disease
Control, 1998.
6. Paul Starr, The Social
Transformation of American Medicine (New York: Basic
Books, 1982).
7. Vanessa Northington
Gamble, “A Legacy of Distrust: African-Americans and
Medical
Research,” American Journal of Preventive Medicine 9, Suppl.
(1993): 35–37.
8. See J. L.
Escarce et al., “Racial Difference in the Elderly’s Use of Medical
Procedures and
Diagnostic Tests,” American Journal of Public Health 83 (1993): 948–
54; E. A. Mort,
J. S. Weissman, and A. M. Epstein, “Physician Discretion and Racial
Variation in
the Use of Surgical Procedures,” Archives of Internal Medicine 154 (1994):
761–67; J. Z.
Ayanian et al., “Racial Differences in the Use of Revascularization Procedures
After Coronary
Angiography,” Journal of the American Medical Association 269
(1993):
2642–46; Risa B. Burns et al., “Black Women Receive Less Mammography
Even with
Similar Use of Primary Care,” Annals of Internal Medicine 125 (1996):
173–
82; Jeff
Whittle et al., “Do Patients’ Preferences Contribute to Racial Differences in
Cardiovascular
Procedure Use?” Journal of General Internal Medicine 12 (1997): 267–
73; M. E.
Gornick et al., “Effects of Race and Income on Mortality and Use of Services
Among Medicare
Beneficiaries,” New England Journal of Medicine 335, no. 11 (1996):
791–99. A
particularly elegant study by Johns Hopkins researchers, Daumit et al., found
that the gap
between better-insured white patients and poorly covered black patients
disappeared
after the black patients reached age 65 and began receiving health insurance
through
Medicare: Gail L. Daumit et al., “Use of Cardiovascular Procedures Among
Black Persons
and White Persons: A Seven-Year Nationwide Study in Patients with
Renal Disease, Annals of
Internal Medicine 130 (1999): 173–82.
9. P. B. Bach
et al., “Racial Differences in the Treatment of Early Stage Lung
Cancer,” New England
Journal of Medicine 341, no. 16 (1999): 1198–1205.
10. D. E.
Campbell and E. R. Greenberg, letter to the editor, ibid., 342, no. 7 (2000): 517.
11. Quoted in
Denise Grady, “Not a Simple Case of Health Racism: White Doctors,
Black Patients,”
New
York Times, October 17, 1999, Weekend p. 1; Denise Grady,
“Racial
Discrepancy Is Reported in Surgery for Lung Cancer,” ibid., October 14, 1999,
p. A24.
12. Quoted in
Grady, “Not a Simple Case.”
13. K. H. Todd
et al., “Ethnicity and Analgesic Practice,” Annals of Emergency
Medicine 35 (2000):
11–16.
14. Quoted in Gabrielle
Glaser, “In Treating Patients for Pain, A Racial Gap,” New
York Times, December 28,
1999, p. D8.
15. John
Landsverk, “Patient Race and Ethnicity in Primary Management of Child
Behavior
Problems: An Important Non-Finding,” Medical Care 37, no. 11 (1999):
1089–91.
16. Kelly J.
Kelleher et al., “Patient Race and Ethnicity in Primary Care Management
of Child
Behavior Problems: A Report from PROS and ASPN,” ibid., pp. 1092–1104.
17. K. A.
Schulman et al., “The Effect of Race and Sex on Physicians’ Recommendations
for Cardiac
Catheterization,” New England Journal of Medicine 340, no. 8
(1999): 618–26.
See also: E. D. Peterson et al., “Racial Variation in the Use of Coronary
Revascularization
Procedures: Are the Differences Real? Do They Matter?” ibid., 336
(1997): 480–86;
M. Laouri et al., “Underuse of Cardiac Procedures: Application of
Clinical
Method,” Journal of the American College of Cardiologists 29 (1997):
891–97.
18. Schulman et
al., p. 624.
19. “Medical
Treatment Based on Color of the Skin: Study Shows Doctors Have
Unconscious
Bias,” ABC World News This Morning, February 25, 1999.
20. Peter
Jennings, ABC World News Tonight, February 24, 1999, as reported in
Health Line, February 25,
1999, in story “Minority Health: Study Confirms Heart Test
Bias.”
21. “America in
Black and White: Health Care, the Great Divide,” Nightline, February
24, 1999.
22. “Cardiac
Testing: Study Finds Women, Blacks Are Being Shortchanged,” Chicago
Tribune, March 18,
1999, p. C7.
23. The Economist, February 27,
1999, pp. 28–29.
24. “Institutionalized
Racism in Health Care” (editorial), The Lancet, no. 9155
(1999): 765.
25. “America in
Black and White: Health Care, the Great Divide,” Nightline, February
24, 1999.
26. Lisa M.
Schwartz, StevenWoloshin, and M. GilbertWelch, “Misunderstandings
About the
Effects of Race and Sex on Physicians’ Referrals for Cardiac Catheterization,”
New England
Journal of Medicine 341, no. 4 (1999): 279–83. Note: average referrals
per
actor/patients:
white male (55 yr.) referred by 91.1% of doctors; white male (70 yr.),
90%; black male
(55 yr.), 91.1%; black male (70 yr.), 90%; white female (55 yr.), 92.2%;
white female
(70 yr.), 88.9%; black female (55 yr.), 84.4%; black female (70 yr.), 73.3%.
It is the
70-year-old black female actor/patient, in particular, who garnered the
noticeably
low rate of
referrals. It is not clear why this was so. Because there was only one
actor/patient
per category, it is possible that this woman was not very convincing in
her portrayal
of a cardiac patient.
27. Gregory D.
Curfman and Jerome P. Kassirer (editors’ note), New England
Journal of
Medicine 341, no. 4 (1999): 287.
28. K. A.
Schulman, J. A. Berlin, and J. J. Escarce (authors’ reply), ibid., p. 286.
29. Quoted in
Kathleen Fackelmann, “Does Unequal Treatment Really Have Roots
in Racism?” USA Today, September 16,
1999, p. 10D.
30. John Leo, “Shocking
But Not True,” U.S. News and World Report, November
22, 1999, p.
18; Jennifer Greenstein, “The Heart of the Matter,” Brill’s Content, October
1999, p. 40.
31. “Key Facts:
Race, Ethnicity, and Medical Care,” Henry J. Kaiser Family Foundation,
October 1999.
32. Edward
Guadagnoli et al., “The Influence of Race on the Use of Surgical
Procedures for
Treatment of Peripheral Vascular Disease in the Lower Extremities,”
Archives of General
Surgery 130 (1995): 381–86.
33. Ronnie D.
Horner, Eugene Z. Oddone, and David B. Matchar, “Theories Explaining
Racial
Differences in the Utilization of Diagnostic and Therapeutic Procedures
for
Cerebrovascular Disease,” Milbank Quarterly 73, no. 3 (1995):
443–62.
34. W. W. O’Neill,
“Multivessel Balloon Angioplasty Should Be Abandoned in
Diabetic
Patients,” Journal of the American College of Cardiology 31 (1998):
20–22; S.
G. Ellis and C.
R. Narins, “Problem of Angioplasty in Diabetics,” Circulation 96 (1997):
1707–10.
35. Lucian L.
Leape et al., “Underuse of Cardiac Procedures: Do Women, Ethnic
Minorities, and
the Uninsured Fail to Receive Needed Revascularization?” Annals of
Internal
Medicine 120 (1999): 183–92.
36. S. A.
Optenberg et al., “Race, Treatment, and Long-Term Survival from Prostate
Cancer in an
Equal-Access Medical Care Delivery System,” Journal of the American
Medical
Association 274 (1995): 1599–1605; J. A. Dominitz et al., “Race,
Treatment,
and Survival
Among Colorectal Carcinoma Patients in an Equal-Access Medical System,”
Cancer 82 (1998):
2312–20; W. J. Mayer and W. P. McWhorter, “Black/White
Differences in
Non-Treatment of Bladder Cancer Patients and Implications for Survival,”
American Journal
of Public Health 79 (1989): 772–75.
37. J. A.
Harrison, R. D. Mullen, and L. W. Green, “A Meto-Analysis of Studies of
the Health
Belief Model with Adults,” Health Education Research 7 (1992):
107–16.
38. B. D. Powe,
“Fatalism Among Elderly African Americans: Effects on Colorectal
Cancer Screening,”
Cancer
Nursing 18, no. 5 (1995): 385–92; C. Maynard et al., “Race
and Clinical
Decision Making,” American Journal of Public Health (1986): 1446; P. A.
Johnson et al.,
“Effect of Race on the Presentation and Management of Patients with
Acute Chest
Pain,” Annals of Internal Medicine 118 (1993): 593–601; D. R. Lannin et
al., “Influence
of Socioeconomic and Cultural Factors on Racial Differences in Latestage
Presentation of
Breast Cancer,” Journal of the American Medical Association 279,
no. 22 (1998):
1801–7; V. M. Taylor et al., “Mammography Use Among Women
Attending an
Inner-City Clinic,” Journal of Cancer Education 13, no. 2 (1998): 96–101.
39. Lorna G.
Canlas, “Issues of Health Care Mistrust in East Harlem,” Mount Sinai
Journal of
Medicine 66, no. 4 (1999): 257–58.
40. B. J.
McNeil, R. Weichselbaum, and S. G. Pauker, “Fallacy of the Five-Year
Survival in
Lung Cancer,” New England Journal of Medicine 299 (1978): 1397–1401;
Eugene Z.
Oddone et al., “Understanding Racial Variation in the Use of Carotid
Endarterectomy:
The Role of Aversion to Surgery,” Journal of the National Medical
Association 90 (1998):
25–33.
41. U.S.
Commissionon Civil Rights, The Health Care Challenge, vol. 11
(September
1999), p. 111.
42. UNOS
Histocompatibility Committee, The National Kidney Distribution
System:
Striving for
Equitable Use of a Scarce Resource, UNOS Update, August 1995.
43. R. H.
Kerman et al., “Possible Contribution of Pre-Transplant Immune Responder
Status to Renal
Allograft Survival Difference of BlackVersus White Recipients,”
Transplantation 51 (1991):
338–42; S. Hariharan, T. J. Schroeder, and M. R. Frist,
“Effect of Race
on Renal Transplant Outcome,” Clinical Transplantation 7 (1993): 235–
9; B. L.
Kasiske et al., “The Effect of Race on Access and Outcome in Transplantation,”
New England
Journal of Medicine 342 (1991): 302–7.
44. Glenn M.
Chertow and Edgar L. Milford, “Poor Graft Survival in African-American
Transplant Recipients Cannot be Explained byHLAMismatching,” Advances
in Renal
Replacement Therapy 4 (1997): 40–45.
45. Starting in
1995 new immunosuppressants (drugs that help prevent rejection)
became
available. This breakthrough may not only improve survival after
transplantation
for black
patients, but it may also obviate the need for tight antigen matching
and thus move
blacks more quickly up the waiting list. In spite of the tremendous
promise of
these drugs, the clinical verdict on their success will not be in for several
years because
it takes at least two years after a transplant to be certain whether a kidney
will function
over the long term (Clive O. Callender, August 9, 1999, personal
communication).
46. Renal Data
Systems. USRDS 1998 Annual Report. Bethesda, Md., National
Institute of
Diabetes, Digestive and Kidney Diseases, April 1998.
47. Joel C. Cantor,
Lois Bergeisen, and Laurence C. Baker, “Effect of Intensive
Educational
Program for Minority College Students and Recent Graduates on the
Probability of
Acceptance to Medical School,” Journal of the American Medical
Association
280 (1998):
772–76.
48. In 1992 the
AAMC introduced an initiative called Project 3000 by 2000 whose
goal was to see
3,000 underrepresented minority students enter medical school by the
year 2000.
49. Jeffrey
Mervis, “Wanted: A BetterWay to Boost Numbers of Minority Ph.D.s,”
Science 28 (1998):
1268–70.
50. Randal C.
Archibold, “Applications to Medical Schools Decline for Second
Straight Year,”
New
York Times, September 2, 1999, p. A23; Holcomb B. Noble, “Struggling
to Bolster
Minorities in Medicine,” ibid., September 29, 1998, p. F7.
51. Barbara
Barzansky, Harry S. Jonas, and Sylvia I. Etzel, “Educational Programs
in U.S. Medical
Schools, 1998–1999,” Journal of the American Medical Association 282
(1999): 840–46.
52. Robert G.
Petersdorf, “Not a Choice, An Obligation,” presented at the plenary
session of the
102nd meeting of the AAMC, Washington, D.C., November 10, 1991.
53. Kevin
Grumbach, Elizabeth Mertz, and Janet Coffman, “Under-Represented
Minorities in
Medical Education in California,” March 1999, California Center for
Health Workforce
Studies at the University of California, San Francisco (report avail.
at
‹http://futurehealth.ucsf.edu›).Nationwide, minority applications dropped 13
percent
between 1996
and 1998. In large part, though not exclusively, this was due to the
California
initiative and to the three states (Texas, Louisiana, and Mississippi) that in
the wake of the
1996 Hopwood case no longer considered race as a factor in medical
school
admission. Even though minority applications again declined between 1998 and
1999, there is
no evidence that the pool of potential minority applicants is shrinking.
The percentage
of black and Hispanic students getting bachelor of science degrees has
remained
constant, as have those races’ percentage of college graduates (personal
communication,
Ella Cleveland, Division of Community and Minority Programs,
January 6,
2000). No one really understands why medical school is relatively unpopular
among these
students. Perhaps some are discouraged by the high educational debt they
will assume or
by the loss of physician autonomy in the world of managed care.
Interestingly,not
all these developmentswere a result of Proposition 209 and Hopwood.
First, across
the country, applications from whites have been going down as well; there
was a 6 percent
drop in all applicants from 1998 to 1999, the third straight year of
decline.
Second, the decline in minority applicants in California actually started two
years before
passage of Proposition 209. Third, at California’s three private medical
schools, which
were unaffected by the new law, there was also a large drop in minority
applications
(25 percent) after its passage.
54. Michael J.
Scotti Jr., “Medical School Admission Criteria: The Needs of Patients
Matter,” Journal of the
American Medical Association 278 (1997): 1196–97.
55. H. Jack
Geiger, “Ethnic Cleansing in the Groves of Academe,” American Journal
of Public Health
88
(1998): 1299–1300, quotation on p. 1299.
56. M. J. O’Sullivan
et al., “Ethnic Populations: Community Mental Health Services
Ten Years
Later,” American Journal of Community Psychology 17 (1989):
17–30; Robert
Rosenheck and
Catherine L. Seibyl, “Participation and Outcome in a Residential Treatment
and Work
Therapy Program for Addictive Disorders: The Effects of Race,”
American Journal
of Psychiatry 155 (1998): 1029–34; S. Sue et al., “Community
Mental
Health Services
for Ethnic Minorities Groups: A Test of the Cultural Responsiveness
Hypothesis,” American
Psychologist 59 (1991): 553–40; R. A. Rosenheck and A. F.
Fontana, “Race
and Outcome of Treatment forVeterans SufferingFrom PTSD,” Journal
of Traumatic
Stress 9 (1996): 343–51.
57. “Health
Care Services and Minority Groups: A Comparative Survey of Whites,
African-Americans,
Hispanics, and Asian Americans,” conducted for the Commonwealth Fund by Louis
Harris and Associates, New York 1994 (study no. 932028), table
1-18, p. 34.
58. Ibid.,
table 3-27, p. 93.
59. Thomas R.
Dye, Race as an Admissions Factor in Florida’s Public Law and Medical
Schools (Tallahassee:
Lincoln Center, 1999).
60. ‹http://www.acusd.edu/e
cook/›
61. U.S.
Commissionon Civil Rights, The Health Care Challenge, vol. 11
(September
1999); p. 116.
62. As cited in
Balancing
the Scales of Opportunity: Ensuring Racial and Ethnic
Diversity in the
Health Professions (Washington D.C.: National Academy Press, 1994), p.
24.
63. H.W. Foster
Jr., “Reaching Parity for Minority Medical Students: A Possibility
or a Pipe
Dream?” Journal of the National Medical Association 88 (1996):
17–21.
64. Minority
Students in Medical Education: Facts and Figures, IX (Washington,
D.C.: AAMC,
1998).
65. Beth Dawson
et al., “Performance on the National Board of Medical Examiners
Part 1
Examination by Men and Women of Different Race and Ethnicity,” Journal of
the American
Medical Association 272 (1994): 674–79.
66. G. Xu et
al., “The Relationship Between Race/Ethnicity of Generalist Physicians
and Their Care
for Underserved Populations,” American Journal of Public Health 87
(1997): 817–22.
67. Rebecca S.
Miller, Marvin R. Dunn, and Thomas Richter, “Graduate Medical
Education,
1998–1999: A Closer Look,” Journal of the American Medical Association
282 (1999):
855–60.
68. Dawson et
al., 1994.
69. S. N.
Keith, R. M. Bell, and A. P. Williams, “Assessing the Outcome of Affirmative
Action in
Medical School: A Study of the Class of 1975,” RAND Corporation
publication no.
R-3481-CWF, August 1987.
70. Robyn
Tamblyn et al., “Association Between Licensing Examination Scores and
Resource Use
and Quality of Care in Primary Care Practice,” Journal of the
American
Medical Association
280
(1998): 989–96.
71. P. G.
Ramsey et al., “Predictive Validity of Certification by the American Board
of Internal
Medicine,” Annals of Internal Medicine 110 (1989): 719–26.
72. Leonard D.
Baer, Thomas C. Ricketts, Thomas R. Konrad, “International Medical
Graduates in
Rural, Underserved Areas,” Findings Brief, Cecil G. Sheps Center for
Health Services
Research, University of North Carolina, Chapel Hill, May
1998.
73. Jay Greene,
“Primary Push,” American Medical News, March 13, 2000, pp. 10–
12.
74. T. P. Weil,
“Attracting Qualified Physicians to Underserved Areas,” Physician
Executive 25 (1999):
53–63.
==============================
Supporting Black Churches
JOHN
J. DIIULIO JR.
This essay was
previously published under the title “Black Churches and the Inner-City Poor,”
in Christopher H. Foreman Jr., editor, The African American Predicament (Washington,
D.C.: Brookings Institution, 1999), pp. 116–40. Ashorter version, entitled
“Supporting Black Churches: Faith, Outreach, and the Inner-City Poor,” appeared
in The
Brookings Review, Spring 1999, pp. 42–45. It is reprinted here by
permission of the Brookings Institution.
Under
what, if any, conditions can the life prospects of today’s black
inner-city poor be improved, and how, if at all, can we foster those
conditions? My argument in this essay is that supporting black churches and
other faith-based grassroots organizations that perform youth and community
outreach functions in poor inner-city neighborhoods is a necessary and vital
although insufficient condition for repairing the social fabric and restoring
economic vitality in truly disadvantaged urban neighborhoods. The case for
supporting black churches rests upon a certain constellation of ideas and
findings concerning inner-city poverty, religiosity and volunteers, religious
faith as a factor in ameliorating social problems, and the extent of
church-anchored outreach in black urban neighborhoods.
Black
Inner-City Poverty
Recent
research by the editors of this book and others has clearly shown that black
Americans have progressed economically over the last half century.1 Even
analysts who have emphasized the persistence of black poverty and black-white
income gaps have acknowledged that “there have been significant improvements
since 1940 in the absolute and relative positions of blacks”; that black
Americans represent a trillion-dollar-plus annual market larger than that of “most
countries in the world”; that “the majority of working-class and middle-class
black families have made some important gains”; and that since “the early
1990s, black family income has risen.”2 But as I have argued elsewhere,
unless we propose to do nothing more than continue idle academic or ideological
debates, the triumph of overall black economic progress neither can nor should
obscure the tragedy of black poverty and joblessness.3
Black
Americans made substantial economic progress in the 1960s, but each post-1970
recession exacted a disproportionate toll on blacks regardless of family
structure; for example, Robert B. Hill estimated that the four recessions
between 1970 and 1985 led to a tripling in the jobless rates among blacks in
two-parent families as well as among blacks in motheronly households.4 As the
national economy improved in the late 1980s, black men and women still had
unemployment rates more than double those of whites. Even after the boom years
of the 1990s, 40 percent of black children, concentrated heavily in central
city neighborhoods, continued to live in below-the-poverty-line households.5
Some
analysts deflect such concerns about black inner-city poverty by debating
statistical measures of what it means to be poor, or by stressing that
intra-group rates of poverty and other social ills among blacks have varied
largely according to marital status and other conditions that reflect individual
choices. There is, however, no genuine empirical or moral basis for denying
that millions of black children, through absolutely no fault of their own,
remain economically disadvantaged in neighborhoods where jobs are few and
drugs, crime, and failed public schools are common.
Religiosity
and Volunteers
How we
approach black inner-city poverty is bound to be affected by religious ideals,
influences, and institutions. “The United States,” observes George Gallup Jr., “is
one of the most devout nations of the entire industrialized world, in terms of
religious beliefs and practices.”6 Black Americans are in many ways the
most religious people in America. Some 82 percent of blacks (versus 67 percent
of whites) are church members; 82 percent of blacks (versus 55 percent of
whites) say that religion is “very important in their life”; and 86 percent of
blacks (versus 60 percent of whites) believe that religion “can answer all or
most of today’s problems.” 7
As
Father Andrew Greely has observed, both “frequency of church attendance and
membership in church organizations correlate strongly with voluntary service.
People who attend services once a week or more are approximately twice as
likely to volunteer as those who attend rarely if ever.”8 The
best available data suggest that religious organizations and “relationships
related to their religion” are the major forces in mobilizing volunteers in
America; even a third of purely secular volunteers (persons who did not
volunteer for specifically religious activities) relate their service “to the
influence of a relationship based in their religion.”9 Similarly,
as Gallup has reported, “Churches and other religious bodies are the major supporters
of voluntary services for neighborhoods and communities. Members of a church or
synagogue . . . tend to be much more involved in charitable activity,
particularly through organized groups.”10
Faith
Factor Findings
But
what, if any, social consequences for blacks and other Americans flow from
religiosity and faith-based charitable, volunteer, and community-serving work?
Is there any scientific evidence to justify the faith of most black Americans
that religion can “answer all or most of today’s problems”?
James
Q. Wilson has succinctly summarized the small but not insignificant body of
credible evidence to date: “Religion, independent of social class, reduces
deviance.”11 For example, consider the latest research of David B.
Larson, the medical research scientist who pioneered the development of
research on public health outcomes (physical health, mental health, addictions)
that led to new training programs at Harvard and three dozen other medical
schools.12 With criminologist Byron Johnson, Larson has reviewed
some 400 juvenile delinquency studies published between 1980 and 1997. They
report that “the better the study design and measurement methodology, the
greater the likelihood the research will produce statistically significant and
beneficial results associated with ‘the faith factor.’”13
In
other words, the more scientific the study, the more optimistic are its findings
about the extent to which “religion reduces deviance.” This conclusion squares
with the results of another major review of the relevant research literature as
it pertains to adult criminals: “Our research confirms that the religiosity and
crime relationship for adults is neither spurious nor contingent. . . .
Religion, as indicated by religious activities, had direct personal effects on
adult criminality as measured by a broad range of criminal acts. Further, the
relationship held even with the introduction of secular controls.”14 In
other words, “religion matters” in reducing adult crime.
Beyond
crime and delinquency, in a 1996 synopsis of faith factor research, Patrick Fagan
of the Heritage Foundation summarized studies suggesting that religion enhances
family stability (the family that prays together is indeed more likely to stay
together), improves health, reduces adolescent sexual activities and teenage
pregnancies, cuts alcohol and drug abuse, and reinforces other measures of “social
stability.”15
In
1985, Harvard economist Richard Freeman reported that churchgoing, independent
of other factors, made young black males from highpoverty neighborhoods
substantially more likely to escape poverty, crime, and other social ills.16 In a
forthcoming reanalysis and extension of Freeman’s work, Larson and Johnson mine
national longitudinal data on urban black youth and find that religion is
indeed a powerful predictor of escaping poverty, crime, and other social ills.17
Black
Church Outreach Tradition
The
black church has a unique and uniquely powerful youth and community outreach
tradition. The black church’s historic role in providing education, social
services, and a safe gathering place prefigured its historic role in the civil
rights movement.
There
are eight major historically black Christian churches: African Methodist
Episcopal, African Methodist Episcopal Zion, Christian Methodist Episcopal,
Church of God in Christ, National Baptist Convention of America, National
Baptist Convention, USA, National Missionary Baptist Convention, and the
Progressive National Baptist Convention. There are also scores of independent
or quasi-independent black churches and at least nine certified religious
training programs operated by accredited seminaries that are directed toward
ministry in black churches and black faith communities. Together, the eight
major black denominations alone encompass some 65,000 churches and about 20
million members.
Until
the 1990s, however, the richly religious lives of black Americans and the black
church outreach tradition were given short shrift by both historians and social
scientists, and not just by white historians and social scientists. Writing in
1994 in a special double edition of National Journal of Sociology,
Andrew Billingsley, a dean of black family studies, noted that the subject was
largely ignored even by leading black scholars who were keenly aware of “the
social significance of the black church,” including many who “were actually
members of a black church.”18
An
empirically well-grounded perspective on contemporary black church outreach is
provided by sociologist Harold Dean Trulear, an ordained black minister who
taught for eight years at the New York Theological Seminary, has conducted
extensive research on black clergy training, and is presently vice president
for research on religion and at-risk youth at Public/Private Ventures in
Philadelphia. “When it comes to youth and community outreach in the inner city,”
Trulear cautions, “not all black urban churches are created equal”:
Naturally,
it’s in part a function of high resident membership. Inner-city churches with
high resident membership cater more to high-risk neighborhood youth than . . .
black churches with inner-city addresses but increasingly or predominantly
suburbanized or commuting congregations. [The high resident membership black
churches] tend to cluster by size and evangelical orientation. . . . It’s the
small- and medium-sized churches . . . [especially] the so-called . . .
blessing stations and specialized youth chapels with their charismatic leader
and their small, dedicated staff of adult volunteers [that] . . . do a
disproportionate amount of the up-close and personal outreach work with the
worst-off inner-city youth.”19
Surveys
of Church-Based Outreach
When
it comes to solving urban problems and the plight of the black inner-city poor,
black churches cannot do it all (or do it alone), and not all black churches do
it. But that reality should not obscure the black church outreach tradition and
its many and powerful contemporary manifestations. The pathbreaking research of
scholars such as Eric C. Lincoln and Lawrence H. Mamiya, combined with recent
systematic research by Trulear and others, should persuade even a dedicated
skeptic to take church-based outreach seriously, especially where the black
community is concerned.
In a
forthcoming study, P/PV’s Jeremy White and Mary de Marcellus report on the
results of their intensive six-month field exploration of youthserving ministries
in the District of Columbia.20 They interviewed leaders and volunteers in 129 of
the city’s faith-based ministries, including on-site visits to 79 churches,
faith-based nonprofit organizations, and schools, virtually all led by blacks
and serving predominantly black populations. From this research, they concluded
that “there is a critical mass of faithbased organizations inWashington, D.C.,
that work directly and intensively with at-risk youth.” The programs fell into “six
major categories: after-school or tutoring programs; evangelization; gang
violence prevention; youth groups; and mentoring.”21
None
of the programs studied by White and de Marcellus required youth to be the
children of a particular church, profess any particular religious beliefs, or
agree to eventual “churching” as a condition for receiving services, entering
church buildings, or otherwise benefiting from the programs. Also, almost none
of the programs, even those that furnished children with material goods such as
clothes or books, charged a fee. In the words of one of the outreach ministers
quoted on the first page of their report, “The cost of real love is no charge.”22
The
results of a survey of “faith-based service providers in the nation’s capital”
were published in 1998 by the Urban Institute.23 The survey found that 95 percent of
the congregations performed outreach services. The 226 religious congregations
(out of 1,100 surveyed) that responded (67 of them in the District, the rest in
Maryland or Virginia) provided a total of over 1,000 community services to over
250,000 individuals in 1996.
In the
mid-1990s, a six-city survey of how over 100 randomly selected urban churches
(and four synagogues) constructed in 1940 or earlier serve their communities
was undertaken by Ram A. Cnnan of the University of Pennsylvania. The survey
was commissioned and published by Partners for Sacred Places, a
Philadelphia-based national nonprofit organization dedicated to the care and
good use of older religious properties.24 Congregations were surveyed in
Philadelphia, New York, Chicago, Indianapolis, Mobile, and the Bay Area
(Oakland and San Francisco). Each church surveyed participated in a series of
in-depth interviews. Among the Cnnan-Partners survey’s key findings were the
following: 93 percent of the churches opened their doors to the larger
community; on average, each church provided over 5,300 hours of volunteer
support to its community programs (the equivalent of two and a half full-time volunteers
stationed year-round at the church); on average, each church provided about $140,000
a year in community programs, or about sixteen times what it received from
program beneficiaries; on average, each church supported four major programs
and provided informal and impromptu services as well; and poor children who
were not the sons or daughters of church members or otherwise affiliated with
the church benefited from churchsupported programs more than any other single
group.
The
best known and still the most comprehensive survey focusing exclusively on
black churches was published in 1990 by Lincoln and Mamiya. 25 In The Black Church
in the African-American Experience, they reported on the results of
surveys encompassing nearly 1,900 ministers and over 2,100 churches. Some 71
percent of black clergy reported that their churches engaged in many community
outreach programs, including day care, job search, substance abuse prevention,
and food and clothing distribution. 26 Black urban churches, they found,
were generally more engaged in outreach than rural ones. Though many urban
churches also engaged in quasi-political activities and organizing, few
received government money, and most clergy expressed concerns about receiving
government money; only about 8 percent of all the churches surveyed received
any federal government funds.27
A
number of site-specific and regional surveys of black churches followed the
publication of Lincoln and Mamiya’s book. So far, they all have been broadly
consistent with the Lincoln-Mamiya survey results on black church outreach. To
cite just two examples, in a survey of 150 black churches in Atlanta, NaomiWard
and her colleagues found that 131 of the churches were “actively engaged in
extending themselves into the community.” 28 And a survey of 635 Northern black
churches found that twothirds of the churches engaged in a wide range of “family-oriented
community outreach programs,” including mentoring, drug abuse prevention, teenage
pregnancy prevention, and other outreach efforts “directed at children and
youth.”29
The
data from the Lincoln-Mamiya surveys were reanalyzed in the course of a 1997
study of black theological education certificate programs (Bible institutes,
denominational training programs, and seminary nondegree programs). The study
was directed by Trulear in collaboration with Tony Carnes and commissioned by
the Ford Foundation.30 Trulear and Carnes compared certain of the
Lincoln-Mamiya survey results with data gathered in their own survey of 724
students representing twenty-eight theological certificate programs that
focused on serving black students. Three-quarters of those surveyed by Trulear
and Carnes reported that their church encouraged them “to be involved in my
local community,” more than half said relevance to “my community’s needs” was
of major importance to them in choosing a theological certificate program, and about
half were already involved in certain types of charitable community work.31
Religious
Racial Reconciliation
If
black church outreach is so potent, why is it that inner-city poverty, crime,
and other problems remain so severe? That is a fair question, but it can easily
be turned around: How much worse would things be in Boston and Austin,
Philadelphia and Los Angeles, and other cities were it not for largely unsung
faith-based youth and community outreach efforts? How much more would
government or charitable organizations need to expend, and how many new
volunteers would need to be mobilized, in the absence of church-anchored
outreach? The answers are “much worse” and “lots.”
Citizenswho
for whatever reasons are nervous about enhanced churchstate partnerships should
be reassured by the consistent findings that faithbased outreach efforts
benefit poor unchurched neighborhood children most of all, and that most
outreach ministries receive no government money. If these churches are so
willing to support “the least of these,” surely they deserve the support of the
rest of us—corporations, foundations, and, where appropriate, government
agencies.
Persons
of all faiths and of no faith should support black church outreach efforts. At
a minimum, the black church paramedics of inner-city America’s civil society
deserve the support of Christian churches, both black and white, both urban and
suburban.A genuine dialogue about racial reconciliation among Christians,
accompanied by a Christ-centered commitment to help—or to help those who
help—the inner-city minority poor, would light the way.
It is
morally wrong and socially myopic to turn our heads and harden our hearts to
the plight of the black inner-city poor. As Father Richard John Neuhaus has
argued, rather than merely exposing “liberal fatuities about remedying the ‘root
causes’ of poverty and crime . . . there must be another way. Just believing that
is a prelude to doing something. The something in question is centered in
religion that is both motive and means, and extends to public policy tasks that
should claim the attention of all Americans.”32 Say amen.
Notes
1. Stephan
Thernstrom and Abigail Thernstrom, America in Black and White: One
Nation,
Indivisible (New York: Simon & Schuster, 1997).
2. See:
National Research Council, A Common Destiny: Blacks and American Society
(Washington,
D.C.: National Academy Press, 1989), p. 274; Marcus Alexis and
Geraldine R.
Henderson, “The Economic Base of African-American Communities: A
Study of
Consumption Patterns,” in National Urban League, The State of Black America
1994 (New York:
National Urban League, January 1994), p. 81; Robert B. Hill et al.,
Research on the
African-American Family: A Holistic Perspective (Westport,
Conn.:
Auburn House,
1993), p. 2; Council of Economic Advisors, Changing America: Indicators
of Social and
Economic Well-Being by Race and Hispanic Origin (Washington,
D.C.: President’s
Initiative on Race, September 1998), p. 33.
3. John J.
DiIulio Jr., “State of Grace,” National Review, December 22,
1997, pp.
62–66.
4. Robert B.
Hill, “The Black Middle Class: Past, Present, and Future,” National
Urban League:
The State of Black America 1986 (New York: National Urban League,
1986), pp.
43–64.
5. Council of
Economic Advisors, Changing America, p. 38.
6. George
Gallup Jr., Emerging Trends, Princeton Research Center 18 (March
1996):
5. See also
Richard Morin, “Keeping the Faith: A Survey Shows the United States Has
the Most
Churchgoing People in the Developed World,” Washington Post Weekly
Edition.
7. George
Gallup Jr., “Religion in America: Will the Vitality of Churches Be the
Surprise of the
Next Century?” Public Perspective, October–November 1995, p. 4.
8. Andrew
Greely, “The Other Civic America: Religion and Social Capital,” American
Prospect 32 (May–June
1997): 70
9. Ibid., p.
72.
10. Gallup, “Religion
in America,” p. 2.
11. James Q.
Wilson, “Two Nations,” paper delivered as Francis Boyer Lecture,
American
Enterprise Institute, December 4, 1997, p. 10.
12. See David
B. Larson et al., Scientific Research on Spirituality and Health (Radnor,
Pa.: John M.
Templeton Foundation, October 1, 1997).
13. David B.
Larson and Byron Johnson, “Systematic Review of Delinquency Research,”
preliminary
draft, 1998, and personal correspondence with Larson, September
1, 1998.
14. T. David
Evans et al., “Religion and Crime Reexamined: The Impact of Religion,
Secular
Controls, and Social Ecology on Adult Criminality,” Criminology 33, no. 2
(1995): 211–12.
15. Patrick
Fagan, “Why Religion Matters: The Impact of Religious Practice on
Social
Stability,” Heritage Foundation Backgrounder, no. 164 ( January 25, 1996).
16. Richard B.
Freeman, “Who Escapes? The Relation of Church-Going and Other
Background
Factors to the Socio-Economic Performance of Black Male Youths from
Inner-City
Poverty Tracts,” working paper no. 1656, National Bureau of Economic
Research,
Cambridge, Mass., 1985.
17. David B.
Larson and Byron Johnson, “Who Escapes? Revisited,” final draft,
1998, and
personal correspondence with Larson, September 1, 1998.
18. Andrew
Billingsley, “The Social Relevance of the Contemporary Black Church,”
National Journal
of Sociology 8, nos. 1 and 2 (summer–winter 1994): 3.
19. Interview
with the author, June 1998.
20. Jeremy
White and Mary de Marcellus, draft of Faith-Based Outreach to At-Risk
Youth in
Washington, D.C.: Report of the Partnership for Research on Religion and
At-Risk Youth (Philadelphia: Public/Private Ventures,
forthcoming).
21. Ibid., p.
4, 6.
22. Ibid., p.
1.
23. Tobi
Jennifer Printz, Faith-Based Service Providers in the Nation’s Capital: Can
They Do More? (Washington,
D.C.: Urban Institute, April 1998).
24. Diane Cohen
and A. Robert Jaeger, Sacred Places at Risk (Philadelphia: Partners
for Sacred
Places, 1998).
25. Eric C.
Lincoln and Lawrence H. Mamiya, The Black Church in the
African-American Experience (Durham, N.C.: Duke University Press, 1990).
26. Ibid., p.
151.
27. Ibid., p.
15.
28. NaomiWard
et al., “Black Churches in Atlanta Reach Out to the Community,”
National Journal
of Sociology 8, nos. 1 and 2 (summer–winter 1994): 59.
29. Roger H.
Rubin et al., “The Black Church and Adolescent Sexuality,” ibid., pp.
131, 138.
30. Harold Dean
Trulear and Tony Carnes, A Study of the Social Service Dimension
of Theological
Education Certificate Programs: The 1997 Theological Certificate Program
Survey, submitted to
the Ford Foundation, November 1, 1997.
31. Ibid., pp.
34, 40–41.
32. Richard
John Neuhaus, “The Public Square: A Continuing Survey of Religion
and Public
Life,” First Things 81 (March 1998): 63–65.
==============================
PART THREE — ECONOMICS
Discrimination, Economics, and Culture
THOMAS
SOWELL
Racial
discrimination is usually not very discriminating, in the sense in
which a wine connoisseur is discriminating in being able to detect subtle
differences in tastes, aromas, or vintages. When Marian Anderson was refused
permission to sing in Washington’s Constitution Hall in 1939, it had nothing to
do with her characteristics as a singer or as a person. She was black and that
was it. Similarly in baseball, before Jackie Robinson broke the color line in
1947, no one cared what kind or quality of pitcher Satchel Paige was or how
powerful a slugger Josh Gibson was. They were black and that was enough to keep
them out.
If we
are to examine discrimination and its consequences today, we cannot be as
indiscriminate as the racists of the past or present. We must make
distinctions—first as to some consistent meaning of the word “discrimination” and
then in deriving criteria for determining when it applies. We must also
distinguish discrimination from other social or cultural factors that produce
economic and other differences in outcome for different individuals and groups.
Meanings
of Discrimination
To
many—perhaps most—Americans, there is racial discrimination when different
rules and standards are applied to people who differ by race. To these
Americans, there is “a level playing field” when the same rules and the same
standards apply to everybody, regardless of race. As traditional as this
meaning of discrimination has been, a radically different conception of
discrimination has a strong hold on many in the media and the academic world
today, as well as among political and legal elites. For them, differences in “life
chances” define discrimination. If a black child does not have the same
likelihood as a white child of growing up to become an executive or a
scientist, then there is racial discrimination by this definition, even if the
same rules and standards are applied to both in schools, the workplace, and
everywhere else.
For
those with this definition of discrimination, creating “a level playing field”
means equalizing probabilities of success. Criteria which operate to prevent
this are considered by them to be discriminatory in effect, even if not in
intent.
Whatever
definition—and accompanying set of policies—one believes in, a serious
discussion of racial discrimination or of racial issues in general requires
that we lay our cards face up on the table and not hide behind ambiguous and
shifting words that render any attempt at dialog futile and ultimately
poisonous.
For
purposes of our discussion here, the definition of “discrimination” will be the
traditional one. Other views behind other definitions will not be dismissed,
however, but will in fact be examined closely.
Cause
and Effect
Definitions
are not chosen out of thin air. Underlying different definitions of racial
discrimination are different beliefs about the way the world operates. So long
as these beliefs confront each other only as opposing dogmas, there is no
resolution other than by trying to shout each other down or prevail by force,
whether political or physical. Many people believe that differences in life
chances or differences in socioeconomic results are unusual, suspicious, and
probably indicative of biased or malign social processes that operate to the
detriment of particular racial and other groups.
While
there have certainly been numerous examples of discrimination— in the
traditional sense of applying different rules or standards to different
groups—in the United States and in other countries around the world, that is
very different from claiming the converse, that group differences in prospects
or outcomes must derive from this source.
Intergroup
differences have been the rule, not the exception, in countries around the
world and throughout centuries of history.
Today,
one need only turn on a television set and watch a professional basketball game
to see that the races are not evenly or randomly represented in this sport and
are not in proportion to their representation in the general population of the
United States. Racially, the teams do not “look like America.”
Although
not visible to the naked eye, neither do the beer companies that sponsor this
and other athletic events. Most, if not all, of the leading beer-producing
companies in the United States were founded by people of German ancestry. So
were most of the leading piano manufacturers. Nor is German domination of these
two industries limited to the United States. The kind of demographic
over-representation in particular lines of work found among blacks in
basketball or Germans in beer brewing and piano-making can also be found among
Jews in the apparel industry—not just in contemporary New York but also in the
history of medieval Spain, the Ottoman Empire, the Russian Empire, Brazil,
Germany, and Chile. At one time, most of the clothing stores in Melbourne were
owned by Jews, who have never been as much as one percent of the Australian
population. Most of the people laying cable in Sydney, Australia, are of Irish
ancestry. All the billionaires in Thailand and Indonesia are of Chinese
ancestry. Four-fifths of the doughnut shops in California are owned by people of
Cambodian ancestry. The list goes on and on.
It
would be no feat to fill a book with statistical disparities that have nothing
to do with discrimination.1 What would be a real feat would be to get people to
realize that correlation is not causation—especially when the numbers fit their
preconceptions.
Very
often the groups predominating in a particular field have no power to keep
others out, except by excelling in the particular activity. Blacks cannot discriminate
against whites in basketball, where the franchises are owned by whites. The
Chinese minority in Malaysia or Indonesia cannot stop Malaysians or Indonesians
from opening businesses, though historically most of the major domestic
enterprises in both countries were created by people of Chinese ancestry. Nor
could immigrants from India stop either blacks or whites from opening
businesses in Kenya, though Indian entrepreneurs were once so predominant in
Kenya and other parts of East Africa that the rupee became the predominant
currency in that region.
Some
statistical disparities are of course caused by discrimination, just as some
deaths are caused by cancer. But one cannot infer discrimination from
statistics any more than one can infer cancer whenever someone dies. The
absence of corroborating evidence of discrimination has forced some into
claiming that the discrimination has been so “subtle,” “covert,” or “unconscious”
as to leave no tangible evidence. But this method of arguing— where both the
presence and the absence of empirical evidence prove the same thing—would prove
anything about anything, anywhere and any time.
Sources
of Differences
Perhaps
the most sweeping explanation of intergroup differences is that people are
innately, genetically different and that these differences permeate everything
they do. As Madison Grant put it in his best-selling book The Passing of
the Great Race in the early twentieth century, “race is
everything.”
Virtually
no one believes that any more and the Nazis revolted the world by showing where
such doctrines can lead. However, the innate inferiority doctrine remains
important socially and politically because it is an ominous presence in the
background of discussions about other immediate practical issues. Much of the
tone and substance of what is said today reflects a desire of many whites to
escape the charge of racism and of many blacks to escape the charge of
inferiority. A whole range of current trends, from cultural relativism to
bombastic Afrocentrism, are hard to explain on their own intrinsic merits,
without reference to the ominous racial doctrines that they are seeking to
exorcise.
Without
getting into the IQ controversy that I have dealt with elsewhere, 2 history
alone makes it hard to believe in fixed or innate superiority or inferiority
among the peoples of the world. A thousand years ago, the Chinese were clearly
far more advanced than the Europeans, whether technologically, organizationally,
or economically. Equally clearly, that relationship has reversed in recent
centuries—without any corresponding changes in the genetic makeup of either the
Chinese or the Europeans. Within a much shorter period of time, Eastern
European Jews in the United States went from having below-average scores on
intelligence tests during the First World War to having above-average scores on
such tests within one generation afterward.
The
enormous variety of geographic, cultural, demographic, and other variables
makes an even, random, or equal distribution of skills, values, and
performances virtually impossible. How could mountain peoples be expected to
have seafaring skills? How could an industrial revolution have occurred in the
Balkans, where there are neither the natural resources required for it nor any
economically feasible way of transporting those resources there? How could the
indigenous peoples of the Western Hemisphere have transported the large loads
that were transported overland for great distances in Europe and Asia, when
theWestern Hemisphere had no horses, oxen, camels or other comparable beasts of
burden?
Add to
this great differences in the flora, fauna, climate, disease environments, topography
and fertility of land from one region of the world to another, among other
variables, and the prospects of equal achievements among peoples whose cultures
evolved in very different settings shrinks to the vanishing point, even if
every individual in the world had identical genetic endowments at the moment of
conception.
Nor
are the effects of these environmental factors likely to vanish immediately
when people from a given culture in a given environment move to another culture
in another environment. Particular skills and general attitudes may follow the
same people around the world. Given that Germans were brewing beer in the days
of the Roman Empire, there is no reason to be surprised that they continued to
brew beer in Milwaukee, St. Louis, Buenos Aires, and Australia’s Barossa
Valley. Even when two groups begin to acquire skills initially foreign to both,
they may do so making different choices and applying themselves to different
things. During the decade of the 1960s, the Chinese minority in Malaysia earned
more than four hundred engineering degrees, while the Malay majority earned
just four. Nor can such differences be reduced to external differences in the immediate
environment, for the Malays had preferential access to financial aid for higher
education. But they came from a culture very different from that of the
Chinese.
Just a
superficial glance like this suggests something of the innumerable factors
operating against the even or random distribution of peoples in different
activities and institutions that is assumed as a baseline for measuring discrimination
statistically. In some cases we can trace through history the particular skills
that led to the dominance of one group or another in particular industries or
occupations. But in other cases we cannot. In no case can we presuppose that
the distribution would be random in the absence of discrimination.
Empirical
Evidence
If we
cannot rely on simple statistical differences, presuppositions, or definitions
to determine how much discrimination exists, much less its actual effects on
end results, then we must depend on corroborating empirical evidence. How much
income difference, for example, is there between blacks and whites with the
same objective qualifications? Do these qualifications predict future
performances of each group equally or for either group validly? What of
cultural bias in these criteria?
If our
purpose is to weigh beliefs against facts, rather than simply to generate
plausible-sounding propaganda, then we must consider whether the inputs or the
output that we are measuring are really the same. Family income data, for
example, can be wholly misleading if the families differ in size from group to
group and from one time period to another.
American
families and households have been declining in size over the years, as parents
have fewer children and children are better able to afford their own living
quarters in early adulthood. Black families are smaller than white families,
due to more breakups of marriage and more failures to get married in the first
place. Moreover, higher income families average substantially more people per
household.
An individual,
however, always means one person, regardless of race or income, so per capita
income data can present a very different picture from that deriving from family
or household income data. Real income per black household rose only 7 percent
from 1967 to 1988, but real income per black person rose 81 percent over the
same span. On a household basis, blacks’ average income was a lower percentage
of whites’ average income at the end of this period than at the beginning but,
on a per person basis, blacks were earning a significantly higher percentage of
what whites were earning in 1988 than in 1967.3 Needless to say, those who deal in
politicized indignation prefer to cite family or household data. But if we are
talking about job discrimination,we are talking about what happens to
individuals. Employers do not employ households.
As far
back as 1969, black males who came from homes where there were newspapers,
magazines, and library cards had the same incomes as white males from similar
homes and with the same number of years of schooling.4 In the
1970s, black husband-and-wife families outside the South earned as much as
white husband-and-wife families outside the South.5 By 1981,
for the country as a whole, black husband-wife families where both were college
educated and both working earned slightly more than
white families of the same description.6 By 1989, black, white, and Hispanic
males of the same age (29) with the same IQ (100) who worked year-around all averaged
between $25,000 and $26,000 in annual income.7
In
various ways, these data all tell the same story—that similar cultural inputs
lead to similar economic outputs across racial lines. Note, however, that these
inputs are somewhat more sharply defined here than in most intergroup
comparisons, such as all black high school graduates versus all white high
school graduates or all blacks with bachelor’s degrees or Ph.D.s versus all
whites with high school diplomas, bachelor’s degrees or Ph.D.s. On average, the
pre-college educations of blacks and whites have never been equal. During the
Jim Crow era in the South, blacks did not even go to school as many days in a
year as whites, so that a black individual with 9 years of education might have
been in school no more days than a white individual with 6 years of education.
Even after the numbers of days in school were brought into line, the resources
put into the schools were not the same and, after that had been remedied to
some extent, large differences in test scores showed that the two groups of
students were not learning the same, for whatever reasons.
At
both the college and postgraduate levels, black and white degrees do not mean
the same. First of all, they differ in the fields in which the students
specialize—as do various groups in other countries around the world. Regardless
of how much of these differences are due to discriminatory provision of
education by government, or to differences in cultural values or other causes,
when we are measuring education as an input that contributes to economic output,
we are comparing apples and oranges if our comparisons of blacks and whites
does not go beyond paper credentials.
In
those cases where the statistics permit a finer breakdown that includes
qualitative measures, the racial gap shrinks or disappears. We have already
seen that with black, white, and Hispanic year-around workers with the same
IQs. An earlier (1975) study of black, white, and Asian professors with Ph.D.s
from departments of the same quality ranking and with similar numbers of
publications showed the blacks generally earning at least as much as the whites
and usually more than Asians with the same qualifications. 8
If our
definition of a level playing field is applying the same rules, standards, and
rewards, regardless of race, that was approximated years ago. But if our
definition is equal prospects of success, then none of these data indicate
that, for different proportions of different groups come from homes with
library cards or from good quality schools and different proportions of them
are in different regions of the IQ distribution. All these are serious social
problems but they are not employer discrimination— and talking as if they are
only distracts attention from the real causes that need attention.
In
many other areas as well, discrimination has been claimed on the basis of
statistics which treat people as comparable who are not in fact comparable. For
example, the fact that black applicants for mortgage loans are turned down at a
higher rate than white applicants has been widely cited as proof of racism
among lending institutions. The Washington Post, for
example, reported that a “racially biased system of home lending exists”9 and
Jesse Jackson called it “criminal activity” that banks “routinely and systematically
discriminate against African-Americans and Latinos in making mortgage loans.”10 But
the very same data also showed that whites were turned down at a higher rate
than Asian Americans.11 Was that proof of racism against whites, and in
favor of Asians? Of course not.
A widely-cited
Federal Reserve study of racial disparities in mortgage loan approval rates did
not control for net worth, nor take into account the loan applicants’ credit
histories or their existing debts.12 Nor was “the adequacy of collateral”
included.13 When a more detailed follow-up study was done for
the Boston area by the Federal Reserve Bank of Boston, it was discovered that
in fact black and Hispanic applicants for mortgage loans had greater debt
burdens, poorer credit histories, sought loans covering a higher percentage of
the value of the properties in question, and were also more likely to seek to
finance multiple-dwelling units rather than singlefamily homes.14 Loan
applications for multiple-dwelling units were turned down more often among both
white and minority applicants but obviously affect the rejection rate more so
among the latter, since they applied more often for loans for such units.15 Even
among those applicants whose loans were approved—and the majority of both
minority and white applicants had their loans approved—minority borrowers had
incomes only about three-quarters as high as whites and assets worth less than
half the value of the assets of the white borrowers.16
None
of this implies that subjective prejudice has vanished. But a whole field of
the economics of discrimination has been created by Nobel Prizewinning economist
Gary Becker to show how the translation of subjective prejudice into actual
discrimination can be very costly to the discriminator. One need only imagine a
basketball franchise owner who refuses to hire blacks to see how financially
ruinous it can be.
Nothing
is easier than to find statistical disparities between groups. They exist in
countries around the world, with and without discrimination, and many of these
intergroup disparities in income, education, and other factors are greater than
black-white differences in the United States. Merely parading these disparities
may be sufficient for political purposes. But, if the purpose is to improve the
condition of the less fortunate, then discrimination must be investigated in a
more discriminating manner and other causes dealt with when they turn out to be
more salient.
None
of this means that prejudice and discrimination are things of the past. What it
does mean is that their actual socioeconomic effects are an empirical question,
not a foregone conclusion. Few would doubt that there has been more prejudice
and discrimination against blacks in the United States than in Brazil. Yet
black Americans have achieved higher incomes, both absolutely and relative to
white incomes, than is the case in Brazil.17 Discrimination is just one factor
among many and cannot be automatically presupposed to be the most powerful
factor, however politically convenient that assumption might be.
In
practical terms, there is neither unlimited time nor unlimited resources available
for dealing with racial issues. In order to maximize the impact of those
resources, we must first decide whether our top priority is to smite the wicked
or to help the less fortunate.
Implications
No one
can be happy when life chances are so radically different among racial or other
groups, especially when this means that serious prospects of rising out of
poverty may be gone before a child’s age reaches double digits. If we mean to
improve this situation substantially, then we cannot simply “round up the usual
suspects,” such as discrimination. Nor can we let the ghost of Madison Grant or
of Adolf Hitler paralyze us from recognizing factors internal to various groups
themselves. If Asian children are more likely to catch grief from their parents
when they bring home report cards with Bs than black children are when they
bring home report cards with Cs, then do not be surprised if Asian youngsters
end up with higher grade point averages in school and higher test scores after
years of such differences. It would be astonishing if it were otherwise.
Preoccupation
with discrimination also distracts from achievements from within the black
community, even in the face of racial discrimination. For example, in 1899
there were four academic high schools in Washington— three white and one black.
In standardized tests given that year, the black high school scored higher than
two of the three white academic high schools. Yet, nearly a century later, it
would be considered utopian, by almost anyone, to set as a goal that black high
schools score higher on standardized tests than most white high schools in the
same city—especially if that city isWashington, D. C.18 Nor
was this a one-time fluke. That same school repeatedly met or exceeded the
national average in IQs for decades and sent more of its graduates on to
college than most white high schools around the country.19
We
need not speculate on what can be done or assume that only esoteric programs
can succeed. Success has already been achieved in many black schools and in
many black families, usually by doing the same kinds of things that have
brought success to white or Asian schools and white or Asian families.
Aword
may be in order about “cultural bias” and the quest for “culturefree” tests. If
cultural bias means that a given criterion will not predict either academic
success or career success as accurately for one group as for another, then that
is a purely empirical proposition that can be and has been tested innumerable
times—and it has been found to be wrong innumerable times, not only as regards
blacks in the United States but also as regards Indonesians halfway around the
world.20
As for
“culture-free” tests, they would be relevant only in a culturefree society—and
there is no such society anywhere. Even the most primitive societies in the
world today contain a wealth of skills that an outsider would be hard-pressed
to master.
Any
success or failure, anywhere in the world, is going to take place in a given
culture. We need not question whether blacks can succeed in the current
American culture because there is no way to declare impossible what has already
happened, often despite considerable opposition. The question is whether
increasing the odds of more success can take precedence over the politically
more tempting goal of rounding up the usual suspects and sounding the usual
rhetoric.
Notes
1. Numerous,
documented examples can be found in just two recent books of
mine: Conquests and
Cultures (Basic Books, 1998), pp. 43, 124, 125, 168,
221–222;
Migrations and
Cultures (Basic Books, 1996), pp. 4, 17, 30, 31, 567, 118,
121, 122–123,
126, 130, 135,
152, 154, 157, 158, 162, 164, 167, 176, 177, 179, 182, 193, 196, 201, 211,
212, 213, 215,
224, 226, 251, 258, 264, 265, 275, 277, 278, 289, 290, 297, 298, 300, 305,
306, 310, 313,
314, 318, 320, 323–324, 337, 342, 345, 353–354, 354–355, 355, 356, 358,
363, 366,
372–373. Extending the search for intergroup statistical disparities to the
writings of
others would of course increase the number of examples exponentially,
even when
leaving out those cases where discrimination might be a plausible cause of
the
disparities.
2. “New Light
on Black IQ,” New York Times, March 27, 1977, pp. 15 ff; “Ability
and Biology,” Newsweek, September 8,
1997, p. 14; Race and Culture, chap. 6.
3. Compare U.
S. Bureau of the Census, Current Population Reports, Series P-60,
No. 167, pp. 9,
68.
4. Richard B.
Freeman, Black Elite (New York: McGraw-Hill, 1976), chap. 4.
5. U. S. Bureau
of the Census, Current Population Reports, Series P-23, No. 80
(Washington: U.
S. Government Printing Office, no date), p. 44.
6. U. S. Bureau
of the Census, Current Population Reports, Series P-20, No. 366
(Washington: U.
S. Government Printing Office, 1981), pp. 182, 184.
7. Richard J.
Herrnstein and Charles Murray, The Bell Curve: Intelligence and
Class
Structure in
American Life (New York: The Free Press, 1994), p. 323.
8. American
Council on Education data are tabulated and presented in Thomas
Sowell, “Affirmative
Action in Faculty Hiring,” Education: Assumptions versus History
(Stanford:
Hoover Institution Press, 1986), pp. 85–87.
9. Joel Glenn
Brenner, “A Pattern of Bias in Mortgage Loans,” Washington Post,
June 6, 1993,
p. A 1.
10. Jesse
Jackson, “Racism is the Bottom Line in Home Loans,” Los Angeles
Times,
October 20,
1991, p. B 5.
11. See, for
example, Paulette Thomas, “Blacks Can Face a Host of Trying Conditions
in Getting
Mortgages,”Wall Street Journal, November 30, 1992, p. A 8.
12. Paulette
Thomas, “Behind the Figures: Federal Reserve Detail Pervasive Racial
Gap in Mortgage
Lending,”Wall Street Journal, March 31, 1992, p. A 1.
13. Glenn B.
Canner, “Expanded HMDA Data on Residential Lending: One Year
Late,” Federal Reserve Bulletin, November
1992, p. 801.
14. Alicia H.
Munnell, Mortgage Lending in Boston: Interpreting HMDA Data,
Working Paper
No. 92-7, October 1992, Federal Reserve Bank of Boston, pp. 2, 24, 25.
15. Ibid., p.
25.
16. Ibid., p.
24. Some further problems of the study are discussed in Peter Brimelow
and Leslie
Spencer, “The Hidden Clue, Forbes, January 4, 1993, p. 48.
17. See data
and sources in ThomasSowell, Conquests and Cultures:AnInternational
History (New York:
Basic Books, 1998), p. 168.
18. Henry S.
Robinson, “The M Street High School, 1891–1916,” Records of the
Columbia
Historical Society of Washington, D. C., Vol. LI (1984), p. 122.
19. TheMStreet
School was subsequentlyrenamed Dunbar High School. Its history
has been
sketched in Thomas Sowell, “Black Excellence: The Case of Dunbar High
School,” The Public
Interest, Spring 1974, pp. 3–21. See also Mary Gibson
Hundley,
The Dunbar Story
(New
York: Vantage Press, 1965).
20.
Numerousstudies can be found cited in Thomas Sowell, Conquests and
Cultures,
p. 474 (footnote
99).
==============================
Half Full or Half Empty? The Changing Economic
Status of African Americans, 1967–1996
FINIS
WELCH
We hear
so much about crime, drugs, school dropouts, low-quality
schools, low wages, unemployment, teen pregnancy, children in single-parent
homes, etc., among African Americans that it is hard to imagine that things are
getting better. And, even if they are, the part of us that demands social
justice wonders whether a sorry past excuses a sorry present. But every student
of change understands that lasting improvement occurs slowly and that anyone
with an eye to the future needs to examine the past. Half full is half empty,
but half full and filling is better than half empty and emptying.
This
essay offers a brief history of change in the labor market status of African
Americans over the past three decades. Beginning with the good news, I examine
trends in wages, education, occupations, and industry. Although I conclude on a
pessimistic note concerning employment, I believe the gains have been so
impressive that they deserve much greater recognition and appreciation than
they have generally received.
Most
of the numbers reported here are calculated from the March Annual Demographic
Supplement to the Current Population Survey (CPS), 1968–1997. The Survey is
collected by the U.S. Census Bureau for the Bureau of Labor Statistics and
usually includes responses for individuals in 50,000–60,000 households. The
wage and employment levels are for the year preceding each Survey, so the
analysis spans the thirty years 1967– 1996.
Growing
Inequality in the Structure of Wages
The
past three decades have brought remarkable changes in the structure of
wages.Wage gaps have widened in the aggregate as well as in several narrowly
focused dimensions. In particular, the wages of those with more education have
increased sharply in comparison with wages of those with less.
Table
1 describes educational differentials in weekly wages for black and white men.
Look first at the figures in the bottom panel of the table. During the first
five-year period, 1967–1971, young white male college graduates earned 40.5
percent more on average than white males with no more than a high school
diploma. The corresponding differential for black men was 51.9 percent. The
higher premium for black college graduates, it is important to note, was a
recent development. At the time of the 1960 U.S. Census, schooling paid black
men far less than it paid white men. But since the mid-1960s, the economic
incentives for staying in school as long as possible have been pretty much the
same for blacks and whites. That does not mean that African American men had
the same average earnings as whites; as we shall see shortly, that was far from
the case. But the advantage that blacks with a lot of schooling had over their
brethren with little schooling was actually a little greater than it was for
whites.
Table
1 Percentage Differences in Average Weekly Wages Between Men with the Indicated
Levels of Education and Wages of High School Graduates Less than 10 Years Out
of School
|
Years |
White |
Black |
|
high school dropout |
|
|
|
1967–71 |
-18.1 |
-20.8 |
|
1972–76 |
-21.6 |
-26.2 |
|
1977–81 |
-22.7 |
-25.9 |
|
1982–86 |
-26.9 |
-28.8 |
|
1987–91 |
-26.8 |
-29.6 |
|
1992–96 |
-30.1 |
-27.4 |
|
some college |
|
|
|
1967–71 |
19.2 |
22.0 |
|
1972–76 |
19.8 |
19.4 |
|
1977–81 |
18.7 |
25.6 |
|
1982–86 |
27.5 |
33.2 |
|
1987–91 |
33.5 |
38.9 |
|
1992–96 |
35.0 |
50.8 |
|
college graduates |
|
|
|
1967–71 |
40.5 |
51.9 |
|
1972–76 |
41.7 |
45.5 |
|
1977–81 |
40.3 |
57.1 |
|
1982–86 |
63.3 |
86.5 |
|
1987–91 |
83.2 |
83.9 |
|
1992–96 |
96.1 |
97.4 |
Note:
Wages
are imputed for those who did not work 40+ weeks or 35+ hours. The
imputation includes the usual demographic factors—age, race, education—as well
as weeks worked and usual hours per week (bottom coded at 35). To preserve
dispersion, the imputation also includes a randomly selected empirical residual
from the full-time/full-year sample used to generate the fitted values. College
graduates include those with postgraduate education. The wage used for college
graduates is a fixedweight average of the average for those with exactly 16
years of schooling and the average for those with more.
Over
the past thirty years, Table 1 reveals, the rewards of being well educated have
grown strikingly. The differentials of the 1990s are far greater than in the
1960s. This is true whether we examine the wage disadvantage experienced by
high school dropouts (shown in the top panel of Table 1), the advantage those
with some college (the center panel) had over high school graduates, or the
advantage enjoyed by college graduates (bottom panel). After a brief and slight
decline in the mid-to-late 1970s, the college wage premium for men has
continued to grow and is now at the highest level at any time in the entire
postwar period. In their first decade out of school, young male college graduates
currently earn roughly twice as much as high school graduates, a premium almost
double that of three decades earlier, and one as great for blacks as for
whites.
Table
2 Ratios of Weekly Wages, 90th Percentile/10th Percentile (Ratios are measured
relative to the 1967 value, 3.38, for white men)
|
|
men |
|
women |
|
|
Years |
White |
Black |
White |
Black |
|
1967–71 |
1.00 |
1.16 |
0.99 |
1.51 |
|
1972–76 |
1.13 |
1.17 |
0.96 |
1.10 |
|
1977–81 |
1.29 |
1.28 |
0.96 |
0.99 |
|
1982–86 |
1.56 |
1.53 |
1.09 |
1.06 |
|
1987–91 |
1.61 |
1.62 |
1.21 |
1.17 |
|
1992–96 |
1.75 |
1.72 |
1.30 |
1.24 |
Note:
As in
Table 1, wages are imputed for those men not full-time/full-year. However,
observations for women are restricted to full-time/full-year. The centile
location is 100n/(N+1). The average for centiles 5.5 - 14.5 is the
first decile wage; the average for centiles 85.5 - 94.5 is the
ninth decile wage.
While
the wages of college graduates were rising relative to those of high school
graduates, the wages of high school dropouts were falling relative to those of
high school graduates. Again, there are no major racial differences in the
pattern. Education is paying ever larger dividends in the labor market.
These
figures are averages. A more refined way of looking at recent trends in wage
inequality is provided in Table 2. In the years 1967–1971, white men at the
90th centile (at the bottom of the top tenth of the wage distribution, that is)
earned 3.38 times as much per week as white men at the 10th centile (at the top
of the bottom tenth of the distribution). Black men near the top of the earnings
distribution had an even bigger advantage over those close to the bottom than
the 3.38 figure for whites; the wage difference between black males at the 10th
and 90th centiles was 16 percent higher than it was for whites.
What
has changed since the 1960s? The phenomenal growth in wage inequality among men
over the next three decades is the most important trend visible in Table 2. By
the 1990s, the spread between the 10th and the 90th centiles was approximately
75 percent greater than it had been 25–30 years earlier for both white and
black men.
This
increase in the dispersion of wages means that wages that were below the mean
were falling relative to the mean, while wages above the mean were rising
relative to the mean; the lower the wage, the greater the relative decline, and
the higher the wage, the greater the relative increase. If the increased
dispersion of wages shown in Table 2 was equally the result of rising real
wages for those at the top and falling real wages for those at the bottom—probably
not far from the truth—it would mean that the purchasing power of the 90th
centile wage increased 37.5 percent, while the 10th centile wage fell 37.5
percent between the late 1960s and the mid-1990s.
The
trend toward increased inequality was much less pronounced for female workers.
The increase in wage dispersion was 30 percent for white women, well under half
of that for men of both races. Among black women, somewhat puzzlingly,
inequality was at its greatest at the beginning of the period studied, in
1967–1971.1 It then fell to the same level as that for white women
and grew thereafter at the same slow pace as among white women.
Racial
Differences in Wages
In an
earlier paper, James P. Smith and I compared the wage position of black men
relative to white men using the 1940–1980 decennial U.S. Censuses. Comparing
ratios of average wages, we found remarkable progress for black men during the
1940s, followed by a distinct slowing in the 1950s. In the 1960s, the wages of
blackmen again increased substantially more than those of whites.
Table
3 Median Weekly Wages of Full-Time Year-Round Workers
(Wages
are PCE deflated and measured relative to 1967 values for white men)
|
|
men |
|
women |
|
|
Years |
White |
Black |
White |
Black |
|
1967–71 |
106.1 |
71.5 |
58.9 |
46.6 |
|
1972–76 |
109.2 |
76.0 |
63.3 |
56.7 |
|
1977–81 |
104.6 |
73.0 |
63.9 |
60.4 |
|
1982–86 |
98.4 |
65.1 |
67.7 |
63.5 |
|
1987–91 |
97.6 |
66.6 |
71.0 |
65.7 |
|
1992–96 |
92.9 |
66.1 |
72.8 |
65.5 |
Note:
Wages
are imputed for men who were not full-time (usual hours less than 35 per week)
or fullyear (less than 40 weeks worked). Observations for women are restricted
to those who were full-time/ full-year.
What
has happened since? In the 1970s, 1980s, and 1990s, the sharp growth in wage
dispersion would lead us to expect that the black/white ratio of average wages
would fall because wages were becoming more disperse and the average wage of
blacks was below that of whites. This gloomy scenario has not come about. Black
males have not fallen further behind whites; they have made further gains,
though not large ones. And black women have improved their economic position
quite spectacularly.
Table
3 sets forth the evidence on median wages indexed to 1967 values for white men
(i.e., the 1967 average wage for them is 100.0). For white men, the 1967–1971
average of 106.1 had fallen to 92.9 by 1992–1996. This represents a 12.4
percent drop in real wages over this thirty-year period.2
The
1967–1971 median wage earned by black men was 71.5 percent of that of white
males in 1967, and it fell to 66.1 percent for the most recent interval, a
decline of 7.6 percent. Over the three decades, the median wages of black and
white men moved on approximate parallel paths. Both were declining somewhat,
though the drop was a bit less for black men than for white men.
The
picture for women, white and black, is much brighter. Instead of declining or
remaining stagnant, the median wage of black women compared with that of white
males in 1967 increased by a remarkable 40.6 percent over the next three
decades. For white women, the gain over the same period was a healthy 23.6
percent.
These
are significant facts, but no single measure of black/white wage differentials
(“the” gap) is adequate. Table 4 uses an alternative, more complex method for
comparing wages of black men and black and white women to the wages of white
men. Table 4 is divided into four panels. Panel A compares wages of all black
men with those of white men. In panel B, the wages of black men are matched to
those of white men of the same age and education. Panels C and D compare black
women and white women, respectively, with white men.
The
top row of each of panel gives as a reference the position of white men in
their own wage distribution. If, for example, we assign each man a wage
centile, analogous to a test score percentile, then because there would be
equal numbers at each centile from 0 to 100, the average would be 50. The next
three measures provide, respectively, population percentages exceeding the
three wage quartiles, the 25th, 50th, and 75th centiles. In the referenced
distribution, 75 percent of white men have wages above the first quartile
simply because that defines the first quartile. Similarly, 50 percent exceed
the median or second quartile, and 25 percent exceed the third quartile.
The
first point of comparison is the average centile location of the wages of other
groups in the wage distribution of white men. In 1967– 1971, the average
centile location of black men in the distribution of white men’s wages was
27.2. That means that if we were to select a number of white men at random for
comparison with an equal number of randomly selected black men in those years,
the black man has the higher wage in only 27.2 percent of the pairs.
Conversely, in 72.8 percent of the pairs the white man would come out on top.
Table
4 Comparisons with Weekly Wages of White Men: Centile Averages and Percentages
Exceeding Indicated Quartiles in the Wage Distribution of White Men
|
|
|
quartile |
|
|
|
Years |
Average centile |
First |
Second |
Third |
|
a.
all black men, uncorrected for age and education |
|
|
|
|
|
Reference |
50.0 |
75.0 |
50.0 |
25.0 |
|
1967–71 |
27.2 |
41.8 |
19.7 |
7.0 |
|
1972–76 |
30.4 |
48.1 |
22.7 |
7.3 |
|
1977–81 |
33.3 |
52.8 |
26.4 |
8.9 |
|
1982–86 |
33.3 |
53.0 |
25.8 |
8.9 |
|
1987–91 |
34.7 |
54.9 |
28.4 |
10.4 |
|
1992–96 |
36.5 |
58.0 |
30.8 |
11.3 |
|
b.
all black men, matched on age and education |
|
|
|
|
|
Reference |
50.0 |
75.0 |
50.0 |
25.0 |
|
1967–71 |
31.4 |
47.6 |
24.9 |
10.2 |
|
1972–76 |
34.5 |
53.8 |
28.1 |
11.1 |
|
1977–81 |
36.5 |
57.5 |
30.6 |
11.4 |
|
1982–86 |
35.8 |
57.0 |
28.6 |
10.5 |
|
1987–91 |
37.2 |
58.4 |
31.4 |
12.5 |
|
1992–96 |
38.8 |
59.8 |
34.3 |
14.2 |
|
c.
full-time/year-round black women |
|
|
|
|
|
Reference |
50.0 |
75.0 |
50.0 |
25.0 |
|
1967–71 |
11.9 |
15.1 |
4.7 |
0.7 |
|
1972–76 |
18.0 |
26.0 |
7.3 |
1.6 |
|
1977–81 |
24.0 |
38.5 |
11.9 |
2.4 |
|
1982–86 |
30.4 |
51.7 |
18.2 |
3.8 |
|
1987–91 |
32.2 |
54.4 |
22.2 |
5.0 |
|
1992–96 |
35.2 |
60.2 |
26.4 |
7.5 |
|
d.
full-time/year-round white women |
|
|
|
|
|
Reference |
50.0 |
75.0 |
50.0 |
25.0 |
|
1967–71 |
17.7 |
23.8 |
7.9 |
2.2 |
|
1972–76 |
21.6 |
31.9 |
10.1 |
2.5 |
|
1977–81 |
26.1 |
42.7 |
13.5 |
3.3 |
|
1982–86 |
33.2 |
56.7 |
22.2 |
5.6 |
|
1987–91 |
35.8 |
59.9 |
27.6 |
8.1 |
|
1992–96 |
39.5 |
66.7 |
33.1 |
10.9 |
note:
The
reference line shows corresponding comparisons of white men with themselves.
Things
have changed modestly for the better in the years since. The probability of
being the higher-paid worker increased for black men from 27.2 percent to 36.5
percent by 1992–1996. This was a gain of more than a third during a
comparatively short period.
In
addition to the average centile, the table provides three other measures, showing,
respectively, the percentages of each group whose wages exceed the three
quartiles of the reference, white men’s wage distribution. Among black men in
the initial 1967–1971 period, 41.8 percent had wages in excess of the
first-quartile wage for white men. Thus, a substantial majority of black men
(100.0 - 41.8 = 58.2 percent) had wages no higher than
those of white males in the bottom quarter. Only 19.7 percent of black men had
wages above the median (which is the second quartile) for white men, and a mere
7.0 percent had wages in the top quarter of the white male distribution.
Over
the following three decades, black men made impressive progress. The proportion
with wages in the lowest one-fourth of the white men’s distribution fell from
58 percent to 42 percent. The fraction of black men with wages above the median
for white men jumped from 19.7 percent to 30.8 percent, an increase of more
than 50 percent. The proportion of black men whose wages put them in the top
quarter of the white male distribution rose by 61 percent, from 7.0 to 11.3
percent.
Panel
B of Table 4 refines the comparison by considering black and white men of the
same age and education. The first point to notice is that the convergence of
black and white wages within the age-education matched populations suggests
that the gains just noted are not exclusively a matter of blacks “catching up”
in the amount of schooling they acquired. They remain even after the effects of
education on wages are removed from consideration. By 1992–1996, controlling
for age and education made little difference to the results, suggesting that
the gains resulting from the increase in schooling received by the average
black male worker have been largely exhausted.
The
matched age-education comparisons continue to reveal large black/white
differences in male wages. We can look to the past and be proud of the obvious
gains that have been achieved. With respect to racial differences in wages, the
United States of today bears only scant resemblance to the U.S. portrayed in
Gunnar Myrdal’s 1944 classic, An American Dilemma. But
in spite of enormous progress, the existing differentials among men are so
large that it is inconceivable that we have achieved anything approximating
full equality of opportunity.
If the
economic progress made by black men in postwar America can be considered rapid,
then the gains for women revealed in the two lower panels of Table 4 can only
be described as spectacular. The proportion of African American women with
wages in the top quartile has multiplied tenfold in only thirty years (the
figure jumped from 0.7 to 7.5)! The average black woman worker was at the 12th
centile of the white male distribution just a generation ago; now she is at the
35th centile. Equally striking, just 15.1 percent of working black women had
wages above the bottom quartile for white males; by the mid-1990s, fully six
out of ten were above that line. In the late 1960s, African American women were
far behind not only white men but also black men in the wage competition. By
now they have narrowed the gap between them and white men, and have just about
caught up with African American men; their average centile in the 1990s was
35.2, only trivially different from the 36.5 for black men.
White
women have also moved upward very rapidly. The rate of increase has been a
little slower than the spectacular gains of their black sisters, but they
started out ahead of them and are still a little ahead in wages. The
differences are small, however, and would be smaller still if the higher
average educational levels of white women were taken into account.3
Educational
and Occupational Progress
Table
5 Changes, 1967–1971 to 1992–1996, in the Representation of Black Men, Black
Women, and White Women
Percentages
representation in the white men weeks wage distribution
|
|
quartile |
|
|
|
|
Group/period |
First |
Second |
Third |
Fourth |
|
a.
all black men, uncorrected for age and education |
|
|
|
|
|
1992–96 |
42.0 |
27.2 |
19.5 |
11.3 |
|
1967–71 |
58.2 |
22.1 |
12.7 |
7.0 |
|
Change |
-16.2 |
5.1 |
6.8 |
4.3 |
|
b.
all black men, matched on age and education |
|
|
|
|
|
1992–96 |
40.2 |
25.5 |
20.1 |
14.2 |
|
1967–71 |
52.4 |
22.7 |
14.7 |
10.2 |
|
Change |
-12.2 |
2.8 |
5.4 |
4.0 |
|
c.
full-time/year-round black women |
|
|
|
|
|
1992–96 |
39.8 |
33.8 |
18.9 |
37.5 |
|
1967–71 |
84.9 |
10.4 |
4.0 |
0.7 |
|
Change |
-45.1 |
23.4 |
14.9 |
6.8 |
|
d.
full-time/year-round white women |
|
|
|
|
|
1992–96 |
33.3 |
33.6 |
22.2 |
10.9 |
|
1967–71 |
76.2 |
15.9 |
5.7 |
2.2 |
|
Change |
-42.9 |
17.7 |
16.5 |
8.7 |
source:
Table
4.
The
advances that black men and women (especially the latter) have made toward
parity in wages would not have been possible had they not made strong gains in
education. Table 5 shows how full-time school enrollment rates for young men
and women aged 16–24 have changed in recent decades. The enrollment data show
smooth upward trends for black men and women and for white women as well, with
all three groups narrowing or eliminating the large gap between them and white
men that existed at the end of the 1960s. White men aged 16–24 were then considerably
more likely than members of the other three groups to be attending school full
time. Three decades later, the school enrollment rate for white men was one
point lower than it had been a generation earlier. The rate for black men rose
by 5 points in the period, that for white women by 8.3 points, and that for
black women by a striking 11.1 points. By this measure, only black men are now
significantly behind white men, and the gap between the two groups has been cut
in half.
Table
6 Trends and Gender Differences in Post–High School Education
|
|
percentages
of degrees awarded to African Aamericans a |
|
number
of female/male recipients |
|
|
Degrees awarded |
Men |
Women |
Black |
White |
|
1976–1977
academic year |
|
|
|
|
|
Associates |
7.3 |
9.1 |
1.16 |
0.92 |
|
Bachelor’s |
5.1 |
7.9 |
1.33 |
0.84 |
|
Master’s |
4.6 |
8.9 |
1.70 |
0.91 |
|
Ph.D. |
3.1 |
6.0 |
0.63 |
0.34 |
|
Professional |
3.4 |
6.5 |
0.44 |
0.22 |
|
1995–1996
academic year |
|
|
|
|
|
Associates |
8.2 |
10.1 |
1.89 |
1.51 |
|
Bachelor’s |
6.3 |
9.1 |
1.77 |
1.21 |
|
Master’s |
4.7 |
7.7 |
2.05 |
1.38 |
|
Ph.D. |
2.7 |
5.1 |
1.24 |
0.83 |
|
Professional |
4.7 |
9.1 |
1.38 |
0.66 |
note:
According
to the CPS, African American men represented 10.9 and 13.0 percent of all men
aged 24 years in 1976 and 1995, respectively; African American women
represented 12.3 and 15.1 present of all women in the two respective years.
a Numbers refer
to percentages within gender.
Table
6 shows the percentages of college and professional degrees that were awarded
to African American men and women in the most recent year (1995–1996) and the
earliest year that such data are available (1975– 1976), and also examines the
gender balance among both black and white degree recipients.
In
each category, from associates (i.e., two-year college degrees) to Ph.D.s and
degrees from professional schools (law, medicine, business, architecture, etc.),
the proportion of African Americans rose in almost every category over this
period of a little less than two decades. However, the black share of the
population was increasing at roughly the same rate, and the increase was
largely due to that fact.
Table
7 Changes in Fields of Concentration Among African American College and
Professional Degree Recipients
|
|
men |
|
women |
|
|
Major
field |
Percent
of 1981 graduates |
Ratio
1996/1981 graduates |
Percent
of 1981 graduates |
Ratio
1996/1981 graduates |
|
Bachelor’s degree |
|
|
|
|
|
Business |
26.5 |
1.19 |
19.1 |
1.81 |
|
Education |
10.6 |
0.72 |
19.1 |
0.77 |
|
Engineering |
8.2 |
1.51 |
1.2 |
3.15 |
|
Master’s degree |
|
|
|
|
|
Business |
25.2 |
1.68 |
7.3 |
3.90 |
|
Education |
33.5 |
0.97 |
60.0 |
1.00 |
|
Engineering |
3.6 |
2.38 |
0.3 |
6.26 |
|
First professional degree |
|
|
|
|
|
Medicine
(M.D.) |
25.1 |
0.87 |
28.0 |
1.85 |
|
Law
(L.L.B. or J.D.) |
51.1 |
1.28 |
57.9 |
2.50 |
Note:
According
to the CPS, the number of African American men aged 24 increased by 37 percent
between 1981 and 1996, while the number of women increased by 35 percent.
What
stands out is that women, black and white, were catching up with and indeed
passing men in most of these categories. In 1976–1977, black women were already
earning more associate, bachelor’s, and master’s degrees than were black males.
By 1995–1996, they were far ahead of them in every category, earning 77 percent
more bachelor’s, for example, and more than twice as many master’s degrees.
This obviously is a major reason why African American females have made such
impressive wage gains. It is also striking that white females are now
collecting 51 percent more associate degrees, 21 percent more bachelor’s
degrees, and 38 percent more master’s than are their male counterparts. Again,
this is clearly reflected in the higher paychecks they have been collecting.
Table
8. K–12 School Teachers as a Percentage of Total Employment of College
Graduates
|
|
men |
|
women |
|
|
Years |
White |
Black |
White |
Black |
|
1967–71 |
9.8 |
23.1 |
48.2 |
59.0 |
|
1972–76 |
9.0 |
20.1 |
42.7 |
50.4 |
|
1977–81 |
7.3 |
10.2 |
31.3 |
37.1 |
|
1982–86 |
6.0 |
11.1 |
25.5 |
31.2 |
|
1987–91 |
5.3 |
8.7 |
21.5 |
24.0 |
|
1992–96 |
5.0 |
6.7 |
20.9 |
19.6 |
Note:
Percentages
refer to fractions of aggregate annual hours reported by those college
graduates whose occupation is teacher.
Table
7 provides evidence on changes in fields of concentration for black students in
higher education between 1981 and 1996, the earliest and most recent years for
which such data are available. It also shows the growth between 1981 and 1996
in the number of degrees collected by African Americans in these fields. The
most striking change evident here is the shift of black students out of
education into more remunerative fields. The biggest gains, again, were made by
African American women.
More
detail on this shift out of education is supplied in Table 8. In the period
1967–1971, almost a quarter of all black male college graduates were employed
as elementary or secondary school teachers, and a stunning six out of ten black
females with a college education. The proportions have plunged since then,
dropping to just 6.7 percent for black men and 19.6 percent for black women.
Perhaps
the most outstanding indication of expanding opportunities is the reduction in
the proportion of blackwomen employed in occupations that the Census Bureau
classifies as devoted to “personal service.” In the 1967–1971 period, 24.1
percent of all hours worked by African American women were in personal service
(17.0 percent in private households). By 1992–1996, the concentration of black
women in personal service work had plunged by three-quarters, to a mere 5.6
percent.
Although
there was no similar concentration of black men in one sector of employment in
the 1960s, the three decades since have seen a parallel story of occupational
movement on their part away from traditionally lowpaying jobs (agriculture,
personal services, service stations) into jobs more representative of the
distribution of jobs for all men.
Table
9 Full-Time Employment Rates, Ages 16–24 and 30–44
Percent employed
full-time
|
|
men |
|
women |
|
|
Years |
White |
Black |
White |
Black |
|
|
ages 16–24 |
|
|
|
|
1967–71 |
45.4 |
43.4 |
34.7 |
29.6 |
|
1972–76 |
48.2 |
38.4 |
36.7 |
26.3 |
|
1977–81 |
49.6 |
34.2 |
39.0 |
25.2 |
|
1982–86 |
45.0 |
29.9 |
37.8 |
23.3 |
|
1987–91 |
47.5 |
34.3 |
39.4 |
27.9 |
|
1992–96 |
45.3 |
31.6 |
36.9 |
27.0 |
|
|
ages 30–44 |
|
|
|
|
1967–71 |
91.1 |
85.0 |
37.1 |
50.8 |
|
1972–76 |
89.1 |
79.7 |
40.7 |
51.2 |
|
1977–81 |
88.3 |
77.9 |
48.6 |
56.8 |
|
1982–86 |
85.8 |
72.9 |
54.8 |
60.1 |
|
1987–91 |
87.7 |
76.3 |
60.6 |
64.0 |
|
1992–96 |
87.2 |
75.2 |
61.6 |
62.9 |
note:
Numbers
are simple averages of single-year-of-age-specific full-time-equivalent (FTE)
employment rates. The individual FTE is weeks worked/52 for those who usually
worked at least 35 hours. For those who usually worked less, weeks worked are
each counted as one-half.
Half
Full
Having
gone to great lengths to illustrate the positive, and I absolutely believe it
dominates, I close on a negative note. Table 9 indicates trends and levels of
full-time equivalent employment rates for men and women aged 16–24 and 30–44.
In the late 1960s, black males aged 16–24 and 30–44 were only a bit less likely
than their white counterparts to have full-time jobs. In the three decades
since then, a substantial gap has widened for both age groups. The percentage
point difference among the younger group has grown from 2 to almost 14 points,
and for the older group, from 6 to 12 points. One reason for this disturbing
development is the continuing concentration of large numbers of African
Americans in decaying innercity neighborhoods from which businesses have fled.
This is a serious problem for society.
Black
women have not been affected nearly as much by this trend, perhaps because more
of them have been staying at home and developing skills that are in demand. The
employment rate for black females aged 16– 24 has dropped only 2.6 points over
the period, and for black women in their thirties and early forties it has
climbed by a dozen points.
How
much of the change described above can be attributed by affirmative action
employment policies? I personally believe that Bound, Freeman, and others have
placed too much weight on such policies, both in terms of the 1960s gains for
African Americans and the mixed picture for black males since then. James P.
Smith and I have written extensively on this subject. Though it is difficult to
be precise, there are excellent reasons to believe that, aside from a short-run
blip in the relative wages of young male college graduates in the early 1970s,
affirmative action operated more to consolidate gains in the economic status of
black Americans and to maintain long-established trends, trends firmly founded
in cohort improvements in the quality and quantity of schooling, than to
abruptly change underlying relations.
Where
does this leave us? I suppose the first and most obvious point is that the
progress we have seen in the relative economic status of black Americans was
well under way before the modern antidiscrimination legislation and the various
forms of enforcement were introduced.
School
desegregation was prohibited with the Brown v. Board of Education Supreme
Court decision of 1954. Even so, many desegregation plans were not introduced
until the 1970s (Light and Welch 1987), and states like South Carolina and
Mississippi regularly compiled and published “Statistics of Negro Schools”
until well into the 1960s. It usually takes a long time for the effect of a
court decision or of new legislation to percolate through the system.
Many
of us believe that the primary effect of social legislation, including interpretations
of earlier legislation by the courts, is to consolidate and tie up the loose
ends of changes that have already been realized. The clearest example that I
know is a study by Landes and Solmon (1972) of compulsory schooling
legislation. This legislation took almost a full century to spread among the
U.S. states, and the best predictor of the timing of adoption of a law that
required attendance in school up to a given age was the date that voluntary
attendance in the state reached 90 percent. In effect, the laws forced the
relatively small trailing minority to adopt the behavior of the much larger
majority.
I
believe that a similar argument can be made for the school desegregation decision.
It clearly did not take the ninety years from emancipation to the Brown decision
for desegregation to be challenged. Why 1954 and not 1864? Actually, following
the prohibition of slavery in 1863, there is some evidence of a trend toward
improvement in the quality of the separate and unequal black schools. This
trend ended, and the quality of Southern schools attended by America’s black
children reached a nadir over a couple of decades following the Supreme Court’s
“Slaughterhouse” decisions holding that the enforcement of civil rights was the
purview of the individual states. Then, inexplicably except for the steady
stream of litigation from the NAACP, things got better. As measured by such
nominal characteristics as teacher salaries, students per teacher, the number
of school days each year, attendance rates, expenditures per pupil, etc.,
segregated schools for blacks and whites were more equal in 1954 than at any
earlier time in the twentieth century (Welch 1974).
Regarding
the 1964 Civil Rights Act and Title VII of that Act, which prohibited
discrimination by employers on the basis of race, national origin, and gender,
similar observations hold for the relative economic status of African Americans
(Smith 1984). We saw changes that, by historical standards, should be regarded
as remarkable before the legislation could have had much effect. In fact, we
now know that at the time Myrdal’s dire warnings were written, black/white
income ratios were rapidly increasing.
The
ingredients of progress were partly the rural-to-urban migration that followed
the growing divergence between labor productivity on- versus off-the-farm.
There was also convergence in schooling levels. Over four decades, the gap
among young men entering the job market fell from five to less than two years.
The cause of the convergence seems to be convergence in the quality of
schooling—the resources poured into the schools— that flowed through to the
wage premium associated from added schooling. Even “free” schooling is
expensive because there are alternative uses of time.We learned from the 1960
Census that, among those schooled in the 1920s and 1930s, an extra year of
schooling was worth about 20 percent as much for a black man as for a white man
(Welch 1976). By 1970, we saw that those entering the job market in the 1960s
with newer and, presumably, more equal quality of schooling received
approximately equal returns. Over a short time, added schooling became an
important route to higher income, and the response, in terms of years in
school, was dramatic.
At
this point I should reveal a bias that I have had since I first began trying to
understand the phenomena of racial discrimination and of race differences in
income. It is trivial to understand how we can use the body politic to
discriminate with publicly provided services. Anyone with a scintilla of
concern who reads the historical record of the resources provided, including
monitoring, to segregated schools cannot doubt that the instrument is blunt and
effective. Discrimination in employment is harder to understand.
A
dollar earned does not change its color depending on the color of the employees
who assist in earning it.
This
brings me back to the beginning of this section; the first and most obvious
point is that the progress we have seen in the relative economic status of
black Americans was well under way before the modern antidiscrimination legislation
and the various forms of enforcement were introduced. Since the introduction of
the new legislation, the trends have been more or less what had previously been
established. On this basis, I believe that it is hard to argue for a major role
of the legislation regarding employment discrimination. I am personally an
advocate of such legislation, but I think its role has been more that of
consolidation than a source of fundamental change. I should like to believe
that the gains we have seen in the relative economic status of black Americans
have resulted from positive responses to more equal opportunity.
Half
empty? Of course! There is no shortage of problems to occupy all advocates of
social justice. But, half full as well. All is not bleak; there is reason for
pride. We are a diverse people, but differences between demographically distinct
groups tend to erode over time.
Notes
1. Recall that
the CPS data underlying these calculations are samples and are subject to
luck-of-the-draw sampling noise. There is no reason of which I am aware to believe
that the initial observation reflects a fundamental differential.
2. Wages are
deflated by the Gross National Product deflation for consumer expenditures (all
goods). See the Economic Report of the President, 1998.
3. Caution may
be in order for the gender comparisons, however. The wage distributions for men
refer to average weekly wages for men working full time. Men who work a greater
number of weeks each year typically earn higher wages than do those who work
fewer weeks, and I have used this fact to impute wages for men who either do
not work or work part time (less than 35 hours per week). The distributions summarized
in Table 4 include all men with observed wages for those working full time and
estimated wages for others. It is less clear that women who work either part year
or part time would earn less than their full-time/full-year peers. I restrict
the observations of women’s wages to those who were full time and full year (at
least 40 weeks worked).
References
Bound, John,
and Richard Freeman. “WhatWent Wrong?” Quarterly Journal of Economics 107, no. 1
(February 1992): 201–32.
Council of
Economic Advisors, Economic Report of the President.Washington, D.C.: U.S. Government
Printing Office, 1998.
Juhn, Chinhui,
Kevin M. Murphy, and Brooks Pierce. “Accounting for the Slowdown in Black-White
Wage Convergence.” In Marvin Kosters, ed., Workers and Their Wages (Washington,
D.C.: American Enterprise Institute Press, 1991).
Landes, William
M., and Lewis C. Solmon. “Compulsory Schooling Legislation: An Economic Analysis
of Law and Social Change in the Nineteenth Century.” Journal of
Economic History 32, no. 1 (March 1972): 54–91.
Light, Audrey,
and Finis Welch. New Evidence on School Desegregation. Prepared for the U.S. Commission
on Civil Rights, Clearinghouse Publication 92. Washington, D.C.: U.S.
Commission on Civil Rights, December 1987.
Smith, James P.
“Race and Human Capital.” American Economic Review 74, no. 4
(September 1984): 685–98.
Smith, James
P., and Finis Welch. “Black Economic Progress After Myrdal.” Journal of Economic
Literature 27, no. 2 ( June 1989): 519–64. Reprinted in Orley
Ashenfelter and Kevin Hallock, eds., Labor Economics (London: Edward
Elgar Publishing, 1994).
———. “Racial
Discrimination: A Human Capital Perspective.” In G. Mangum and P. Philips,
eds., Three Worlds of Labor Economics (Armonk, N.Y.: M. E. Sharpe, 1988). U.S.
Department of Education, National Center for Education Statistics. Digest of
Education Statistics,Washington, D.C., 1976–1998.
Welch, Finis. “Education
and Racial Discrimination.” In O. Ashenfelter and A. Rees, eds., Discrimination
in Labor Markets (Princeton, N.J.: Princeton University Press,
1974).
———. “Employment
Quotas for Minorities.” Journal of Political Economy 84, no. 4 (August
1976): S105–S139.
==============================
Discrimination in Public Contracting
GEORGE
R. LA NOUE
How much
discrimination is there in contemporary public contracting in the
United States? Because these contracts cover almost everything available in
commercial markets and because virtually all governments need to make purchases
and have the authority to do so, no definitive answer can be given to a
question of such scope and complexity. Nevertheless, forming a reliable
estimate is essential for at least two reasons.
First,
public purchasing is one of government’s most important functions. Its
effective use or potential abuse can have a substantial impact on governmental
efficiency, the income of particular companies and communities, and the
financial burden on taxpayers. Current purchases by the federal government are
about $180 billion a year, while state and local governments purchase about
$465 billion more. It would be intolerable if governments used this formidable
economic power to discriminate against businesses because of the race,
ethnicity, or gender of their owners.
Second,
in recent years public purchasing practices have undergone enormous scrutiny to
determine whether or not discrimination exists. There may be more publicly
accessible information measuring discrimination in this area of public life
than in any other. A multitude of studies about federal, state, and local
public contracting have been completed that permit not only an assessment of
their conclusions but also an evaluation of the political context of
accusations and denials regarding discrimination.
The
Development and Defense of MBE Programs
The
source of the recent attention paid to discrimination in public contracting is
the 1989 Supreme Court’s decision in City of Richmond v. Croson.1 In
that case, the Court confronted one example of the hundreds of state and local
minority business enterprise (MBE) programs that had been developed in the
preceding decade. These programs sought to place firms that were certified as
being owned by designated minorities (usually African American, Hispanic, Asian
American, and Native American) in favored positions for public contracts. Some
programs included womenowned businesses (WBEs) as well.
A
variety of preferential techniques have been used. Certain contracts were set
aside for MBE firms or were given price preferences in bidding against non-MBE
firms. Often non-MBE prime contractors were required to hire a certain
percentage of MBEsubcontractors to meet a goal necessary for contract award.
In
addition, since 1976, a number of federal MBE programs have been established.2 The
oldest is the Small Business Administration’s 8(a) program, which sets aside
about $4 billion of federal contracts a year for MBEs. There are also 10
percent MBE goal requirements in a wide variety of federal programs, including
the $210 billion 1998 highway program. In October 1998, the Clinton
administration also began a program of 10 percent price preferences for MBE
bidders on contracts covering about 76 percent of all federal purchases.3
Sometimes
these MBE programs were seen by their sponsors as economic development stimuli
for minority communities, sometimes as remedies for general racial injustices,
and sometimes as payoffs to emerging political power in minority communities.
The policies usually reflected symbolic or redistributive politics and rarely
were designed to respond to clearly identified problems. There was very little
scholarly analysis of them, and bureaucratic reports covering them were often
self-serving or incomplete. The consequences of altering conventional public
purchasing programs by MBE programs were almost never evaluated. Which firms
were helped, which were hurt, and how much these programs cost were questions almost
never asked.
Croson,
which covered state and local programs, and Adarand v. Pen˜a in
1995, which applied the constitutional standard of strict scrutiny to federal
MBE programs, changed all that.4 In Croson,
Justice Sandra Day O’Connor stated that before a local jurisdiction could use
racial classifications it was necessary to make
proper
findings . . . to define the scope of the injury and the extent of the remedy
necessary to cure its effects. Such findings also serve to assure all citizens
that the deviation from the norm of equal treatment of all racial and ethnic
groups is a temporary matter, a measure taken in the service of the goal of
equality itself.5
Justice
O’Connor further noted that the judiciary would have a responsibility to
examine those findings:
Absent
searching judicial inquiry into the justification for such race-based measures,
there is simply no way of determining what classifications are “benign” or “remedial”
and what classifications are in fact motivated by illegitimate notions of
racial inferiority or simple racial politics.6
Since
the Croson decision, more than 145 state and local
jurisdictions have commissioned so-called “disparity studies” to determine
whether they had a sufficient evidentiary basis to initiate, maintain, or
expand MBE programs. At least $65 million has been spent on this activity.7 Unfortunately,
many of these studies do not meet federal court standards. For example, Judge
James Graham of the Southern District of Ohio, Eastern Division, held:
A
municipality which is considering the enactment of legislation which creates
race-based and gender-based preferences in the award of public contracts must,
in fairness to all of its citizens, fairly and fully investigate the issue of
whether or not discrimination has actually occurred in the employment of
minorities and females in the construction industry in its community and
whether such discrimination has actually occurred in its award of contracts and
in the award of subcontracts by the prime contractors it has employed. Only if
a thorough and impartial investigation of the facts supports a finding that
discrimination has occurred is the municipality justified in considering a
scheme in which some of its citizens and firms are excluded from competing for
a portion of its total contract dollars.8
Many
disparity studies are neither “thorough” nor “impartial.”
Flawed
Conclusions
At
first glance the disparity studies’ consensus about discrimination in public
contracting seems virtually unanimous and quite damning. The New York City
study concluded: “In our view, the cumulative effects of discrimination by
banks, bonding companies, general contractors, private companies, and public
agencies is responsible for the gross underrepresentation of businesses
operated by minorities and women in construction, services, and commodities.”9 But
one might be a little suspicious about this sweeping conclusion because the
identical language appears in at least two other studies completed by the same
consultants regarding very different jurisdictions (San Antonio, Texas, and
Hayward County, California.) 10
The
federal government has made similar conclusions. At the behest of the Justice
Department, the Urban Institute analyzed 58 disparity studies and concluded
that MBEs received only 57 cents for every public contracting dollar they were
expected to receive.11 When the United States Commerce Department analyzed
federal procurement, they found DBEs underutilized in 51 of 74 Standard
Industrial Codes.12
But on
closer analysis, these statistical conclusions appear to be deeply flawed.
Every time disparity studies have been challenged at trial, judges have found
them unreliable, and a number of jurisdictions have settled cases rather than
subject their studies to judicial scrutiny.13 In Croson, the
Court provided guidelines for an appropriate statistical analysis by stating:
Where
there is a significant statistical disparity between the number of qualified minority
contractors willing and able to perform a particular service and the
number of such contractors actually engaged by the locality or the locality’s
prime contractors, an inference of discriminatory exclusion could arise.14 (emphasis
added)
In
short, to infer discrimination, the statistical comparison must be between
comparable contractors—an apples-to-apples comparison of qualified, willing,
and able firms. Partly because of a substantial growth rate in recent years,
MBEs are in general smaller and newer businesses. To assume that utilization in
government contracts of MBEs and non-MBEs, which include large
stockholder-owned corporations, should be the same may create a false inference
of discrimination when statistical analysis based on headcounts of firms is
carried out. Indeed, the Urban Institute acknowledged that probability in a
private report to the Justice Department and then ignored its own conclusion in
its public report.15
Anecdotal
Research
In
addition to statistics, most disparity studies collect anecdotes about
discrimination. Properly done, anecdotes could be helpful in understanding the
statistics and in pinpointing where, if at all, the discrimination exists. In
practice, the anecdotal sections of most disparity studies reach conclusions of
discrimination that are almost inevitable given the flawed methods used but
that nevertheless serve to buttress MBE programs.
Generally
two methods are used to gather anecdotal information: surveys and interviews.
The disparity study surveys have been plagued with low response rates and
poorly designed questions. Rarely have the surveys had a 20 percent response
rate. When 80 percent of potential respondents throw the survey into the
wastebasket, there is always the possibility that the tiny minority that does
respond may be atypical. One federal court described the problem this way:
First,
whether discrimination has occurred is often complex and requires a knowledge
of the perspectives of both parties involved in an incident as well as
knowledge about how comparably placed persons of other races, ethnicities, and
gender have been treated. Persons providing anecdotes rarely have such
information. What looks like discrimination may involve nothing more than
aggressive business behavior to overcome barriers faced by all new or small
businesses.
Second,
when the respondent is made aware of the political purpose of questions or when
questions are worded in such a way as to suggest the answers the inquirer
wishes to receive, “interviewer bias” can occur. In addition, “response bias”
may be a problem. The persons most likely to answer the survey are those who
feel the most strongly about a problem, even though they may not be
representative of the larger group. Third, individuals who have a vested
interest in preserving a benefit or entitlement may be motivated to view events
in a manner that justifies the policy. Consequently, it is important that both
sides are heard and that there are other measures of the accuracy of the
claims. Attempts to investigate and verify the anecdotal evidence should be
made.16
The
most important question is whether the anecdotes about discrimination are true.
Some may be, while others are perhaps the consequence of honest
misunderstanding or the result of purposeful exaggeration. Almost no disparity
study has ever discussed whether the incidents it reported were factually
correct, although they are usually described not just as feelings or
perceptions but as facts that characterize the universe of business transactions
in which discrimination is rampant. The DJ Miller company, which has completed
scores of disparity studies, at least mentions that its anecdotes are “unsubstantiated”
because “time did not permit a full investigation of these perceptions of
discrimination during the study period time frame.”17 Asked
whether the anecdotal information contained in the $600,000 Memphis–Shelby
County study was true, the project manager testified that he didn’t know that
it was “untrue.”18 The chief architect of millions of dollars of
disparity studies completed by the National Economic Research Associates was
even more succinct. He testified:
Q. Did
NERA follow up the information in the surveys to determine if any of the
allegations of discrimination in the survey are true?
A. No.
Q. Do you know if any of them are true?
A. No.
Q. Do you know if any of the anecdotes in any of the Denver-related studies are
true?
A. No.
Q. Do you know if any of the anecdotes in any NERA study with which you have
been connected is true?
A. No.19
Some
allegations of discrimination cannot be verified because they are “he said–she
said” incidents. But when a company claims it was the low bidder on a public
contract or could not get on a vendor list, that can be verified. Yet the
disparity consultants do not check their facts, and the governments often
cannot. Most studies regard the sources of anecdotal information as
confidential and will not turn over transcripts or interview notes, even with
names deleted, to the public sponsors that paid for the study. Therefore,
cities or other governmental authorities involved usually know very little
about the reputation of the person making the charge of discrimination or its
context. Nevertheless, as sponsors of the disparity study, they will act as
though all the complaints are true.
The
use of anecdotal evidence is strange and alarming. On what other subject would
governments consistently commission “research” that consists of rumors or is
based on unverified sources? In what other area of public life would millions
of dollars of tax funds be used to subsidize the gathering and publication of
damaging allegations by one racial or ethnic group about another with so little
concern for whether these complaints are factually accurate?
The
willingness of governments and consultants to engage in this activity is a
telling sign that most of these studies are results oriented—that is, they are
designed to support a predetermined conclusion.20 Finding discrimination is a
prerequisite to maintaining or expanding an MBE program, and that is what many
of these studies are designed to do. As the Eleventh Circuit found, after
reviewing the context and conclusions of the Dade County disparity studies: “It
is clear as window glass that the County gave not the slightest consideration
to any alternative to a Hispanic affirmative action program. Awarding
construction contracts is what the County wanted to do, and all it considered
doing, insofar as Hispanics were concerned.”21
Judges
regularly assess the reliability of evidence, and fortunately they have been
highly skeptical of the anecdotal information before them. In AGC v. Columbus, the
federal district court established “Standards for the Collection of Anecdotal
Evidence of Discrimination” and excoriated the consultants for bias in
gathering anecdotes.22 Similarly, in a Dade County case, the judge
complained:
Without
corroboration, the Court cannot distinguish between allegations that in fact
represent an objective assessment of the situation, and those that are fraught
with heartfelt, but erroneous, interpretations of events and circumstances. The
costs associated with the imposition of race, ethnicity, and gender preferences
are simply too high to sustain a patently discriminatory program on such weak
evidence.23
In a
May 1998 decision, a court dismissed the anecdotes in the State of Florida’s
disparity study and stated:
Individuals
responding to FDOT’s telephone survey have described their perceptions about
barriers to FDOT’s bidding procedures. But FDOT has presented no evidence to
establish who, if anyone, in fact engaged in discriminatory acts against Black
and Hispanic businesses. The record at best establishes nothing more than some
ill-defined wrong caused by some unidentified wrongdoers; and under City of
Richmond [Croson] that is not enough.24
The
Future of MWBE Programs
The
growth of minority- and women-owned businesses, propelled by basic demographic
and economic factors, will continue regardless of the fate of MWBE programs.
Between 1982 and 1992, according to the Census Bureau, the number of
black-owned firms grew by 67 percent, Hispanic-owned firms by 189 percent,
Asian-owned firms by 177 percent, women-owned firms by 162 percent, and
non-MWBE firms by 24 percent. Perhaps MBE programs had an impact, but most
firms market themselves in the private economy unaffected by public contracting
programs.
Although
firms owned by African Americans are the principal intended beneficiary of MWBE
programs, those companies had the slowest growth rate of any MWBE group. There
are now more than four times as many firms owned by Hispanics and Asian
Americans and thirteen times as many owned by women than by blacks, which means
that black firms will get decreasing shares of the benefits of MWBE programs in
the future.
More
time and money may have been spent in disparity studies investigating public
contracting discrimination than in any other area of social research in our
nation’s history. And yet after this enormous public expenditure, the studies
have documented no pattern of discrimination against MBEs by government
purchasing procedures, by prime contractors against subcontractors, or by
professional and trade organizations. Indeed, the studies have almost never
identified any agency, procurement officer, or private firms where
discrimination took place. This does not mean that such problems will not be
found in the future or that we as a society are discrimination-free any more
than we are crime-free or pollution-free. Nevertheless, the news about public
contracting is basically good.25 The procedures and ethics in the public procurement
process are basically fair, in spite of sweeping politically motivated claims
to the contrary.
The
coalition politics that support MBE programs are not hard to understand, but
what is not generally known is how few firms actually benefit from these
policies.26 Disparity studies do not discuss this issue. Nevertheless,
some data exist. For example, in Cincinnati, of the 682 identified MWBEs in
City vendor lists, thirteen firms received 62 percent of all the contracts and
83 percent of the dollars going to MWBEs.27 Nationally there are over 2.2
million minority-owned businesses in the United States, but there are only
about 6,000 8(a) certified firms—about 0.0025 percent of the total number of
MBEs.28 As
administered by the SBA, the 8(a) program functions to give very
well-established minority-owned firms privileged access to large amounts of
federal contracts. In 1995, in a report to Senator Sam Nunn (D-Georgia), the
General Accounting Office stated:
As the
value and number of 8(a) contracts continues to grow, the distribution of those
contracts remains concentrated among a very small percentage of participating
8(a) firms, while a large percentage get no awards at all. This is a
long-standing problem. For example, in fiscal year 1990, 50 firms representing fewer
than 2 percent of all program participants obtained about 40 percent, or 1.5
billion, of the total of $4 billion awarded. Of additional concern is that, of
the approximately 8,300 8(a) contracts awarded in fiscal 1990 and 1991
combined, 67 contracts were awarded competitively. In fiscal year 1994, the top
50 firms represented 1 percent of the program participants and obtained 25
percent or $1.1 billion, of the $4.37 billion awarded, while 56 percent of the
firms got no awards.29
Further,
in the 8(a) program, only a small percentage of these favored firms have ever
graduated to be market competitive.
Even
though litigation has exposed the statistical and anecdotal flaws in the
disparity studies, the judicial process is arduous, expensive, and piecemeal.
In the meantime, disparity studies with flaws equal to or greater than the ones
found unreliable still serve as the basis for allocating billions of dollars in
public contracts on the basis of the race and ethnicity of favored owners.
The
problem with existing disparity studies is not just that most of them are
technically defective. The more important issue is that they so often have made
exaggerated claims of discrimination and failed to identify the forms of bias
that might exist. They have supported preferential programs based on race and
ethnicity and have rarely treated race-neutral solutions seriously. This is
harmful to society in a number of ways. The wounds caused by racial and ethnic
conflict are very deep in America. The healing process is difficult and
uncertain but absolutely essential if we are to survive as a pluralistic
society. Unfounded accusations of discrimination and thoughtless denials are
both damaging.
Conclusions
Preference
programs for MBEs have the potential to undermine the general safeguards built
into the public purchasing process and to create a return to the era of contract
patronage, this time built on racial connections. Politicians who believe that
it is appropriate to set aside contracts for particular racial groups may be
tempted to steer them to particular companies as well.
Assertions
of generalized marketplace discrimination, “old boy networks,” and other
nebulous forms of bias may actually retard the formation of minority
businesses, especially among African Americans. Who would want to make the
investment of capital and labor that a new business requires if they were
convinced that discrimination was so prevalent that success was highly
unlikely?
Further,
if discrimination is everywhere, committed by everyone, then it may seem futile
to try to eradicate it. Indeed, this is the argument of many MBE program
advocates, who believe the appropriate response to allegations of
discrimination by whites is preferences for nonwhites rather than enforcement
of antidiscrimination laws. Where do such assumptions and policy responses lead
in the long run? Can our country endure built on a premise that there is such
widespread discrimination by whites that it can only be countered by broad
preferences for nonwhites?
Reckless
allegations of discrimination tend to produce blanket denials by those accused.
Most whites believe that the overt forms of discrimination that characterized
American institutions in the past have disappeared. In their place, procedures
based on subtle subjective decisions that sometimes reflect biased assumptions
often coexist institutionally with affirmative action policies that clearly
discriminate against nonfavored classes. Disparity studies generally have
failed to document either overt or subtle forms of discrimination and have
ignored the effects of MBE preferences. Unless our society is prepared to require
the most careful documentation of where discrimination actually exists and to
evaluate the effects of preferential programs, we cannot construct the
interracial coalitions necessary to enforce antidiscrimination laws vigorously
and improve access and overcome disadvantages in public contracting or anywhere
else.
Viewed
from this perspective, the Supreme Court in Croson sent
the right message by emphasizing the dangers of racial politics and stereotyped
assumptions and by insisting on analyzing the appropriate data and remedying identified
discrimination. Unless that is done, as Justice O’Connor declared, “The dream
of a Nation of equal citizens where race is irrelevant to personal opportunity
and achievement would be lost in a mosaic of shifting preferences based on
unmeasurable claims of past wrongs.”30 That is not an appropriate fate for
public contracting or any other area of American life.
Notes
1. 488 U.S. 469
(1989).
2. Federal
programs often define the beneficiaries as Disadvantaged Businesses
(DBEs), but the
definition of social disadvantage is based on identification with a
particular
racial and ethnic minority. All persons identified with the following groups
are presumed to
be disadvantaged: Black (a person having origins in any of the original
racial groups
of Africa; Hispanic (a person of Mexican American, Puerto Rican, Cuban,
Central or
South American, or other Spanish or Portuguese origin or culture, regardless
of race);
Native American (an American Indian, Eskimo, Aleut, or Native Hawaiian);
Asian American,
including Burma, Thailand, Malaysia, Indonesia, Singapore, Brunei,
Japan, China,
Taiwan, Laos, Cambodia (Kampuchea), Vietnam, Korea, the Philippines,
U.S. Trust
Territory of the Pacific Islands (Republic of Palau), Republic of the Marshall
Islands,
Federated States of Micronesia, the Commonwealth of the Northern Mariana
Islands, Guam,
Samoa, Macao, Hong Kong, Fiji, Tonga, Kiribati, Tuvalu,Nauru, India,
Pakistan,
Bangladesh, Sri Lanka, Bhutan, the Maldives Islands and Nepal. For a discussion
of these
presumptions, see George R. La Noue and John C. Sullivan, “Presumptions
for
Preferences: The Small Business Administration’s Decisions on Groups
Entitled to
Affirmative Action,” Journal of Policy History 6, no.4 (fall 1994).
Three federal
district courts have found unconstitutional the concept of presuming
that all
members of particular racial and ethnic groups are disadvantaged or
discriminated against for the purpose of awarding public contracts.
Nevertheless, the concept
is still at the
heart of almost every MBE program. See Adarand v. Pen˜a, 965 F. Supp.
1556, 1580 (D.
Colo. 1997); Houston Contractors Association v. Metro Transit Authority,
954 F. Supp.
1013 (S.D. Tex. 1996); and In re Sherbrooke, 17 F. Supp. 2d 1026 (D. Minn.
1998). For a discussion
of the issue of which group should receive preferences, see
George R. La
Noue and John C. Sullivan, “Gross Presumptions: Determining Group
Eligibility for
Federal Procurement Preferences,” Santa Clara Law Review 41 (winter 2000).
3. John Sullivan
and Roger Clegg, “More Preferences for Minority Businesses,”
Wall Street
Journal, August 24, 1998, p. A13.
4. 515 U.S. 200
(1995).
5. Croson, 488 U.S. at
510.
6. Ibid., at
493.
7. See two
works by George R. La Noue, Local Officials Guide to Minority Business
Programs and
Disparity Studies (National League of Cities, 1994), and “Social
Sciences
and Minority
Set-Asides,” Public Interest, Winter 1993.
8. Associated
General Contractors of America v. City of Columbus, Order June
20,
1990, p. 10.
9. “The Utilization
of Minority and Women-Owned Business Enterprises by the
City of New
York,” NERA, 1994, p. 129.
10. “The
Utilization of Minority andWoman-Owned Business Enterprises in Bexar
County” (San
Antonio), NERA, 1992, p. 155, and “The Utilization of Minority and
Woman-Owned
Business Enterprises by The City of Hayward (California),” NERA,
1993, p. 8-5.
11. “Do
Minority-Owned Businesses Get a Fair Share of Government Contracts?”
Urban
Institute, October 1996.
12. Jeffrey L.
Meyer, “Price Evaluations Adjustments and Benchmarking Methodology,”
U.S. Department
of Commerce, June 23, 1998. Commerce has not released
enough
information for one to be certain how these calculations were completed, but
apparently MBEs
were counted as available whether or not they actually bid on federal
contracts,
while for non-MBEs only bidders were counted as available.
13. See, e.g., Contractors
Association of Eastern Pennsylvania v. Philadelphia, 893 F.
Supp. 419 (E.D.
Pa. 1995), affirmed 91 F. 3d 586 (3d. Cir. 1996); Associated
General
Contractors v.
Columbus, 936 F. Supp. 1363 (S.D. Ohio 1996); Buddie v.
Cleveland, 1995
(settled); Prior Tire
Company v. Atlanta Public Schools (No. 1-95-CV-825-JEC, 1997);
Houston
Contractors Association v. Metro Transit Authority, 954 F. Supp.
1013, 1018
(S.D. Tex.
1996); Engineering Contractors Association of South Florida, Inc. v.
Metropolitan
Dade County, 943 F. Supp.
1546 (S.D. Fla. 1996), affirmed 122 F.3d 922 (11th
Cir. 1997); Phillips and
Jordan v. Watts, 13 F. Supp. 1308, 1314 (N.D. Fla. 1998); Ohio
Contractors
Association v. Cincinnati, C-1-98-447, 1998; Kossman v. TxDOT, C.A. No.
H-99-0637 (S.D.
Tex. 2000); ConcreteWorks v. City and County of Denver, 86 F. Supp.
2d. 1042 (D.
Colo. 2000); Scott v. Jackson, No. 3: 97CV719BN, affirmed 199 F.3d 206
(5th Cir.
2000); Association for Fairness in Business v. New Jersey, 82 F. Supp.
353 (D.
N.J. 2000); Webster v.
Fulton County, 82 F. Supp. 1375 (N.D. Ga. 2000); Associated
Utility
Contractors of Maryland, Inc. v. The Mayor and City Council of Baltimore, 83 F.
Supp. 2d 613
(D. Md. 2000); Associated General Contractors v. Drabik, 50 F. Supp.
2d
741 (S.D. Ohio
1999), affirmed 6th Cir. 2000.
14. Croson, 488 U.S. at
509.
15. In “Evaluation
of Disparity Study Methodology,” pp. 3–4, the Urban Institute
authors stated:
“A study that uses a measure of availability that includes only firms that
are ready,
willing and able to perform government contract work is stronger than a
study that
includes all firms without trying to control for whether they are available or
have the
requisite ability. This is because including all M/WBEs may overstate the true
availability of
these firms, and bias results towards finding a disparity even when there
is none.”
16. Engineering
Contractors Association of South Florida, Inc. v. Metropolitan Dade
County, 943 F. Supp.
1546, 1579 (S.D. Fla. 1996).
17. A Disparity
Study for Memphis–Shelby County Consortium, VII, p. 4.
18. Deposition
of David J. Miller in Associated General Contractors v. Shelby County,
May 27, 1988,
p. 172.
19. Deposition
of David Evans, July 30, 1998, in Concrete Works v. Denver, p. 66.
20. In AGC v. Columbus, the Court
referred to the City’s study as “examples of
results-driven
research” in which the outcome is politically predetermined (936 F.
Supp. at 1431).
21. Engineering
Contractors Association of South Florida v. Metropolitan Dade
County, 122 F.3d 922,
936 (11th Cir. 1997).
22. 936 F.
Supp. 1363, 1426 (S.D. Ohio 1996).
23. 943 F.
Supp. 1546, 1584 (S.D. Fla. 1996).
24. Phillips and
Jordan v. Watts, 13 F. Supp. 1308, 1314 (N.D. Fla. 1998).
25. As one of
the most sophisticated and prolific authors of disparity studies has
finally
conceded: “First, it is virtually impossible for the type of discrimination
described
above to exist
in construction prime contracting for government entities that follow
normal public
contracting procedures. City construction projects are publicly advertised.
They are
awarded to the lowest bidder. Almost by definition, construction contracts
are awarded to
the most qualified of the willing and able firms so there can be
no
discrimination under this extremelynarrow view.” Dr. David Evans, Rebuttal
report,
Concrete Works
v. City and County of Denver, pp. 3–4.
26. The best
description of local MBE politics and the few firms that benefit can be
found in the
chapters on Atlanta in Tamar Jacoby’s Someone Else’s House (New York:
Free Press,
1998).
27. These data
were produced for “City of Cincinnati Croson Study,” Institute of
Policy
Research, 1992, but were not published.
28. 1992
Summary volume, Survey of Women and Minority-Owned Businesses.
29. General
Accounting Office, “Small Business Administration—8(a) Is Vulnerable
to Program and
Contractor Abuse.” Report to the Ranking Minority Member,
Permanent
Subcommitteeon Investigations,Committeeon GovernmentalAffairs, U.S.
Senate,
September 1995, pp. 3–4. See also, GAO “Small Business; Problems Continue
with SBA’s
Minority Business Development Program” (GAO/RCED-93-145), September
17, 1993.
30. Croson, 488 U.S. at
505–6.
==============================