Report: Global Warming
A Guide to Global Warming
1.
What is the greenhouse effect?
4.
Has the earth’s temperature increased over the past two decades?
5.
How precise are measurements of the earth’s temperature?
8.
How much does the global climate vary naturally?
9.
What influence does the sun have on global climate change?
10.
What is the greenhouse “fingerprint”?
11.
Are computer simulations of the earth’s climate accurate?
13.
Will the earth’s climate change in other ways?
14.
Will global warming produce a rise in sea level and cause major flooding?
15.
Will global warming produce more violent storms?
16.
Will global warming cause the spread of infectious diseases?
Predictions
of Warming Continue to Drop (971014)
Is
There a Scientific Consensus on the Causes of Global Warming? (971105)
Global
Warming Projections vs. the Data: Are the Data Reliable? (971112)
1997:
Warmest Year Since 1400? (980630)
Global
Warming and El Niño - No Connection (980709)
Hot
Times or Hot Air: The Sun in the Science of Global Warming (980807)
Climate
Change: Real and Imaginary (000710)
Coaxing
Nature to Reveal 1,000 Years of Earth’s Climate (030502)
Combatting
global warming would be a waste (030725)
Global
Warming Smear Targets (030826)
Global
Warming Debate Heats Up Capitol Hill (031119)
Climate
debate isn’t about action, it’s about knowledge (040106)
Cold
Facts on Global Warming (040122)
==============================
http://www.marshall.org/article.php?id=67
Marshall Institute
A Guide to Global Warming -
Questions and Answers on Climate Change
January 15, 2000
Introduction
For well over a decade, the George C. Marshall Institute has been addressing the studies, the speculation on hazards, the many efforts to predict, and the theories supporting fear of human-made global climate change.
The George C. Marshall Institute believes that public discussion of human-made global warming as a world encompassing problem may be a clear example of multiple “detail solutions” being proposed before a sound scientific definition of the problem, or even a recognition of the problem’s existeence, has been established. Accordingly, the Institute has compiled a list of the questions commonly posed about global warming. The Institute, using well founded knowledge of the present state of the art, has composed a response to these questions that summarizes today’s knowledge and assesses the task ahead to provide an answer. It is the Institute’s hope that this effort will help the United States determine how best to acquire a valid scientific foundation that can then support sound public policy.
One note of caution. Concerns about global climate change are particularly complex as they touch on climate science, economics, societal response to climate change, and other issues. In order to prepare a guide that is accessible to a general audience, some simplification is inevitable. For this reason, references to the technical literature have been provided in the endnotes for those interested in further study.
Summary
1. What is the greenhouse effect?
The greenhouse effect is natural and necessary for life on Earth.
2. What will be the effect on global climate of increasing amounts of human-made greenhouse gases such as carbon dioxide in the air?
Nobody knows for sure.
3. Has the earth’s temperature increased over the last 100 years in step with increasing atmospheric CO2?
No.
4. Has the earth’s temperature increased over the past two decades?
Very little, by 0.05°C per decade in the lower atmosphere.
5. How precise are measurements of the earth’s temperature?
Temperatures taken by satellites are very precise; those taken from ground stations are less so.
6. Is it possible that human-made global warming is occurring, but is masked by the cooling effect of air pollution?
This is not likely.
7. What does the record of past climates show about the relationship between changes in atmospheric CO2 levels and changes in global temperature?
The records show that changes in global temperature do not always follow changes in atmospheric CO2 levels.
8. How much does the global climate vary naturally?
Natural climate changes can occur rapidly.
9. What influence does the sun have on global climate change?
Scientists are studying this question with great care. It now seems that the sun has a significant influence on climate.
10. What is the greenhouse “fingerprint”?
It is a unique pattern of changing climate whose detection would suggest that recent warming is caused by greenhouse gases from human activities, as opposed to natural processes.
11. Are computer simulations of the earth’s climate accurate?
No.
12. How much will the earth’s temperature rise if the amount of human-made CO2 in the atmosphere continues to increase in the next 100 years?
There is no definitive answer to this question at present.
13. Will the earth’s climate change in other ways?
Predictions of changes in other aspects of climate, such as precipitation and sea-level rise, are even more uncertain than the projections of global temperature.
14. Will global warming produce a rise in sea level and cause major flooding?
As computer simulations have become more sophisticated, projections of rising sea levels have become much smaller.
15. Will global warming produce more violent storms?
This is not likely.
16. Will global warming cause the spread of infectious diseases?
This is not likely.
17. Is there a consensus among climate scientists that greenhouse warming from human activities is a major threat?
No. Science is not aimed at building a politically potent consensus over questions of public policy.
18. Does the threat of major climate change justify drastic reductions in CO2 emissions by the United States and other nations?
No.
19. Is there a clear policy on climate change and CO2 emissions which makes sense based on our current knowledge?
We have at least 25 years to research this issue before CO2 emission cuts need to be considered.
==============================
1. What is the greenhouse effect?
The greenhouse effect is natural and necessary for life on Earth.
The sun supplies the energy to warm the earth. The atmosphere, which is mostly transparent to the incoming sunlight, absorbs outgoing reflected or internal thermal radiation to keep the earth warmer than it would be otherwise.
This absorbing property of the atmosphere is the greenhouse effect.1 Gases in the atmosphere that absorb infrared radiation, thereby preventing some of the outgoing energy from returning to space, are called greenhouse gases.
Not all gases in the atmosphere absorb outgoing infrared radiation. Nitrogen and oxygen, which make up most of the earth’s atmosphere, have no blocking effect. The gases that absorb the infrared radiation and create the greenhouse effect are mainly water vapor, carbon dioxide, methane, and nitrous oxide. Water vapor and water in clouds absorb nearly 90% of the infrared radiation, while carbon dioxide, methane, and the other minor greenhouse gases together absorb little more than 10% of the infrared radiation.
Therefore, most of the greenhouse effect is natural and caused by the different forms of water in the atmosphere. However, human activities over the last 100 years, like burning wood, coal, oil, and natural gas, have increased the concentration of greenhouse gases in the atmosphere by an amount equivalent to a fifty percent increase in carbon dioxide alone. According to some projections, the amount of greenhouse gases in the atmosphere from human activities will be effectively equal to a doubling of CO2 in the next 100 years.
1 The term “greenhouse effect,” coined nearly two centuries ago, is scientifically inaccurate. A greenhouse stays warm because the closed windows prevent the inside air from cooling by circulation; the glass does not absorb outgoing infrared radiation.
2. What will be the effect on global climate of increasing amounts of human-made greenhouse gases such as carbon dioxide in the air?
Nobody knows for sure.
Scientists can calculate how much energy is added to the atmosphere by increases in greenhouse gases. Then, using sophisticated computer models, they attempt to simulate how the climate responds to the added energy. But no one knows how to calculate correctly the climate’s response to the added energy. Two of the many questions in this regard are the impacts of water vapor and clouds in the climate response. Scientists need to learn more about whether changes in atmospheric water vapor and clouds amplify or diminish the effects of human-made greenhouse gases on the earth’s climate.
3. Has the earth’s temperature increased over the last 100 years in step with increasing atmospheric CO2?
No.
The average global temperature of the earth has increased roughly 0.5°C over the last 100 years. The instrumental surface record of temperature sampled worldwide and going back over 100 years is shown in Figure 1. The amount of CO2 in the atmosphere has also increased in that period.
Figure 1. Changes in yearly average surface-temperature sampled worldwide, reconstructed for land and sea surface (solid line, University of East Anglia Climate Research Unit [CRU]), and land only (dashed line, NASA-Goddard Institute for Space Studies [GISS]).2 The temporary warming in 1997-1998 is a natural and unusually strong El Niño event and biases the estimated warming trend upward.
However, these two increases did not take place together. Much of the observed temperature rise of 0.5°C occurred before 1940, whereas most of the additional carbon dioxide (over 80%) entered the atmosphere after 1940. Increased greenhouse gases cannot explain a temperature rise that occurred before the major increases in these gases existed in the atmosphere.
Furthermore, from 1940 to 1970, carbon dioxide built up rapidly in the atmosphere, and according to the computer projections of climate, the temperature of the earth should also have risen rapidly. Instead, as the chart shows, the temperature dropped.
The increase in greenhouse gases cannot explain the rapid rise in temperature prior to 1940, and it cannot explain the drop in temperature from 1940 to 1970. The climate record over the last 100 years provides no support for the idea that human activities, such as burning coal and oil for energy, caused the early 20th century global warming. Natural factors must have caused most of that warming.
2 D. E. Parker et al., Interdecadal changes of surface temperature since the late nineteenth century, Journal of Geophysical Research 99, 14373 (1994), plus updates from the CRU website; J. Hansen and S. Lebedeff, Global trends of measured surface air temperature, Journal of Geophysical Research 92, 13345 (1987), plus updates from the GISS website. Note that the good agreement between the two different records – land alone and land plus ocean – is not understood.
4. Has the earth’s temperature increased over the past two decades?
Very little, by 0.05°C per decade in the lower atmosphere.
Starting in 1979, the temperature of the lower atmosphere (from the surface up to roughly 8 km) has been measured by satellites (See Figure 2). Instruments (Microwave Sounding Units [MSUs]) mounted on satellites take daily temperature readings by measuring the microwave radiation emitted by atmospheric oxygen molecules. The precision of the satellite temperature measurements is confirmed by the fact that they are in excellent agreement with temperatures measured independently by a worldwide network of radiosonde instruments carried aloft by balloons. Compared to the spotty coverage of the surface measurements, especially over the oceans, the satellite record provides essentially global coverage.
Figure 2. Changes in monthly average lower tropospheric temperature between latitudes 82°N and 82°S through August 1999, from satellite Microwave Sounding Unit (MSU) measurements. These data have been corrected for the recently reported effects of, for example, satellite orbit decay.3 The temporary warming in 1997–1998 is a natural and unusually strong El Niño event.
The combined land and ocean surface record (Figure 1) shows a warming trend of about 0.11°C per decade (1958–1998) and 0.19°C per decade (1979–1998), while the satellite temperature records (Figure 2) since 1979 show a warming trend of 0.05°C per decade.4 The contrast in temperature trends between the surface and satellite measurements of the lower atmosphere is puzzling because the computer models say the CO2-produced warming trend in the lower atmosphere should be larger than at the surface, but it is not.5 This important disagreement remains unexplained.
3 J. R. Christy, R. W. Spencer, and E. S. Lobl, Analysis of the merging procedure for the MSU daily temperature time series, Journal of Climate 11, 2016 (1998); F. J. Wentz and M. Schabel, Effects of orbital decay on satellite-derived lower-tropospheric temperature trends, Nature 394, 661 (1998); J. R. Christy, R. Spencer, and W. D. Braswell, MSU tropospheric temperatures: Dataset construction and radiosonde comparisons, Journal of Atmospheric and Oceanic Technology, in press (2000).
4 W. Soon et al., Environmental effects of increased atmospheric carbon dioxide, Climate Research, 13, 149 (1999). The 20-year periods can yield biased trends because of the relative shortness of the records. For example, a warm bias in the calculated trends results from the presence of the 1997–1998 El Niño event.
5 L. Bengtsson, E. Roeckner, and M. Stendel, Why is the global warming proceeding much slower than expected? Journal of Geophysical Research 104, 3865 (1999); J. T. Houghton et al., eds., Climate Change 1995 – The Science of Climate Change: Contribution of Working Group I to the Second Assessment Report of the Intergovernmental Panel on Climate Change (Cambridge: Cambridge University Press, 1996), 527 pp. Hereafter, IPCC 1995.
5. How precise are measurements of the earth’s temperature?
Temperatures taken by satellites are very precise; those taken from ground stations are less so.
Different estimates of recent trends in the average temperature of the earth vary widely in precision, depending on how and when they were made. Calculating the average surface temperature for a single year requires averaging local temperatures recorded at thousands of points all around the globe at different times of day and night throughout the year. Estimating trends in temperature in order to separate human-made from natural temperature effects requires precise record keeping over many decades. But precise land-based instrumental records are available only for a limited part of the earth’s surface and only since the middle of the last century, a comparatively short time span from which to assess natural climate changes.6
Most surface temperature measurements have been made over land, and primarily in inhabited regions. Measurements for the ocean, which covers three-quarters of the area of the globe, are sparse. Measurements from a single station are sometimes used to represent an area as large as a million square miles. Temperature records also have other biases that require correction. One important bias arises from the fact that recording sites in and near cities are subject to the urban-heat-island effect. These sites were originally in rural areas, but as more people moved in and the surrounding areas were developed, the local temperature may have increased for reasons unrelated to changes in atmospheric greenhouse gases.7
The most precise records of global temperature began in 1979, when continuous satellite observations started recording temperatures at different heights in the atmosphere. The globally averaged temperatures, derived from the satellites and balloons, of the layer of the atmosphere from the surface to a height of a few kilometers do not show the increasing warming trend over the last twenty years expected by the computer model projections of the effects of added CO2 in the air (see Figure 2).
6 P. J. Michaels, R. C. Balling, Jr., R. S. Vose, and P. C. Knappenberger, Analysis of trends in the variability of daily and monthly historical temperature measurements, Climate Research 10, 27 (1998).
7 “... the global time series since 1990 reveals that the full data set has warmed more than the rural during recent years and this coincides with a decreasing percentage of the rural stations in the full data set.” T. C. Peterson et al., Global rural temperature trends, Geophysical Research Letters 26, 329 (1999).
6. Is it possible that human-made global warming is occurring, but is masked by the cooling effect of air pollution?
This is not likely.
In attempting to explain the major discrepancy between computer projections of warming expected from increased greenhouse gases and the changes actually observed in the earth’s temperature, some researchers have suggested that the human-made warming might have been offset by a cooling effect of atmospheric pollution by sulfate aerosols – clouds of small particles released into the atmosphere when fossil fuels are burned. These aerosols reflect sunlight back to space and cause a cooling. When the models are modified to take this cooling into account, the predicted temperature increase lessens and moves closer to the observed trend for the past twenty years.8 However, a careful look at the patterns of temperature change shows that this cannot be correct. For example, the computer models predict a substantial warming trend in the Southern Hemisphere, while the satellite temperature measurements show a statistically significant cooling trend there. Aerosols cannot explain this discrepancy, because the concentration of aerosols in the Southern Hemisphere is very low; the source of the aerosols is mainly the heavily industrialized Northern Hemisphere, and the lifetime of the particles in the air is too short for them to accumulate over the Southern Hemisphere. Unlike CO2, which remains in the air for years and does build up over both hemispheres, the aerosols do not and so the Southern Hemisphere is relatively free of aerosol loading. Adding aerosol forcing to the models may bring the predicted global warming trend closer to the observed temperature trend, but then the observed hemispheric trends are incorrect.
8 B. D. Santer, K. E. Taylor, T. M. L. Wigley, J. E. Penner, P. D. Jones, and U. Cubasch, Towards the detection and attribution of an anthropogenic effect on climate, Climate Dynamics 12, 77 (1995); S. F. B. Tett, J. F. B. Mitchell, D. E. Parker, and M. R. Allen, Human influence on the atmospheric vertical temperature structure: Detection and observations, Science 274, 1170 (1996).
7. What does the record of past climates show about the relationship between changes in atmospheric CO2 levels and changes in global temperature?
The records show that changes in global temperature do not always follow changes in atmospheric CO2 levels.
For example, when scientists analyzed the relationship between atmospheric CO2 levels and temperatures dating back 250,000 years, inferred from ice cores drilled in Greenland and the Antarctic, they found that sometimes the concentration of CO2 was high when the temperature was low, and sometimes the CO2 was low when the temperature was high.9 Moreover, a careful analysis showed that some of the atmospheric CO2 changes did not precede the temperature changes, as the greenhouse warming theory would predict. Instead, changes in atmospheric carbon dioxide followed the temperature changes. The atmospheric CO2 changes were not the cause of the temperature changes; the CO2 changes were likely driven by vegetation changes in response to natural variations in air and sea-surface temperatures.
9 H. Fischer et al, Ice core records of atmospheric CO2 around the last three glacial terminations, Science 283, 1712 (1999); A. Indermühle et al, Holocene carbon-cycle dynamic based on CO2 trapped in ice at Taylor Dome, Antarctica, Nature 398, 121 (1999).
8. How much does the global climate vary naturally?
Natural climate changes can occur rapidly.
Over the last million years, the earth’s climate has shifted dramatically between ice ages and warmer periods like the present one, called the Holocene. The glacial periods, with major advances of ice sheets, have generally lasted about 100,000 years, while the interglacial periods have lasted about 10,000 years. The transition between glacial and interglacial conditions can take place in less than a thousand years – sometimes in as little as decades. Such a dramatic climatic shift occurred near the end of the last major ice age, about 15,000 years ago. First, a brief warming occurred, then the ice age returned for roughly 1,000 years. Finally, by 11,000 years ago, the climate was quickly warming again.10
During the last 10,000 years the climate has remained relatively warm and stable, allowing humans to advance and prosper. But even during this generally warm period the temperature has fluctuated significantly. The climate was warmer than it is today about 6,500 years ago, during the Holocene Climate Optimum. There is evidence that roughly 1,000 years ago regions of the earth again were substantially warmer than they are today, during the period called the Medieval Climate Optimum. By the 14th century, a cold period called the Little Ice Age had begun. The warming begun in the late 19th and early 20th centuries seems to be a natural recovery from the Little Ice Age.11
As stated earlier, the average surface temperature over the last hundred years has increased by about 0.5°C. Much of the 0.5°C warming occurred early in the 20th century, before the major increase in greenhouse gases in the atmosphere, so most of the 0.5°C warming must have resulted from natural factors of climate change. The early 20th century warming could not have been caused by human-made greenhouse gases.
Closer to the present, some researchers believe that the 1980s were the hottest decade in 100 years and that some years in the 1990s may have been hotter still. However, the trend in surface temperature is one or two tenths of a degree occurring over a decade or two. Such a change is well within the range of the climate’s natural variations whose mechanisms are not all understood. It is safe to conclude “the natural variability of climate adds confusion to the effort to diagnose human-induced climate change. Apparent long-term trends can be artificially amplified or damped by the contaminating effects of undiagnosed natural variations.”12
10 R. B. Alley et al., Abrupt increase in Greenland snow accumulation at the end of the Younger Dryas event, Nature 362, 527 (1993); K. C. Taylor et al., The Holocene - Younger Dryas transition recorded at Summit, Greenland, Science 278, 825 (1997).
11 H. H. Lamb, Climate, History and the Modern World (London and New York: Methuen, 1985), 387 pp.
12 J. D. Mahlman, Uncertainties in projections of human-caused climate warming, Science 278, 1416 (1997).
9. What influence does the sun have on global climate change?
Scientists are studying this question with great care. It now seems that the sun has a significant influence on climate.
One natural factor in climate change may be variations in the brightness of the sun, over decades to centuries, that are in step with changes in the sun’s magnetism, which has a period of roughly 11 years and is known as the sunspot cycle. Brightness changes have only been recorded over two decades of satellite observations. If brightness changes were to continue to occur over decades to centuries, they might cause terrestrial temperature change.
The climate record indicates a solar effect of this kind. One example is the record of the sun’s magnetism and reconstructed land temperatures of the Northern Hemisphere over 240 years (Figure 3).13 If changes in the sun’s magnetism track changes in the sun’s brightness, over these long time scales, they might explain the high correlation of solar magnetism with terrestrial temperature change. Climate models suggest that changes of roughly 0.5% in the sun’s brightness would produce global average temperature changes of about 0.5°C over a century or so.14
Figure 3. Changes in the sun’s magnetism (represented by the length of the 22-year Hale cycle, solid line) and changes in the Northern Hemisphere land temperature (dotted line). Shorter magnetic cycles are more intense and suggest a brighter sun. (See Endnote 13)
13 S. Baliunas and W. Soon, Are variations in the length of the activity cycle related to changes in brightness in solar-type stars? Astrophysical Journal 450, 896 (1995). The reason Northern Hemisphere land temperatures are plotted instead of global temperatures is that the Northern Hemisphere record extends back further than the global. Where the two records overlap, there is good agreement.
14 W. H. Soon, E. S. Posmentier, and S. L. Baliunas, Inference of solar irradiance variability from terrestrial temperature changes, 1880–1993: An astrophysical application of the sun-climate connection, Astrophysical Journal 472, 891 (1996). Although change in the sun’s brightness is the simplest proposed mechanism for affecting terrestrial global temperature, the sun’s output comes in many wavelengths; it also emits energetic particles. Both the sun’s light and particles vary in time, space, and frequency. Components of the earth’s climate system may respond to different aspects of the sun’s diverse energy outflows.
10. What is the greenhouse “fingerprint”?
It is a unique pattern of changing climate whose detection would suggest that recent warming is caused by greenhouse gases from human activities, as opposed to natural processes.
According to the computer simulations of climate, three major features of the greenhouse fingerprint are:
• An increasing trend in global surface temperature, currently of 0.2°C to 0.3°C per decade.15
Surface temperature measurements show an increase of less than 0.2°C per decade since the late 1970s, at the low end of the forecast. However, more precise satellite and balloon measurements find no statistically significant increasing temperature trend.
• An increasing trend in Arctic temperatures about twice that of the global average temperature.16 Over the past fifty years, the Arctic should have warmed by 1°C or more.
The computer models predict that the Arctic will be especially sensitive to greenhouse gas warming. But Arctic surface and balloon measurements indicate no warming trend during the past 40 years. Lower tropospheric temperature measurements made by satellites during the last 20 years also show no warming trend in the Arctic.17
• A relatively greater warming of tropospheric temperatures (roughly the lower 8 km in the atmosphere) when compared to the surface with a cooling in the stratosphere (roughly 10–25 km).
This common fingerprint is often misrepresented and misunderstood. In addition to the contradiction presented by the observed lack of warming of the troposphere compared to the surface warming over the last 20 years (see question 4), there are important unresolved questions. For example, computer models predict a cooling of the stratosphere from increased CO2, but this expected cooling is difficult to see among other, more dominant effects from volcanic aerosols to changes in stratospheric ozone and solar ultraviolet radiation.
15 IPCC 1995, p. 301.
16 S. Manabe, R. J. Stouffer, M. J. Spelman, and K. Bryan, Transient responses of a coupled ocean-atmosphere model to gradual changes of atmospheric CO2. Part I: Annual mean response, Journal of Climate 4, 785 (1991).
17 The satellite MSU (1979–1998) and balloon radiosonde date (1958–1998) show no net warming in the high (60°–90°N) northern latitudes. See ftp://wind.atmos.uah.edu/msu/t2lt and J. K. Angell, Comparison of surface and tropospheric temperature trends estimated from a 63-station radiosonde network, 1958–1998, Geophysical Research Letters 26, 2761 (1999).
11. Are computer simulations of the earth’s climate accurate?
No.
As researchers have come to a better understanding of the workings of climate, the projections have changed substantially. For example, the middle-range estimates of global temperature increase over the next 100 years from the United Nations’ Intergovernmental Panel on Climate Change (IPCC) have dropped significantly, from 3.3°C in 1990 to 2°C in the 1995 report.18
To understand why there are such huge uncertainties in the computer simulations, consider that the additional energy added to the climate system by the doubling of atmospheric CO2 is about 4 watts per square meter (W/m2) – a small amount of energy compared to the amount of the sun’s radiation (342 W/m2) at the top of the atmosphere. But 4 W/m2 is also small compared to the uncertainties in the climate change calculations. For example, knowledge of the amount of energy flowing from equator to poles is uncertain by an amount equivalent to 25–30 W/m2. The amount of sunlight absorbed by the atmosphere or reflected by the surface is also uncertain by as much as 25 W/m2. Some computer models include adjustments to the energy flows of as much as 100 W/m2. Imprecise treatment of clouds may introduce another 25 W/m2 of uncertainty into the basic computations.19
These uncertainties in modeling climate processes are many times larger than the 4 W/m2 input of energy resulting from a doubling of CO2 concentration in the atmosphere. It is difficult to see how the climate impact of the 4 W/m2 can be accurately calculated in the face of such huge uncertainties. As a consequence, forecasts based on the computer simulations of climate may not even be meaningful at this time. A comparison of nearly all the most sophisticated climate models with actual measurements of current climate conditions found the models in error by about 100% in cloud cover, 50% in precipitation, and 30% in temperature change. In addition, even the best models give temperature change results differing from each other by a factor of two or more.20
According to the computer simulations, the temperature of the earth should have increased by at least 1°C since the beginning of the century because of increases in atmospheric greenhouse gases. In fact, the temperature actually increased by only 0.5°C, and, as noted above, much of that increase occurred prior to 1940, before some 80% of the CO2 had entered the atmosphere. Only a few tenths of a degree at most could have been caused by increases in atmospheric CO2. That is 3–4 times less than the computer models predicted. If the predictions exaggerated the warming to date by a factor of 3–4, they are unreliable for projecting the future climate change.
If the model projections for the last two decades are compared to the temperature trends of the lower atmosphere as measured by satellites and balloons, then the model projections must be lowered by an even larger factor.
The observed surface and lower-atmosphere temperatures do not support predictions of dramatically rising temperatures from increased atmospheric greenhouse gases.
18 See IPCC 1995, p. 6.
19 R. D. Cess et al., Absorption of solar radiation by clouds: Observations versus models, Science 267, 496 (1995); T. P. Charlock and T. L. Alberta, The CERES/ARM/GEWEX Experiment (CAGEX) for the retrieval of radiative fluxes with satellite data, Bulletin of the American Meteorological Society 77, 2673 (1996); R. S. Lindzen, Can increasing carbon dioxide cause climate change? Proceedings of the National Academy of Sciences USA 94, 8335 (1997).
20 T. P. Barnett, Comparison of near-surface air temperature variability in 11 coupled global climate models, Journal of Climate 12, 511 (1999); W. L. Gates et al., An overview of the results of the Atmospheric Model Intercomparison Project (AMIP I), Bulletin of the American Meteorological Society 80, 29 (1999).
12. How much will the earth’s temperature rise if the amount of human-made CO2 in the atmosphere continues to increase in the next 100 years?
There is no definitive answer to this question at present.
First, it is difficult to project trends in atmospheric CO2 concentration because the gas is absorbed and released by the ocean, soil and vegetation. Second, it is also difficult to calculate the response of the climate to increased atmospheric CO2 as well as to independently occurring natural climate changes. Current computer simulations of the climate suggest that global warming from increased greenhouse gases may increase the global temperature by somewhere between 0.8°C and 4.5°C by the year 2100, a range too wide to be meaningful.21
Moreover, according to these same computer models, global temperatures should now be increasing at a significant rate – as much as 0.3°C per decade. But this rate is higher than the recent observed trends measured by satellites, balloons, and surface instruments which suggests that the computer simulations are exaggerating the effect of the increases in CO2.
21 IPCC 1995, p. 40 and Chapter 6.
13. Will the earth’s climate change in other ways?
Predictions of changes in other aspects of climate, such as precipitation and sea-level rise, are even more uncertain than the projections of global temperature.
Average global temperature is a crude measure of the climate of the planet; it is more important to know how different regions will be affected by changes in seasonal temperature averages and ranges, precipitation, wind patterns, the distribution of different plant and animal species, and other climate-related phenomena. But computer models are no more capable of telling us about regional climate change than they are of predicting globally averaged climate change. One example comes from the comparison of the results of eighteen computer simulations of the warmer and wetter conditions that prevailed in Northern Africa around 6,000 years ago. The average of modeled precipitation is too low by a factor of two to three to sustain the lush vegetation known to have been present.22 Until the computer models, and the physical aspects of the climate coded in them, improve substantially, regional projections remain highly speculative.
22 S. Joussaume et al., Monsoon changes for 6000 years ago: Results of 18 simulations from the Paleoclimate Modeling Intercomparison Project (PMIP), Geophysical Research Letters 26, 859 (1999).
14. Will global warming produce a rise in sea level and cause major flooding?
As computer simulations have become more sophisticated, projections of rising sea levels have become much smaller.
Knowing the response of sea ice to changing patterns of temperature and precipitation at high latitudes is critical to estimating future sea-level change, but the interaction of sea-ice with the climate is not well understood at present. Predictions in 1980 assumed that the polar ice sheets would melt, contributing to a catastrophic 25-foot rise in sea level. That estimate was reduced to three feet by 1985 and then to one foot in the 1995 report by the U.N. IPCC. Satellite, balloon and surface records indicate that the atmosphere above the Arctic has not warmed substantially in the last several decades, and more limited surface regional records even suggest an Arctic cooling over the last 40 years.23 If the arctic air were to warm, it would still be well below freezing but would hold more moisture because the cold air in these regions is normally very dry. With more moisture in the atmosphere, snowfall would increase and the ice sheets may actually grow.
As for records of sea-level change, tide-gauge measurements indicate no acceleration in sea-level rise in the 20th century.24 Records of sea level, based on precise measurements made by the TOPEX/POSEIDON satellites, show a small trend of 2 mm per year in sea-level rise from 1993 to 1997.25 These measurements imply that if greenhouse gases continue to rise and the global temperature increases as much as the computer simulations say, the estimated rise in sea level over the next 100 years will be less than one foot.
23 J. D. Kahl, D. J. Charlevoix, N. A. Zaitseva, R. C. Schnell, and M. C. Serreze, Absence of evidence for greenhouse warming over the Arctic Ocean in the past 40 years, Nature 361, 335 (1993); I. Polyak and G. North, Evaluation of the Geophysical Fluid Dynamic Laboratory general circulation model climate variability. Variances and zonal time series, Journal of Geophysical Research 102, 1921 (1997).
24 B. C. Douglas, Global sea level acceleration, Journal of Geophysical Research 97, 12699 (1992).
25 R. S. Nerem et al., Improved determination of global mean sea level variations using TOPEX/POSEIDON altimeter data, Geophysical Research Letters 24, 1331 (1997).
15. Will global warming produce more violent storms?
This is not likely.
According to the 1995 IPCC report, “Overall, there is no evidence that extreme weather events, or climate variability, has increased, in a global sense, through the 20th century...”26 For example, reliable records in the North Atlantic show that during the past fifty years the number of severe hurricanes has not increased and the average maximum intensity of all hurricanes has weakened.27 The number of Atlantic hurricanes was above average in both 1995 and 1996, but these followed a period, 1970–1994, of below-average hurricane activity compared to previous years, so the multi-year average of hurricanes has not appreciably changed in several decades.28 A low incidence of tropical storms in 1997 is thought to be linked to the El Niño conditions in the tropical Pacific Ocean, while 1998 had an above-average number of hurricanes. Expectations for 1999, with no El Niño, were for an above-average number of hurricanes. Such decade-to-decade fluctuations in hurricanes are unrelated to increased atmospheric CO2.29
The increasing dollar cost of storm and other weather-related catastrophic insurance losses, erroneously cited as proof of increases in weather extremes in recent years, can be accounted for by the rise in property values, development and population, especially in hurricane-prone areas because hurricane losses dominate the weather catastrophe costs. A comparison over time of the average economic impact of storms can be made by adjusting property losses to current values. This calculation shows that the cost per large storm, adjusted for current conditions, has varied substantially from one decade to another, but that recent storm damage is no higher than in some earlier decades.30 Recent storm losses have not been exacerbated by increases in atmospheric carbon dioxide.
Also, heavy rainfall has not increased significantly in the U.S. over the past 80 years. While the percentage of rainfalls of 1–2 inches per 24 hours has increased slightly in recent years, it showed a faster rise early in the 20th century.31
26 IPCC 1995, p. 173.
27 C. W. Landsea et al., Downward trends in the frequency of intense Atlantic hurricanes during the past five decades, Geophysical Research Letters 23, 1697 (1996); M. C. Serreze et al., Icelandic low cyclone activity: Climatological features, linkages with the NAO, and relationships with recent changes in the Northern Hemisphere circulation, Journal of Climate 10, 453 (1997).
28 W. M. Gray et al., Summary of 1998 Atlantic tropical cyclone activity, verification of authors’ seasonal activity prediction, at Colorado State University website http://www.typhoon.atmos.colostate.edu/forecasts/1998/nov98/index.html.
29 W. M. Gray et al., Early August forecast of Atlantic seasonal hurricane activity and U.S. landfall strike probabilities for 1999, at Colorado State University website http://www.typhoon.atmos.colostate.edu/forecasts/1999/aug99/.
30 S. A. Changnon et al., Effects of recent weather extremes on the insurance industry: Major implications for the atmospheric sciences, Bulletin of the American Meteorological Society 78, 425 (1997); R. A. Pielke, Jr. and C. W. Landsea, Normalized hurricane damages in the United States 1925–1995, Weather and Forecasting 13, 621 (1998); K. E. Kunkel, R. A. Pielke, Jr., and S. A. Changnon, Temporal fluctuations in weather and climate extremes that cause economic and human health impacts: A review, Bulletin of the American Meteorological Society 80, 1077 (1999).
31 T. R. Karl, R. W. Knight, and N. Plummer, Trends in high-frequency climate variability in the twentieth century, Nature 377, 217 (1995).
16. Will global warming cause the spread of infectious diseases?
This is not likely.
The evidence shows that if global warming were to occur, it would not have a major impact on the spread of infectious diseases, like malaria, to countries in high northern latitudes where other factors, such as the level of economic development, the quality of medical care, and lifestyle are major deterrents to mosquito-borne diseases.32
Malaria and yellow fever were once common in non-tropical regions. During the Little Ice Age when it was much cooler than it is today, malaria was still a major problem in Europe.33 Earlier in this century, the Soviet Union, not known for its balmy weather, experienced a major malaria epidemic. At the same time, Alaska reported many malaria cases.
These and other diseases thrive in various climates – warm as well as cool. What has made the difference is the level of economic development that provides access to modern medicine, higher living standards, and other means to prevent the spread of illness.34
32 P. Reiter, Global Warming and vector-borne disease in temperate regions and at high altitude, Lancet 351, 839 (1998).
33 P. Reiter, From Shakespeare to Defoe: Malaria in England in the Little Ice Age, Emerging Infectious Diseases 6, in press (2000).
34 D. J. Gubler, Resurgent vector-borne diseases as a global health problem, Emerging Infectious Diseases 4, 442 (1998).
17. Is there a consensus among climate scientists that greenhouse warming from human activities is a major threat?
No. Science is not aimed at building a politically potent consensus over questions of public policy.
Advocates of immediate precautionary actions often state there is nearly unanimous agreement among scientists that the globe is warming at an unacceptably rapid rate and that society is to blame. But the claim of a scientific consensus on the causes of global warming is not supportable. Consider these two points.
First, the report by the IPCC states that a human-caused warming 100 years from now might be as high as 4.5°C – a significant increase – or as low as 0.8°C.35 A 0.8°C warming over a century is comparable to the climate changes commonly encountered in nature. Thus, according to the IPCC, the combined projections of the models imply that the human-made warming 100 years from now will be somewhere between important and unimportant, hardly the basis for a meaningful consensus when the scientific uncertainty is so large. Furthermore, the IPCC report states that the human effect was difficult to quantify because it is small and masked by natural variability:
Our ability to quantify the human influence on global climate is currently limited because the expected signal is still emerging from the noise of natural variability, and because there are uncertainties in key factors. These include the magnitude and patterns of long term natural variability...36
Second, the idea of seeking a consensus on global warming reveals a misunderstanding of science itself. For science, facts are determined by the scientific method, wherein quantitative predictions resulting from a theory are refuted or confirmed by experiments. The known inadequacies of the present models mean they can tell us very little about the cause of climate change.
Climate scientists say it will take at least ten years of continuing observation and theoretical studies to decide whether increasing CO2 levels are likely to cause significant global warming. T. P. Barnett, co-reviewer of the 1995 IPCC report, states, “The next 10 years will tell; we’re going to have to wait that long to really see.”37 K. Hasselmann of Germany’s Max Planck Institute for Meteorology concurs, “It will take another decade or so [for the CO2-caused global warming] to work up out of the noise.” 38
35 See IPCC 1995, p. 40.
36 See IPCC 1995, p. 5.
37 R. A. Kerr, Greenhouse Forecasting Still Cloudy, Science 276, 1041 (1997).
38 R. A. Kerr, Greenhouse Forecasting Still Cloudy, Science 276, 1041 (1997). Even these assessments are highly optimistic because the necessary observing systems with demonstrated capabilities to detect the climate effect of increasing anthropogenic CO2 are not yet in place.
18. Does the threat of major climate change justify drastic reductions in CO2 emissions by the United States and other nations?
No.
Some argue that even if the probability of major climate change is small, the catastrophic consequences are so great as to justify action to avoid it, much as people take out insurance against comparatively remote risks. However, before buying insurance, one weighs the cost of the insurance against the risk of the event. In the case of human-made global warming, the cost of drastic reductions in CO2 emissions would be major economic disruption and diversion of large sums of money that could be spent in far more productive enterprises. What is more, there is no reliable actuarial table for disruptions from climate change. In other words, because we do not know if there will be serious climate change or what its impact might be, this is not the time to asses if the risks justify a great deal of insurance, or none at all. Furthermore, it is unclear how a unilateral reduction by the U.S. will help matters significantly when it is global emissions that affect the air’s concentration of CO2. Emissions from the developing world – China and India, in particular – will be expanding at a rapid rate over the same period and would overwhelm the proposed reductions of U.S. emissions in a few years.39
39 M. Parry et al., Adapting to the inevitable, Nature 395, 741 (1998).
19. Is there a clear policy on climate change and CO2 emissions which makes sense based on our current knowledge?
We have at least 25 years to research this issue before CO2 emission cuts need to be considered.
Even assuming the worse-case scenarios, delaying substantial cuts in CO2 emissions for the next 25 years would produce an additional global temperature rise of no more than a few tenths of a degree C by the year 2100.40 That means we have at least 25 years in which to sharpen our understanding of climate and seek valid predictions, without contributing to serious climate change. An incremental warming of a few tenths of a degree, spread over decades, constitutes no hazard while we seek important, additional information to build a foundation for national and worldwide energy policy. Policies made in haste, or based on poor information, are likely to have a destructive impact on the U.S. and world economies and the well-being of its citizens. Rather, we should foster efficient use of our resources so as to meet the world’s needs with minimal environmental impact.
40 T. M. L. Wigley, R. Richels, and J. A. Edmonds, Economic and environmental choices in the stabilization of atmospheric CO2 concentrations, Nature 379, 240 (1996); T. M. L. Wigley, The Kyoto Protocol: CO2, CH4, and climate implications, Geophysical Research Letters 25, 2285 (1998).
==============================
Predictions of Warming Continue to Drop (971014)
The extent of human impact on climate remains a highly complex scientific matter, as witness the by the latest report from the U.N. Intergovernmental Panel on Climate Change (IPCC). “Our ability to quantify the human influence on global climate,” said the IPCC, “is limited because … there are uncertainties in key factors.”
Indeed, global warming predictions by the IPCC for the next century have decreased by nearly 40% in the last seven years. In 1990 the first IPCC report predicted that without CO2 emission controls the average global temperature would increase 3.3 degrees C between 1990 and the year 2100 as a result of human activities such as the burning of coal and oil. Two years later and on the basis of better computer models of the global climate system, the IPCC reduced the predicted warming to 2.8 degrees C by 2100. The latest IPCC report, Climate Change 1995, reduced the predicted warming to 2 degrees C by 2100. With the cooling effect of aerosols included, the predicted warming drops to 1 degree C.
Our understanding of long-term climate change is as variable as the climate itself. V. Ramanathan of the Scripps Institution of Oceanography, a prominent member of the climate research community, said recently about current efforts to devise reliable predictions of climate change 100 years in the future, “I used to think of clouds as the Gordian knot of the problem. Now I think it is aerosols. We are arguing about everything.”
Our ability to model the future climate and predict the human impact on global temperatures cannot provide much guidance to policymakers interested in global warming.
The Fading Crisis
* In 1990 the IPCC predicted 3.3 degrees C of global warming by 2100
* In 1992 the IPCC predicted 2.8 degrees C of global warming by 2100
* In 1995 the IPCC predicted 1-2 degrees C of global warming by 2100
Are you getting worried?
==============================
Is There a Scientific Consensus on the Causes of Global Warming? (971105)
Do the experts agree that human activities, such as burning fossil fu-els like coal and oil, will cause dangerous global warming?
To answer this question it is best to take a look at what the scientists actually say about the greenhouse effect. The scientific portion of the report by the UN Intergovernmental Panel on Climate Change (IPCC) says that a human-caused global warming 100 years from now might be as high as 3.5 degrees C – a significant increase – or as low as 1 degree C. A one degree C warming over a century is comparable to the climate changes commonly encountered in nature. In other words, the IPCC scientists agree that the warming 100 years from now will be somewhere between important and unimportant. This is a consensus of sorts, but of no value for setting public policy on limits to burning coal and oil.
What is more, the whole idea of a “scientific consensus” betrays a misunderstanding of science itself. Scientific truth is not determined by a vote. The history of science shows that widely held opinions among scien-tists are often overturned by research and observation. Last month the Nobel Prize was given to Stanley Prusiner for his theory on brain disease that was once greeted with derision by a majority of his colleagues.
Observation is the test of scientific truth. So far, observations of the earth’s temperature has not revealed signs of a human-induced global warming.
==============================
Global Warming Projections vs. the Data: Are the Data Reliable? (971112)
According to projections by computer models of climate change, a temperature rise of about 0.4 degrees C should have occurred in the last twenty years because of the large increases in CO2 and other minor greenhouse gases. But temperature measurements from satellites for the period 1978-1997 show no temperature rise at all.
Some people argue that the satellite measurements are unreliable, but in fact they are the most precise measurements of global temperature available. The satellite temperature survey in-cludes 99% of the earth’s surface. Surface temperature measurements, however, are uneven over the three-quarters of the earth’s surface covered by oceans, and provide essentially no coverage of the polar regions.
But where ground-based measurements are accurate, for example in Europe and North America, the correlation coefficient between satellite and surface measurements is 0.95 – close to perfect agreement. (Perfect agreement would be a coefficient of 1.00.) This is also the case when one compares satellite data to the temperature measurements gathered from the network of weather balloons. Neither the satellites nor the balloons show any significant warming trend over the last twenty years.
Objections also have been raised to the satellite data on the grounds that they are a measure of temperatures in the atmosphere rather than the actual temperatures on the surface of the earth. However, the models predict at least as great a warming in the lower atmosphere as at the surface. Moreover, the precise temperature record provided by satellites is not affected by systematic errors like the urban heat-island effect, i.e., the artificial warming associated with heavily populated areas. Therefore, the lack of a warming trend in the satellite data indicates unambigu-ously that the actual warming is much less than the models predict.
In fact, no reliable global temperature measurements show the rise predicted by the com puter models. These results support the conclusion that the computer models are exaggerating the warming by a large factor. If global warming forecasts for the next century are corrected for this exaggeration, the warming due to human activities is so small as to be lost in natural climate fluctuations.
==============================
1997: Warmest Year Since 1400? (980630)
But why stop at 1400? Because that is just about the farthest back in the recorded past for which this statement is true. Go back just a few hundred years more to the period 1000 - 1200 AD and you find that the climate was considerably warmer than now. This era is known as the Medieval Warm Period. A 1996 Science article showed that the temperature in around 1000 AD was about 1 degree C warmer than it is today, (Keigwin). And a 1994 report in the journal Climate Change shows that this warm period was global in extent, (Grove and Switsur).
But by 1300 it began to cool, and by 1400 we were well into the Little Ice Age. It is no surprise that temperatures in 1997 were warmer than they were in the Little Ice Age.
So the statement, “1997 is the warmest year since 1400,” is deceptive. If 1997 had been compared with the years around 1000 AD, 1997 would have looked like a rather cool year.
Incidentally, no one knows what caused that warm period in the middle ages. But one thing we do know is that carbon dioxide from cars and fuel burning was not altering global climate in 1000-1200 AD. The Medieval Warm Period must have had a natural origin. The 1990 report by the UN Intergovernmental Panel on Climate Change notes, “there is no evidence that [the Medieval warm period] was accompanied by an increase in greenhouse gases.”
==============================
Global Warming and El Niño - No Connection (980709)
The Vice President and scientists at NOAA (National Oceanographic and Atmospheric Administration) claimed in a press release that “new data and analysis suggest that global warming is exacerbating the effects of El Niño.” They further maintain that data from the ten strongest El Niño weather events over the last century show they are increasing in frequency and are becoming warmer.
It was important for the Vice President and the NOAA experts to focus on the 20th century because had they included the 18th or 19th centuries it would have been clear that there is no connection between global warming and El Niño weather events.
El Niños occur every few years and can affect weather around the world. The most recent El Nino was indeed comparatively severe compared those earlier in this century. But compared to the El Niño in 1877-9 or 1789-93, or 1685-88, it was nothing special. Some of these earlier events had more severe global affect than the recent El Niño as noted in the science journal Nature (Vol. 393, 28 May 98, p. 318), with that of 1789 being one of the most severe on record.
Additionally, the suggestion that warmer weather causes harsher El Niños is also spurious. In warmer times some 5000 years ago El Niño actually disappeared altogether for thousands of years.
The evidence shows that attempts to link El Niño with human-induced global warming are without foundation.
==============================
Hot Times or Hot Air: The Sun in the Science of Global Warming (980807)
by Sallie Baliunas
The extent of human effects on global climate change remains a highly complex scientific matter, as the United Nations Intergovernmental Panel on Climate Change (IPCC) made clear in its last report:
Our ability to quantify the human influence on global climate is limited because the expected signal is still emerging from the noise of natural variability [NB: The signal has not yet been detected], and because there are uncertainties in key factors [NB: like natural factors]. (IPCC 1995, p. 5)
Given the complexities of climate, how can forecasts of climate change from increased greenhouse gases 100 years into the future be checked? One starts by noting that the increase in the different greenhouse gases in the atmosphere due to human activities over the last 100 years is effectively equal to roughly a 50% increase in the atmospheric concentration of carbon dioxide alone. That 50% effective increase in carbon dioxide concentration gives a way to test the accuracy of the computer forecasts of climate change simply by measuring the response of the climate to the increase in greenhouse gases that has already occurred.
1. Tests of climate projection scenarios against measurements
For example, all the IPCC 1995 scenarios make specific forecasts for warming that should have already occurred, including:
(i) Global warming of as much as 1 C;
(ii) Extremely large and rapid warming in the North Polar Region.
Both forecasts will be discussed.
(i) Global temperature records -- According to thermometer records collected near the surface, over land and sea, in the last 100 years as well as temperature estimates from proxy records, the temperature averaged from different parts of the world rose about 0.5 C since the late 19th century [Figure 1]. Although global warming has occurred, its cause is an issue of scientific study.
As noted above, the 100-year instrument record is important because it covers the period in which there has been an effective 50% increase in carbon dioxide. The computer scenarios say that there should already be a warming as much as 1° C in the globally averaged temperature as a result of increased greenhouse gases in the atmosphere. At first glance it seems that the observed warming occurred due to the increases in the minor greenhouse gases in the last 100 years and is good evidence for the validity of projections of global warming from human activities.
That conclusion is insupportable for several reasons. First, at least half of the warming seen in the surface temperature record occurred before about 1940, while most of the greenhouse gas increase in the atmosphere occurred after 1940. That means that most of the temperature rise of the last 100 years occurred before the substantial increases in greenhouse gases in the atmosphere from human activities. Of the 0.5 C rise observed, at most only one or two tenths of a degree can be attributed to increased greenhouse gases.
A second problem is the uncertainty of the urban-heat-island effect in the temperature records: temperature measurements made in growing, modern cities can read excess warmth due to the effects of machinery, pavement, tree-cutting, etc. A correction, as best as possible, can been made, but the process can introduce a systematic error to the average record.
Another uncertainty comes from uneven coverage in the surface records. Good records with near-continual coverage for the last 100 years apply to only 18% of the surface. Better coverage exists today of the surface; still, the Polar Regions as well as vast areas of the southern and tropical oceans are not adequately sampled.
Beginning in 1978 NASA satellites were launched and their measurements have yielded a record of nearly globally-averaged temperature [Figure 2]. Measurements are made of the lower troposphere and were discussed in a series of lectures by Dr. John Christy. The forecasts claim the increase in atmospheric greenhouse gases is now so large that the global temperature should be rising about 0.2 C per decade. But the satellite readings (validated by independent balloon experiments) show that the temperature has not changed at all in the last 19 years in response to the increased greenhouse gases.
An uncertainty of all instrumental records is their shortness, which limits our ability to compare the warming of the early 20th century natural fluctuations of the climate during other periods. No worldwide instrumental records go back further than the mid-19th century, but there are records or reconstructions of several regions going back further. For example, the natural variability of temperature in the mid-latitude Atlantic Ocean over the last 3000 years has been reconstructed from ocean-bottom sediments [Figure 3]. The longer perspective, hidden by the bias of the shortness of the instrumental records, shows substantial natural variability of temperature. Evident are periods like the Little Ice Age, reaching its coldest during the 17th and 18th centuries, and the Medieval Climate Optimum, a warming in the 10th - 11th centuries. That record does not stretch as far back as the Holocene Optimum, 6500 years ago, the warmest interval of the last 10,000 years after the end of the last major ice age. The record of natural variability indicates that the warming of the early 20th century is not unusual, either in amplitude or speed.
Neither the surface records nor the lower tropospheric temperature records show the substantial increasing warming trends expected from increased greenhouse gases, in contradiction to the projections from the computer scenarios.
(ii) Temperature Records of the Arctic -- According to the computer forecasts, the polar areas are very sensitive to global warming. The forecasts say that the Arctic region should have warmed by as much as 2 - 4 C in the last 50 years in response to increased greenhouse gases in the atmosphere. Instrumental measurements contradict the intense warming trend for that region projected by the computer scenarios. On the average over the last 40 years, the temperature record does not show an increasing warming trend. A longer-term view of the lower Arctic [Figure 4] comes from proxy records like tree-ring growth. In that record there is rapid warming in the early 20th century, but it began before 1920, and again, must be largely unrelated to increased greenhouse gases. Since 1950, that record suggests that the Arctic has cooled despite the increases in greenhouse gases.
In the test of the Arctic temperature record, the computer forecasts exaggerate the expected warming, this time, by more than ten-fold.
As a result of looking at the temperature information, one concludes two things: (1) the climate scenarios exaggerate the warming that should have already occurred (and likely also the future warming) as a result of increased greenhouse gases; and (2) most of the warming this century cannot have been caused by increased greenhouse gases, because the warming predates the greatest increases in the greenhouse gases.
2. What’s wrong with the computer forecasts?
The calculation of the response of the climate system to the energy input from increases in greenhouse gases is difficult because the climate system is a complex nonlinear system that is not well understood.
The most sophisticated of the computer simulations track five million parameters. Understanding of the physics of some of the processes (e.g., upper tropospheric water vapor) is incomplete; the measured values of some parameters are poor. The computer scenarios presently do not but need to span 16 orders of magnitude in spatial scale and to include ten million trillion degrees of freedom.
The computer programs calculate the effect of adding a small amount of energy, 4 W m-2, to a simulated climate. That amount roughly corresponds to a doubling of the atmospheric concentration of carbon dioxide. But the uncertainty in calculating, e.g., the effects of humidity, clouds and the flow of energy from the equatorial to the polar regions may be each at least five times larger. Such errors can give rise to area-by-area “flux adjustments” of up to 25 times larger in some regions of several coupled ocean-atmosphere simulations. When the unknowns in the climate simulations are more than an order of magnitude larger, it seems difficult to accept the calculated response of the climate to the small, added energy expected from doubling carbon dioxide.
Water vapor -- Compared to the temperature records, the computer projections exaggerate the warming that should have appeared. Why? The scenarios assume that the small warming from increases in the minor greenhouse gases like carbon dioxide is amplified by water vapor in the upper atmosphere. That is, water vapor is assumed to provide a strong, positive feedback for any minor warming. This assumption has been challenged by both developments in convection theory and new measurements. When the gain in temperature due to water vapor feedback is removed, doubling carbon dioxide yields roughly only 1° C warming or less, which is more consistent with the observed trends in the surface temperature records.
3. Natural factors of climate change: the sun
Another reason for exaggerated forecasts may rest in incomplete knowledge of natural variations, as the IPCC suggests. One such natural factor may be changes in the brightness of the sun over decades and centuries. The magnetism on the sun’s surface varies roughly every 11 years [Figure 5]. According to recent findings based on measurements from NASA satellites, the sun brightens and fades in its total energy output, in step with the 11-year cycle of magnetism. Not only the sun’s brightness, but also its flux of high-energy particles that bombard the earth, changes with the surface magnetism of the sun. The observed association of brightness change with magnetic change over nearly two decades is the basis for thinking that changes in the sun’s brightness occur over many decades, along with recorded changes in magnetism. If significant, brightness changes over decades could drive non-trivial global temperature change.
The climate record indicates a solar influence of this kind. An example [Figure 6] is the record of the sun’s magnetism and reconstructed land temperatures of the Northern Hemisphere over 240 years. The two curves are highly correlated over several centuries. Those changes in the sun’s magnetism may track changes in the sun’s brightness, for which direct measurements are lacking.
Assuming that the timing of the sun’s magnetic changes is a proxy for the sun’s changing brightness, computer simulations of the earth’s climate suggest that changes of 0.4% in the sun’s brightness could have produced global average temperature changes of about 0.5 C over the last 100 years.
Additional evidence points to the sun’s signature in the climate record over many millennia. Every few centuries the sun’s magnetism weakens to low levels sustained for several decades. An example is the magnetic low circa 1640 - 1720, when sunspots were rare and the sun’s magnetic field weak. That period coincided with a climate cooling called the Little Ice Age, when the global temperature is estimated to have been roughly 1° C colder than today.
Quantitative records of the sun’s magnetism over millennia come from measurements of the isotopes radiocarbon (14C, in tree rings) and 10Be (in ice cores). The reason that the isotope records yield information on the sun’s magnetism is as follows. Cosmic rays, energetic particles from the debris of nearby supernova explosions tens of millions of years ago, interact with the magnetic fields of the sun and earth and the earth’s atmosphere and ultimately can form 14C and 10Be. The amounts of 14C and 10Be formed in the earth’s atmosphere by this process are modulated by changes in the sun’s magnetism. Once formed, 14C in a carbon dioxide molecule may be incorporated in a tree ring through photosynthesis; 10Be may precipitate into an ice layer accumulating in the ice sheets at high latitudes.
The isotope records confirm the occurrence of the sun’s low magnetism in the 17th century, seen in the early telescopic records of sunspots, and reveal similar periods of low magnetism every few centuries, plus occasional, sustained magnetic maxima (circa 10th-11th centuries). During the periods of weak magnetism, the sun should be dimmer compared to the average; periods of high magnetism should mean a brighter sun. Those estimated brightness changes may seem relatively small -- a few tenths per cent for the large swings in magnetism -- but they are large enough, according to some climate scenarios, to explain changes in global temperatures of as much as ~1-2 C.
The influence of the sun on the climate can be inferred from tree ring records 5000 years long. They show that 6 out of 7 long-term lows in the sun’s magnetism correspond to cold spells. Records from Scandinavia covering 10,000 years show that 17 out of 19 coolings line up with lows in the sun’s magnetism.
Similar results are obtained from observations of surface magnetism and brightness changes in sunlike stars: changes of the sun’s brightness over decades may be as large as several tenths per cent.
The idea that the total energy output of the sun changes is one of the simplest mechanisms for the sun’s possible effect on climate change. But the fact is that the sun’s output comes in many wavelengths; it also emits energetic particles, and both are variable in time, space and frequency. British scientists have suggested that the sun’s changing ultraviolet light affects the ozone layer in the earth’s stratosphere, and in turn the dynamics of the climate. Danish astronomers have additionally proposed that the galaxy’s cosmic rays, modulated by the sun’s changing magnetism, alters the cloud cover and, hence, climate of the earth. The different components of the earth’s atmosphere and surface respond to different aspects of the sun’s diverse energy outflows, in ways that are yet unknown. Understanding of the possible effects of the changing sun on climate change is still evolving. New research should improve the computer scenarios in the area of natural variations in climate, which form the background against which human effects must be quantitatively assessed.
Comments
The best scientific evidence says that global warming as a result of increasing greenhouse gases in the atmosphere would be slow and insignificant compared to the natural changes of the climate, which are subjects of intense research. But what if that conclusion is wrong? Despite the best interpretation of the temperature records, what if a major global warming is occurring or about to occur, but its signal cannot be detected? From the best science and economics emerges an opportunity for a “no regrets” policy of intense research while deep emission cuts are delayed. Consider first that the penalty paid in the increase of projected temperature in the next century by delaying severe reductions of greenhouse gas emissions is small. For example, assume the IPCC’s current estimate: that global warming will cause a temperature rise of roughly 2 C by the year 2100. In that case the extra temperature rise that will occur by delaying up to thirty years action on policies to limit greenhouse gas emissions is a few tenths of a degree C. The penalty of an extra few tenths of a degree, spread over a century, will be entirely negligible against the backdrop of natural fluctuations. Consider further that the projected warming -- judged by the temperature records -- is likely exaggerated. Should severe emission cuts be delayed, two major benefits may result: first, with further research a better understanding of climate change should emerge and lead to an improved estimate of the timing and magnitude of any problems. Second, mitigation and adaptation should become more affordable as technology advances. Together those considerations suggest a slow emergence of any global human effect and an opportunity to take the time to insure the best response to the possibility of human-caused climate change.
Figure Captions
Figure 1 -- Land and sea surface temperatures sampled world wide, compiled and analyzed by the United Kingdom Meteorological Office (for details of analysis, see D. E. Parker et al., 1995, Climatic Change, 31, 559, for marine records and P. D. Jones, 1994, Journal of Climate, 7, 1794. Updates kindly provided by UKMO.
Figure 2 -- Annually averaged global temperatures of the lower troposphere measured by satellite (Christy and Spencer; see Note 5).
Figure 3 -- Reconstructed temperatures of the Sargasso Sea (Keigwin 1996). The horizontal line marks the level of the current, instrumental temperature.
Figure 4 -- Reconstructed temperatures (highly weighted by summer temperature) of the near-Arctic region (Overpeck et al. 1997).
Figure 5 -- Record of Sunspot Number.
Figure 6 -- Changes in the Sun’s magnetism (the length of the 22-year, or Hale magnetic polarity cycle, dotted line) and changes in Northern Hemisphere land temperatures (solid line). Shorter magnetic cycles are more intense which suggests a brighter sun (Baliunas and Soon 1995).
==============================
Climate Change: Real and Imaginary (000710)
by Jeffrey Marsh
Does the world face a future where the relatively benign climate the world enjoyed during the 20th century will become much more hostile? History suggests that it may. Scarcely a week goes by without scientists announcing new evidence of massive past climate disruptions. For example, a recent paper in Nature described the historical behavior of Africa’s climate, based on an examination of 1,100 years’ worth of sediments extracted from a 20-foot soil core from Kenya. The authors found a pattern of catastrophically severe, extended droughts alternating with wetter periods. In the words of Dr. Dirk Verschuren of the University of Minnesota: “We have to anticipate that a major catastrophic drought will happen sooner or later”...most likely within the next 50 to 100 years. And closer to home, researchers have discovered that the depression-era Dust Bowl, the worst U.S. drought of the 20th century, which forced the emigration of 60 percent of the people it affected, was typical of droughts that have struck the U.S once or twice a century since 1600 or so.
Other natural climate changes occur with greater frequency than these once-or-twice-a- century catastrophes. We have all heard about El Niño and La Niña, oscillations in the temperature of the Pacific Ocean which disrupt world weather patterns every few years. But a larger scale phenomenon, the Pacific Decadal Oscillation, changes average ocean temperatures every twenty or thirty years. Oceanographers at the Jet Propulsion Laboratory believe that the Pacific has recently flipped from the warmer state of the past quarter-century into a cooler state resembling that which prevailed between the 1940s and the 1970s. Some climate watchers then feared that falling global temperatures heralded the approach of a new ice age. In the early 1980s, when the average global temperature began to rise again, some of the same researchers and their younger successors began sounding the alarm about global warming. They attribute part of the 1o F rise in average global temperature over the course of the 20th century to steadily increasing atmospheric levels of carbon dioxide and other man-made “greenhouse gases, “ and some assert that unless greenhouse emissions are curbed, we may face catastrophic climate changes including devastating floods, calamitous droughts, super hurricanes and killer heat waves.
These forecasts of global warming are based on computer simulations of the world’s climate, which give divergent results depending on the particular model used, and are far too crude to credibly forecast how climate is likely to change on any scale less than hemispheric. Even ignoring these caveats, the modelers’ average estimate of greenhouse warming for the entire 21st century is about 3.5°F, or about one-thirtieth of a degree per year. That is far less than the unpredictable temperature fluctuations that occur annually, so its effects from year to year should be far smaller than natural weather disruptions.
In the United States, the death toll from floods and hurricanes has decreased in large measure because people are able to escape in time, thanks to improved warning time and the virtually universal ownership of private automobiles whose emissions so exercise the prophets of global warming. Improving the ability of the rest of the world to cope with natural disruptions will also come with increased mobility and greater engineering capability. That will require using all the resources of material and energy at our disposal. It would be foolish to restrict their use for fear of global warming, a minor source of disruption compared with Mother Nature.
==============================
Coaxing Nature to Reveal 1,000 Years of Earth’s Climate (030502)
The 20th century may not have been so extraordinarily hot after all, according to a climate study of the last thousand years, which confirms historical accounts of fig trees growing in Germany and early grape harvests in England during medieval times.
The study is part of a fast-emerging field in which scientists combine the data from many natural indicators of past climates to reconstruct what sorts of temperatures and rainfall were experienced over large areas of the globe long before scientific weather records were kept. Such work is providing a much better picture of the past climate, a subject of increasing importance after a century in which the Earth’s average temperature increased by one degree Fahrenheit.
“We felt it was time to pull together a large sample of recent studies from the last five to 10 years and look for patterns of variability and change,” said Willie Soon, an astronomer at the Harvard-Smithsonian Center for Astrophysics.
Soon, along with astronomer Sallie Baliunas and others, integrated more than 240 paleoclimatic studies in order to better understand weather extremes of the past 1,000 years. The team reviewed four decades of research, including work on ancient tree rings, glacier ice cores, sediments from lakes, rivers and seafloors, historical records, coral reefs, stalagmites, fossils, dust, pollen, and many other natural indicators that vary depending on the temperature, precipitation, and other climate factors.
Their work, published in a recent issue of the journal Energy and Environment, suggests that there really was a “Little Ice Age” from 1300 to 1900 when unusually cold global temperatures froze rivers that today remain ice-free year-round. They also found evidence for a medieval warm period from 800 to 1300 when, historical records show, fig trees grew as far north as Germany. This 500-year period was warmer than the 20th century, Soon believes.
The finding that the 20th century was not the hottest of the last millennium is controversial in part because it undercuts the argument that burning oil and other fossil fuels is the leading cause of the current temperature increase. However, if the temperature was even warmer before large-scale use of fossil fuels, perhaps the current warm period reflects natural climate variation. As a result, Soon urges caution in concluding that human action has caused global warming.
“It points to the natural variability of the climate system,” he said in an interview with Canada’s National Post. “It’s quite likely [some of the warming] is simply due to the dimming and brightening of the sun.”
Other researchers disagree with Soon’s conclusion that the Middle Ages may have been warmer than the 20th century, noting that reconstructing the climate record is a matter of interpretation.
Some even suspect a political motive in releasing the research, funded by NASA, the Air Force Office of Scientific Research, the National Oceanic and Atmospheric Administration, and the American Petroleum Institute. A Canadian climate scientist told the National Post that the research provides cover for the Bush administration’s opposition to the Kyoto Accord, which attempts to rein in the release of carbon dioxide and other so-called greenhouse gases that trap heat in the atmosphere.
However, even Soon’s critics agree that studies such as his, which bring together a variety of measures to flesh out climate history, are rapidly coming of age. Over the past eight to 10 years what’s called multi-proxy mapping has become more common, says Malcolm Hughes of the University of Arizona’s Laboratory of Tree-Ring Research. Hughes and his colleagues have just published in the International Journal of Climatology a 1,000-year climate record for New Mexico and Arizona based on two methods of analyzing a set of 19 long-lived trees.
The trick to making sense of the diverse paleoclimate record is to understand that some measures are more precise than others, says Hughes. For instance, rings on trees in Canada may tell you something about summer-to-summer changes in precipitation, while lake sediments, stalagmites, and ice cores may not record every year and give more of a decade-long or 50-year picture.
“It’s a different activity to put all of them together and reconstruct the climate of North America as a whole,” said Kevin Trenberth of the National Center for Atmospheric Research in Boulder, Colo. It takes a lot of collaboration. A tree ring specialist, for instance, knows the strengths and weaknesses of their natural archive, while a climate modeler can piece it all together into simulations that incorporate interactions of the oceans, atmosphere, land surface, ice, vegetation, and water cycles so that it all makes sense.
The danger, says Hughes, is that without the right expertise, climate proxies can be mixed and matched to produce inaccurate pictures of the past. “You have to compare like with like and you have to be able to calibrate the data,” said Hughes. By calibrate, Hughes means tying tree rings or other climate proxies to real meteorological data, such as thermometer and rainfall records. This requires that the natural archive a scientist is using overlaps a period of time when thermometers and rainfall gauges were in use somewhere nearby -- a tall order in many parts of the world.
For example, 2,000-year-old bristlecone pine trees now living on a mountaintop in Nevada can have a core extracted (without harm to the tree) and the most recent annual rings compared to meteorological records of the area dating back about a century. Once a century of tree rings can be calibrated to local temperature and rainfall records, and the details of how the rings change with the changing conditions, the process can be reversed and the rest of the tree ring record can be deciphered to reveal what sort of rainfall and temperature patterns were present for 2,000 years.
The process quickly gets complicated when proxies from many areas are brought together to map out ancient climate trends for a region. Because different proxies yield varying pictures of changes through time, some paleoclimate maps can look vague and generalized. It’s also a matter of having enough computer power to handle not only the data, but to incorporate it with the oceanic, atmospheric, and other models, says Hughes.
But the results will be worth it. Once the millennial records of changes in oceans, land, and air are sorted out, they can be used to fine-tune computer climate models that take all the same parts of the puzzle into account, says Trenberth. And once those models can be made to reproduce the past climate changes, they can begin forecasting what might happen next. No one knows how accurate such models will be, but it’s certain they will need a lot of data and computer power to take into account all the variables that influence the Earth’s climate.
Meanwhile, the natural climate archive is disappearing faster than scientists can gather data. “Ice is melting, corals are being destroyed, trees are being cut down,” said Trenberth. “Collecting needs to speed up.”
This story ran on page C9 of the Boston Globe on 5/20/2003.
==============================
Combatting global warming would be a waste (030725)
by Sallie Baliunas
HUMANS RECORD historical events, Herodotus wrote, “in the hope of preserving from decay the remembrance of what men have done.”
Nature also writes its own history. And when coupled with that written by men, it can ameliorate the tendency to sensationalize current trends in climate into something unusual or dangerous.
Recently, Sen. John Kerry of my home state, Massachusetts, and a leading Democratic Party presidential candidate, added to the alarmism over climate change. At an environmental conference in Washington, he compared the “threat of global warming” with that of the Cold War, indicating that it required the same mobilization of national resources as was needed to defeat Soviet communism.
In a similar vein, attorneys general from six states are suing the federal government to enforce reductions in carbon dioxide emission, which is essential to life on the planet and has never been classified as a toxic pollutant but is blamed by alarmists for warming the globe. New York and some other states are even considering legislation for the state to enforce reductions in the emission of CO2, which arises mainly from burning fossil fuels.
These domestic calls for action echo a United Nations-sponsored worldwide plan, called the Kyoto Protocol. It requires signatories to reduce their greenhouse gas emissions based upon the notion that the Earth is dangerously warming.
The historical record -- both man and nature’s -- doesn’t support this view.
It is true that, according to thermometer measurements, the Earth was warmer by some 0.6 degrees Celsius at the end of the 20th Century than it was in the second half of the 19th. And because the 20th Century also coincided with an increased concentration of human-made greenhouse gases in the air, it may be argued that the 20th Century’s warmth -- and future global warming -- was and will be caused, at least in part, by the burning of fossil fuels.
But to get a proper estimate of the amount of human-made global warming a demonstration is required that the 20th Century actually was unusually warm, and that the 19th Century was normal. Were they?
To find the answer, we must go back several centuries to a period when the amount of greenhouse gases emitted from human activities was minimal. At that time, the instrumentally measured record of global temperature change was insufficient to detail climate’s natural fluctuations, as the record dates only to the mid-19th Century.
Nature’s record, however, goes back much further.
What makes up that record? It is natural indicators -- or proxies -- of climate information derived from glaciers, boreholes, coral, tree growth, sediments of pollen, insects or sea organisms, river effluvia, dune migration, stalactites and stalagmites, plus human documentary evidence such as weather diaries or crop accounts.
The technique of studying proxies isn’t easy. There are many differences among proxies, so averaging across many proxies remains tricky. Another difficulty is that no one type of proxy is widely available to make a meaningful global average.
Because of these limitations, proxies are best viewed as records of local climate, with each accounted for in the context of its limits and uncertainties -- in time, geographical extent and climate sensitivity.
Nonetheless, despite the problems, there is a wealth of climate information from proxies that can now be culled using modern technology to provide a history of climate at many locations worldwide.
And a recent review ( http://cfa-www.harvard.edu/press/pr0310.html) by a team from Harvard University, of more than 240 scientific articles by over 1,000 researchers using the various proxy data shows that the climate in most locations was not extreme or unusual during the 20th Century. Instead, the warmest, or most extreme, climate for those locations occurred in the Medieval Warm Period, between the 9th and 14th centuries.
That period of extreme climate -- long before the air’s increase in greenhouse gas concentration from human activities -- must have natural explanations. Whatever they are, the results of the warming, as far as man was concerned, in most cases appear to have been more beneficial than dangerous. Vikings made their way to Greenland and Newfoundland in that period. And England had productive vineyards.
H.H. Lamb, the founder of the climatic research unit at East Anglia University, found that England’s climate was warm enough in the 12th and 13th centuries to support more than 50 vineyards, signifying that May frosts were rare. But natural swings in climate ended that environment, beginning with a period known as the Little Ice Age, lasting about from 1300 to 1900 A.D., during which Europe had more acute winters. The intensity of the Little Ice Age reached its peak from 1550 to 1700, bringing crop failures, disease and death. Many died of famine in Scotland during crop failures in seven of eight years at the end of the 18th Century.
That the last millennium has seen periods warmer than the 20th Century in many parts of the world where there is information means that the 20th Century was not unusual. Meanwhile, the 19th Century, where thermometer records begin, seems to have been the tail of an unusual cold period that had persisted for some centuries, perhaps as far back as the 14th Century in some areas. It was not so normal.
The scientific history drawn from nature and man’s observations over the last millennium suggests that a strong trend of human-induced warming does not exist. The scientific facts indicate that costly policies to combat global warming are unlikely to mitigate any of climate’s ever-present natural risks, but they could reduce society’s economic ability to cope with them.
This article appeared in the Providence (Rhode Island) Journal July 25, 2003.
==============================
Global Warming Smear Targets (030826)
by David R. Legates
While most of official Washington was captivated with the fight on the Senate floor to pass an energy bill before Congress left town for its August vacation, a vicious campaign was under way behind the scenes to smear two leading scientists for pointing out serious flaws in the science behind the theory of human-caused climate change.
The targets were Willie Soon and Sallie Baliunas, both astrophysicists at Harvard, who were characterized as fringe scientists whose work should be ignored. What did they do to attract such characterizations? They had the audacity to pull back the curtain on the wizard of global warming.
The issue focuses on a paper by them that supports the widely held view that the climate of the last millennium has been quite variable and includes a Medieval Warm Period and subsequent Little Ice Age. This is only controversial because it, and the wider body of scientific literature that exists, directly contradicts recent research by Michael Mann, a leading global warming proponent. Mr. Mann argues global air temperatures have been stable over the last 1,000 years, with the exception of the last 100. It is the “Mann-made” warming to which Mr. Soon and Ms. Baliunas have objected.
While most of these arguments are confined to academic discussions that the general public would find less than boring, this fight played out recently in front of the U.S. Senate Committee on the Environment and Public Works. It has also been echoed in several news accounts from academic journals to the New York Times.
Mr. Mann testified before the Senate committee that his research is the “mainstream view” because it is featured in a chapter of the U.N. Nations Intergovernmental Panel on Climate Change (IPCC) report, of which Mr. Mann was a lead author. Mr. Soon and Ms. Baliunas challenged Mr. Mann’s claim by reviewing the large body of literature that shows his claims to be unsubstantiated and his research to be fatally flawed. In truth, Mr. Mann’s work is the scientific outlier — the one study that does not fit with the wealth of scientific evidence.
Mr. Soon and Mr. Baliunas argue that Mr. Mann’s conclusions rest on a dubious manipulation of data. While many of the problems in Mr. Mann’s work require scientific expertise to understand, one flaw is so basic that everyone can understand it. Mr. Mann and his colleagues compiled a historical climate reconstruction — called the “hockey stick” because of its shape — primarily using tree ring records to infer air temperature trends. Their use of proxy data is not novel, but the methods they used and thus the results, certainly are. For example, Mr. Mann and his colleagues simply attached the surface temperature record of the 20th century to the end of the proxy record. This is an apples-to-oranges comparison as air temperature readings are not directly comparable to proxy records. However, putting the two different sets of data together in this way makes a stunning visual display for the average reader.
Also, in his analysis for the Northern Hemisphere prior to 1400, Mr. Mann uses data from nine locations in addition to statistical summaries derived from data for the Western United States only. Four of these additional locations are in the Southern Hemisphere, including Tasmania and Patagonia.
The widespread acceptance of this revisionist history was possible because the global-warming community was eager to accept the “hockey stick” as proof of human-caused climate change.
If it remained merely a disagreement about science and research methods, there wouldn’t be much of a story — or reason for concern. Unfortunately, it turned into a scientific lynching of Mr. Soon and Ms. Baliunas and anyone associated with them. For example, Chris de Freitas, the editor of Climate Research that published the paper, was criticized for having failed in his responsibilities of quality control, even though the paper passed an extensive peer-review process and the publisher defended Mr. de Freitas’ handling of the paper. It was argued Mr. de Freitas should be removed from his position simply for having published it. Even Mr. Mann, in his Senate testimony, dismissed Mr. de Freitas’ credentials solely because he “frequently publishes op-ed pieces in newspapers attacking IPCC and attacking [the] Kyoto [protocol].”
Why is all this important? Global warming alarmists would have governments impose significant regulations with tremendous economic implications. The Bush administration is under attack simply for stating that the science is uncertain whether human-induced global warming is occurring. At the same time, scientists that add credence to that assertion are being silenced.
Yet if recent global warming is largely a result of natural climate variability, policies to reduce global warming would be unnecessary, costly and ineffective. Before we are asked to incur the pain, we should better understand whether there would be any gain.
From The Washington Times, August 26, 2003.
==============================
Global Warming Debate Heats Up Capitol Hill (031119)
A global-warming brouhaha has critics of a landmark climate report saying the 20th century was not as hot as it was cracked up to be.
Climate scientists, who have long been raising red flags on the impact modern man is having on Earth’s climate, are calling the critics half-baked.
The debate — the subject of a briefing Tuesday on Capitol Hill — highlights the opposing arguments in the global-warming controversy.
On one side are researchers concerned about temperature-raising pollutants. On the other are those concerned that this is an over blown argument that will stall economic progress.
At issue is a 1998 study in the journal Nature that described the 20th century as the hottest in centuries. Similar warnings from an influential United Nations science panel echoed that report.
Climate research has been an increasingly politicized issue since 2001, when President Bush rejected a multination plan crafted in Kyoto, Japan, to combat global warming. Bush cited the costs of capping emissions of greenhouse gases produced by burning fossil fuels such as coal and petroleum.
In a paper published last month in Energy & Environment, a social science journal known for reports critical of climate-change research, Canadian businessman Stephen McIntyre and economist Ross McKitrick of Canada’s University of Guelph charge that the Nature report contains numerous errors regarding temperatures from the past six centuries.
When corrected, the data suggest the 15th century was actually warmer than today, they say.
They also criticize the U.N. panel for relying on the Nature study in its warnings about global warming. In 2001, the U.N.’s Intergovernmental Panel on Climate Change said the average surface temperature rose 1 degree during the 20th century and could rise 2.6 to 10.4 degrees this century, partly driven by industrial activities that emit greenhouse gases. (Related document: The IPCC 2001 report on climate science)
“Unfortunately, a lot was made of the Nature paper, so ordinary debate about its technical soundness takes on inordinate political overtones,” says McKitrick.
The George C. Marshall Institute, one of a number of think tanks that question the human role in global warming, sponsored a briefing Tuesday for congressional staffers and others on the rebuttal report.
The authors of the Nature paper, led by climatologist Michael Mann of the University of Virginia, respond that the critics botched their analysis, selectively dropping records to invent a warm 15th century and making numerous other statistical mistakes.
Climate researcher Tom Wigley of the National Center for Atmospheric Research. in Boulder, Colo., calls the critics’ complaints “seriously flawed” and “silly.”
In addition to the Nature paper, about a dozen independent studies suggest the 20th century was warmer than normal, Wigley points out.
From a statistical viewpoint, “I lean in favor of Mann,” says statistician George Shambaugh. of Georgetown University. “There is an increase in the 20th century that is greater than the cyclical patterns found by either group since 1550. And since the early 1900s, we have been hotter than any time since then.”
Princeton geoscientist Michael Oppenheimer compares climate skeptics to tobacco industry scientists who sought for decades to obscure the link between smoking and lung cancer. Arguing over whether man-made global warming exists obscures a more important debate over what steps are possible to moderate its effects, he says.
But skeptics are providing a valuable public service in keeping the debate alive, says William O’Keefe of the Marshall Institute. O’Keefe, formerly with the American Petroleum Institute, says: “We have to encourage healthy debate.”
USA TODAY, Dan Vergano, Nov. 18, 2003
==============================
Climate debate isn’t about action, it’s about knowledge (040106)
by William O’Keefe
Astrophysicists Sallie Baliunas and Willie Soon of the Harvard Smithsonian Center conducted a review of more than 200 past studies on climate change, including 102 with information about whether the 20th century was the warmest.
Their results: Only three
studies found it was. Sixteen were equivocal, 79 and four showed that the
warmest conditions were in the first half of the 20th century, before
significant human contributions to greenhouse gases occurred.
This is just one example of scientific uncertainty. There are many others demonstrating that the science of climate change is far from settled. Neither I nor anyone else knows whether over the course of this century the climate will be a scientific curiosity or a serious ecological threat. If it becomes a serious threat, today’s so-called renewable energy sources may not be the best solutions.
Low- or no-carbon energy sources are decades -- not years -- away from being affordable, efficient and reliable substitutes for current fossil fuels, which provide 85 percent of our energy needs.
The potential of a renewable-based economy may seem boundless, but it has real practical limits. An article in the prestigious journal Science evaluated the currently available technologies and concluded that replacing fossil fuels was likely to be the technology challenge of the century.
What’s needed? A planning process that ties action to knowledge, invests in new knowledge and adjusts actions as we learn. New knowledge is needed to better understand the true nature of the climate risk and to identify and develop the most promising technologies for addressing it.
The Bush administration and private industry already seem engaged in just such activity. The president’s 2004 budget contains $4.4 billion for science, research and incentives for new energy technologies, including fuel cells and carbon sequestration. As Klaus S. Lackner of Columbia University has said, capturing carbon dioxide might prove more economically viable than attempting to replace its creation through solar or other renewable energy projects.
Finally, major corporations have put $250 million into Stanford University’s Global Climate and Energy Project in hopes of pinpointing truly promising energy technologies that will lower greenhouse gas emissions.
The current climate change debate isn’t about action or inaction. It is about whether proposed actions are consistent with our state of knowledge and other important societal priorities. Our nation should not be frightened into adopting unknown and unproven technologies until they can contribute to healthy economic growth and until we better understand the impact of human activities on our climate system.
The Atlanta Journal-Constitution, January 6, 2004
==============================
Cold Facts on Global Warming (040122)
by James Schlesinger
We live in an age where facts and logic have a hard time competing with rhetoric — especially when the rhetoric is political alarmism over global warming.
We continue to hear that “the science is settled” in the global warming debate, that we know enough to take significant action to counter it. Those who hold this view believe emissions of carbon dioxide are the primary cause of any change in global temperature and inevitably will lead to serious environmental harm in the decades ahead.
In 1997, for instance, Vice President Al Gore played a leading role in the negotiation of the Kyoto Protocol, the international agreement to deal with the fears about global warming. He was willing to embrace severe reductions in U.S. emissions, even though the Clinton administration’s own Department of Energy estimated that Kyoto-like restrictions could cost $300 billion annually. Then, when it became clear that the Senate would not agree to a treaty that would harm the economy and exempt developing countries like China and India, the Clinton administration did not forward it for ratification. Since then, the treaty’s flaws have become more evident, and too few countries have ratified it to allow it to “enter into force.”
The Bush administration, as an alternative to such energy-suppressing measures, has focused on filling gaps in our state of knowledge, promoting the development of new technology, encouraging voluntary programs and working with other nations on controlling the growth of greenhouse gas emissions. Collectively, these actions involve spending more than $4 billion annually, and the U.S. is doing more than any other nation to address the climate-change issue.
Of these efforts, filling the
gaps in our knowledge may be the most important. What we know for sure is quite
limited. For example, we know that since the early 1900s, the Earth’s surface
temperature has risen about 1 degree Fahrenheit. We also know that carbon
dioxide, a greenhouse gas, has been increasing in the atmosphere. And we know
that the theory that increasing concentrations of greenhouse gases like carbon
dioxide will lead to further warming is at least an oversimplification. It is
inconsistent with the fact that satellite measurements over 35 years show no
significant warming in the lower atmosphere, which is an essential part of the
global-warming theory.
Much of the warming in the 20th
century happened from 1900 to 1940. That warming was followed by atmospheric
cooling from 1940 to around 1975. During that period, frost damaged crops in
the Midwest during summer months, and glaciers in Europe advanced. This
happened despite the rise in greenhouse gases. These facts, too, are not in
dispute.
And that’s just our recent past.
Taking a longer view of climate history deepens our perspective. For example,
during what’s known as the Climatic Optimum of the early Middle Ages, the
Earth’s temperatures were 1 to 2 degrees warmer than they are today. That
period was succeeded by the Little Ice Age, which lasted until the early 19th
century. Neither of these climate periods had anything to do with man-made greenhouse
gases.
The lessons of our recent history and of this longer history are clear: It is not possible to know now how much of the warming over the last 100 or so years was caused by human activities and how much was because of natural forces. Acknowledging that we know too little about a system as complicated as the planet’s climate is not a sign of neglect by policymakers or the scientific community. Indeed, admitting that there is much we do not know is the first step to greater understanding.
Meanwhile, it is important that we not be unduly influenced by political rhetoric and scare tactics. Wise policy involves a continued emphasis on science, technology, engagement of the business community on voluntary programs and balancing actions with knowledge and economic priorities. As a nation, by focusing on these priorities, we show leadership and concern about the well-being of this generation and the ones to follow.
Los Angeles Times, January 22, 2004
==============================
GRAPHS
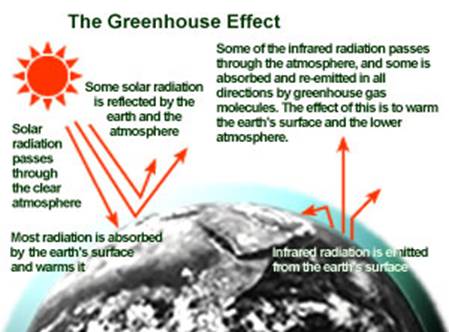
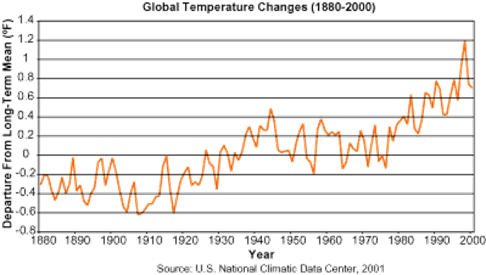
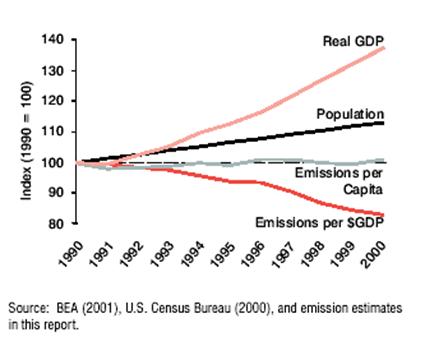
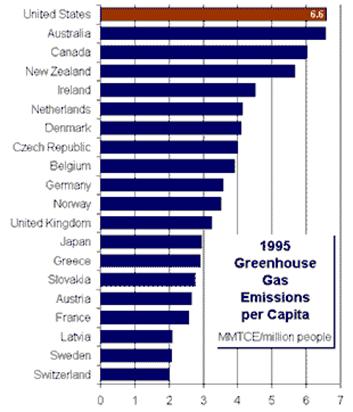
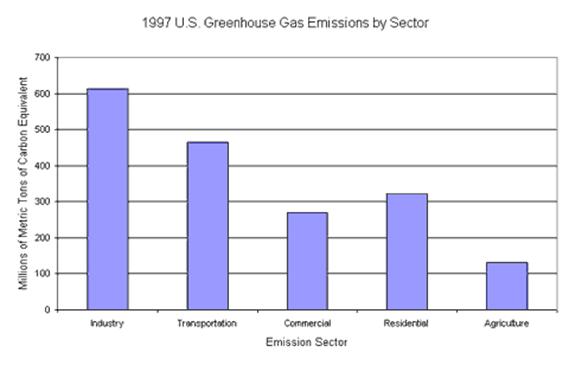
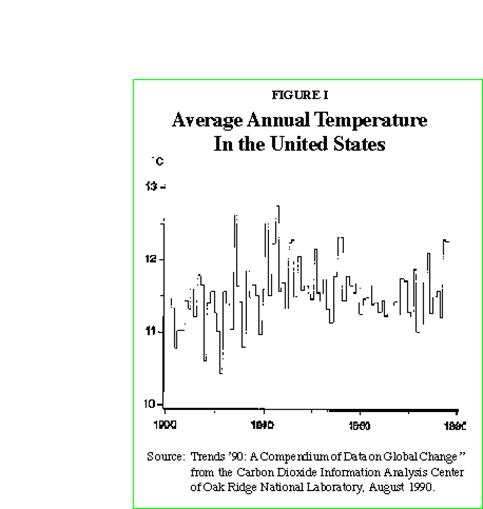
==============================
GRAPHS IN MCINTYRE’S ARTICLE
Mann’s graph
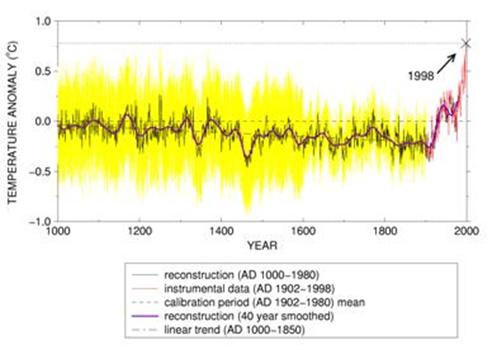
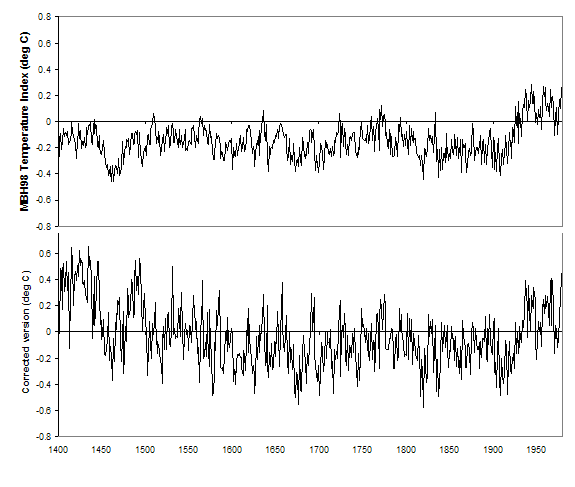
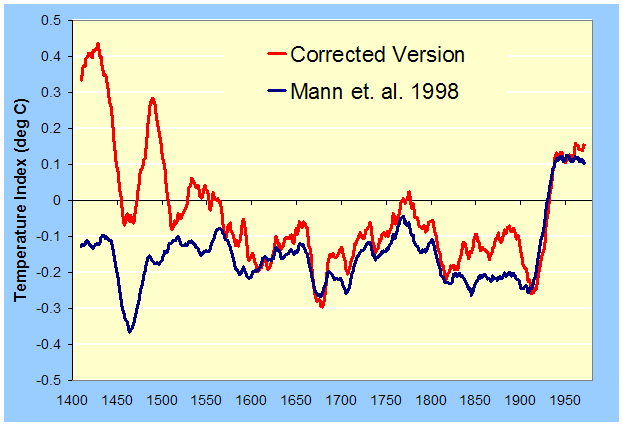
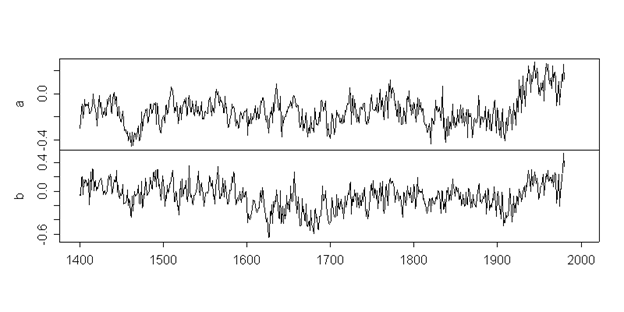
==============================