Report: Media Bias
PEW Report
I.
Where Americans Go for News
II.
The Changing Online News Audience
III.
International News Audience Broader, Not Deeper
==============================
http://people-press.org/reports/display.php3?ReportID=215
The Pew Research Center for
the People and the Press
News Audiences Increasingly
Politicized
Online News Audience Larger,
More Diverse
Released:
==============================
Overview
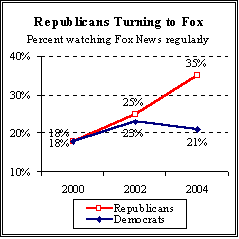
Despite tumultuous events abroad, the public’s news habits have been relatively stable over the past two years. Yet modest growth has continued in two important areas online news and cable news. Regarding the latter, the expanding audience for the Fox News Channel stands out. Since 2000, the number of Americans who regularly watch Fox News has increased by nearly half from 17% to 25% while audiences for other cable outlets have been flat at best.
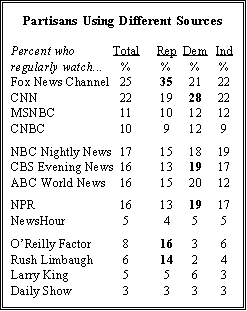
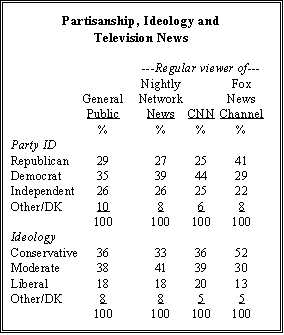
Fox’s vitality comes as a consequence of another significant change in the media landscape. Political polarization is increasingly reflected in the public’s news viewing habits. Since 2000, the Fox News Channel’s gains have been greatest among political conservatives and Republicans. More than half of regular Fox viewers describe themselves as politically conservative (52%), up from 40% four years ago. At the same time, CNN, Fox’s principal rival, has a more Democrat-leaning audience than in the past.
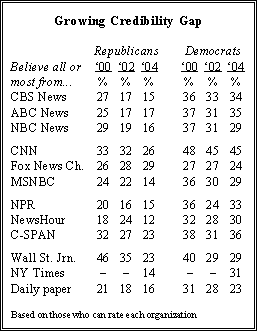
The public’s evaluations of media credibility also are more divided along ideological and partisan lines. Republicans have become more distrustful of virtually all major media outlets over the past four years, while Democratic evaluations of the news media have been mostly unchanged. As a result, only about half as many Republicans as Democrats rate a variety of well-known news outlets as credible a list that includes ABC News, CBS News, NBC News, NPR, PBS’s NewsHour with Jim Lehrer, the New York Times, Newsweek, Time and U.S. News and World Report.
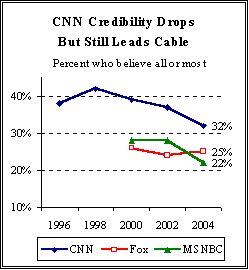
CNN’s once dominant credibility ratings have slumped in recent years, mostly among Republicans and independents. By comparison, the Fox News Channel’s believability ratings have remained steady both overall and within partisan groups. Nonetheless, among those able to rate the networks, more continue to say they can believe all or most of what they hear on CNN than say that about Fox News Channel (32% vs. 25%).
The partisan nature of these ratings is underscored by the fact that, while roughly the same proportion of Republicans and Democrats view Fox News as credible, Fox ranks as the most trusted news source among Republicans but is among the least trusted by Democrats.
The biennial news consumption survey by the Pew Research
Center for the People and the Press finds that ideology and partisanship also
are at work in other media choices and attitudes. The nationwide poll of 3,000 adults,
conducted April 19-
The signs of greater polarization in news choices come against a backdrop of overall stability in the public’s preferences. Local TV news continues to be the most popular medium, but regular viewership is still below levels recorded in the mid-1990s. Similarly, reported levels of regular newspaper reading and viewing of network evening news broadcasts have not recovered from their decade-long slump, though they have not declined further.
The traditional news outlets have failed to expand their audiences despite the high level of interest in the war in Iraq, which has led to an uptick in the amount of time Americans spend on the news. Moreover, there has been a sharp rise in the percentage of Americans who say they closely follow international news most of the time, rather than just when important developments occur. The number tracking overseas news closely most of the time has increased from 37% in 2002 to 52%, which appears to be driven by the broad interest in the conflict in Iraq.
With most other media trends flat, the steady growth in the audience for online news stands out. Internet news, once largely the province of young, white males, now attracts a growing number of minorities. The percentage of African Americans who regularly go online for news has grown by about half over the past four years (16% to 25%). More generally, the Internet population has broadened to include more older Americans. Nearly two-thirds of Americans in their 50s and early 60s (64%) say they go online, up from 45% in 2000.
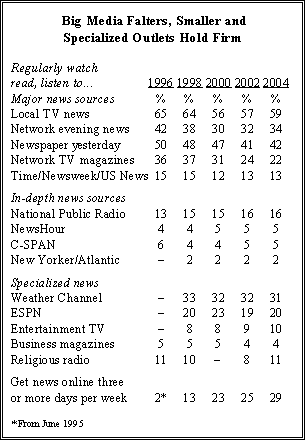
The survey finds that many Americans especially older people look for in-depth news coverage. Moreover, a majority of college graduates (55%) say they better understand the news when they read or hear it rather than seeing pictures or video. The durability of the serious news consumer is reflected in the steady numbers of Americans who are regular consumers of news from NPR, the NewsHour, C-SPAN, and magazines such as the New Yorker, the Atlantic and Harper’s.
For the most part, these audiences have not increased in size in recent years, but they have not suffered the long-term declines experienced by newspapers and network evening news. In addition, more specialized news outlets ranging from the Weather Channel to religious radio also have held their own in the changing news environment.
Other findings:
Beyond politics, news habits are being subtly shaped by some basic preferences and attitudes toward the news. About half (52%) like to get the news at regular times while nearly as many (46%) are “news grazers,” who check in on the news from time to time. Grazers are younger, less dedicated to the news, and have an eclectic news diet.
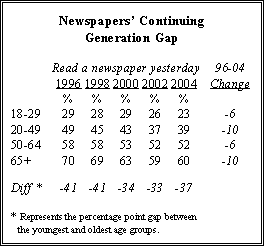
The age gap in newspaper readership continues to widen. Six-in-ten Americans age 65 and older say they read a newspaper on a typical day, compared with just 23% of those under age 30.
Roughly three-quarters of Americans (76%) say they have a digital video disc (DVD) player, more than quadruple the percentage in the 2000 media survey (16%). But video cassette recorders have not faded into oblivion 92% of the public has a VCR.
The public continues to express skepticism toward news outlets and those who run them. More than half (53%) agree with the statement “I often don’t trust what news organizations are saying.” Nearly as many (48%) believe people who decide on news content are “out of touch.”
Regular readers of literary magazines like the New Yorker and the Atlantic proved to be the most knowledgeable 59% correctly answered four current events questions, a higher percentage than any other news audience. The readership of these magazines also has the greatest proportion of college graduates. Readers of political magazines such as the Weekly Standard and The New Republic rank second, along with the audience for Larry King Live. King’s audience is not as well-educated as the readership of literary or political magazines, but is considerably older.
==============================
I. Where Americans Go for News
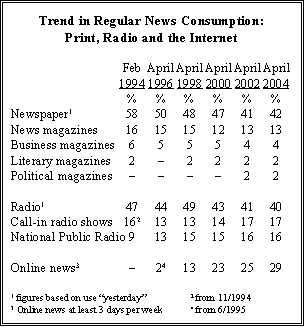
Americans’ news habits have changed little over the past two years. Network and local TV news viewership has been largely stable since 2002. Daily newspaper readership remains at 42% (it was 41% two years ago). And the percentage of Americans who listen to news on the radio on a typical day is virtually unchanged since the last Pew Research Center media consumption survey (40% now, 41% in 2002).
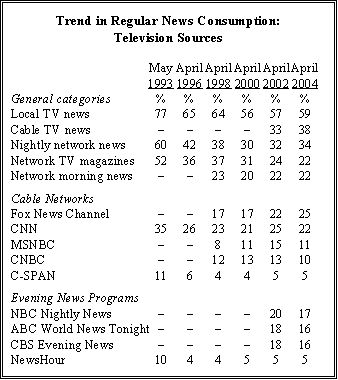
There are, however, a couple of notable exceptions to this pattern of stability. The percentage of Americans who regularly turn to cable news channels has edged up over the past two years. The overall audience for cable TV news exceeds that for network television news by a narrow margin: 38% of Americans say they regularly watch cable news channels, compared with 34% who regularly watch the nightly news on one of the three major broadcast networks. In April 2002, the two audiences were nearly identical in size 33% for cable news, 32% for network news. So while the nearly decade-long slide in network news viewership may have subsided, the networks now risk being eclipsed by their cable competitors.
The other notable change is a rise in online news consumption. About three-in-ten (29%) Americans now report that they regularly go online to get news, up from 25% in 2002 and 23% in 2000. In addition, surveys by the Pew Internet and American Life Project have found the percentage who go online for news on a typical day has increased by half over the past four years (from 12% to 18%). A more inclusive question on this survey found 24% saying they went online for news on the previous day.
Network News Audience Still Aging
Overall, local television news continues to dominate the American media landscape. Fully 59% of Americans say they regularly watch the local news in their area. This is down significantly from the more than three-quarters of American who regularly watched local news in the early 1990s, but is largely unchanged from 2000.
Roughly a third of the public (34%) now regularly watches one of the nightly network news broadcasts on CBS, ABC or NBC. The total audience for these broadcasts shrunk by about half between 1993 and 2000, but has remained fairly steady since then.
Nearly equal proportions of Americans report watching the individual nightly network news programs: 16% regularly watch the CBS Evening News with Dan Rather; 16% watch ABC’s World News Tonight with Peter Jennings; and 17% watch the NBC Nightly News with Tom Brokaw. Five percent of Americans regularly tune into the NewsHour on PBS.
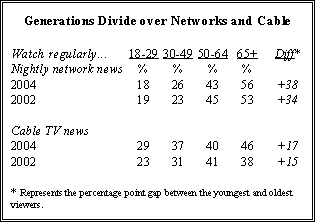
As has been the case for some time, network news viewers are an aging group. A majority (56%) of those age 65 and older say they regularly watch nightly network news; less than a third as many Americans under age 30 (18%) regularly watch these news programs. And it is not just the youngest viewers who are tuning out the network news. Only about a quarter of those age 30-49 (26%) are regular viewers. The generation gap for network news viewership, already substantial, has become slightly wider over the past two years.
Cable Audience: Younger, More Republican
Cable news appears to be gaining ground on the networks. The increase in viewership of cable news channels since 2002 has been broad-based. While the cable news audience is slightly older than average, age differences in cable viewership are not nearly as large as for network news. Furthermore, cable news has made modest gains among 18-29 year-old viewers over the past two years. Today nearly three-in-ten young people regularly tune into a cable news channel, compared with 23% in 2002.
The cable news audience is slightly more affluent and well-educated than the network news audience. It also is more Republican: 46% of Republicans regularly watch cable news compared with 31% who watch network news.
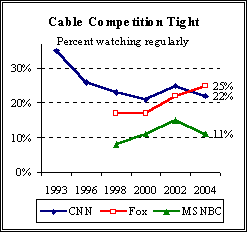
CNN has been the dominant cable news channel since its inception in 1980. But since 2002 the Fox News Channel has pulled into a statistical heat as its audience has continued to grow. The Fox News Channel is viewed regularly by 25% of the public, up marginally from 22% in 2002 and 17% in 1998 and 2000. By comparison, 22% of Americans regularly watch CNN today, and there is no upward trend in the size of its audience. Roughly one-in-ten Americans watch MSNBC regularly (down from a peak of 15% in 2002), 10% regularly watch CNBC (down from 13% in 2002), and 5% watch C-SPAN.
Young People Shun Newspapers
The decade-long slide in newspaper readership has leveled off. The percentage of Americans reporting that they read a newspaper “yesterday” fell from 58% in 1994 to 47% in 2000, and 41% in 2002. It now stands at 42%.
Newspaper readership among young people continues to be relatively limited. Among those under age 30, just 23% report having read a newspaper yesterday. This is down slightly from 26% in 2002 and stands in marked contrast to the 60% of older Americans who say they read a newspaper yesterday. Young people are more apt to read a magazine or a book for pleasure on a daily basis than they are to pick up a newspaper.
Readership of news magazines, business magazines, literary magazines, and political magazines is unchanged from 2002: 13% of Americans regularly read news magazines such as Time, U.S. News or Newsweek; 4% read business magazines such as Fortune and Forbes; 2% read literary magazines such as the Atlantic, Harper’s or the New Yorker; and 2% read political magazines such as the Weekly Standard or the New Republic.
Stable Radio News Audiences
The percentage of Americans who listen to radio news has remained relatively stable in recent years. Four-in-ten say they listened to news on the radio yesterday. This is virtually unchanged from 2002 (41%) and down only marginally from 2000 (43%).
Talk radio is holding onto its corner of the media market 17% of the public regularly listens to radio shows that invite listeners to call in to discuss current events, public issues and politics. The talk radio audience remains a distinct group; it is mostly male, middle-aged, well-educated and conservative. Among those who regularly listen to talk radio, 41% are Republican and 28% are Democrats. Furthermore, 45% describe themselves as conservatives, compared with 18% who say they are liberal.
National Public Radio’s audience is holding steady as well: 16% of Americans regularly listen to NPR. In contrast to the talk radio audience, the NPR audience is fairly young, well-educated and Democratic. Fully 41% of regular NPR listeners are Democrats, 24% are Republicans.
More Go Online for News
One of the few upward trends in media consumption in recent years has been the percentage of Americans who turn to Internet sources for news. As the public has moved away from traditional news sources local and network television news, newspapers and, to a lesser extent, radio online news consumption has increased dramatically. In 1995, just 2% of the public was going online at least three days a week to get news. That number had increased more than sixfold (to 13%) by 1998 and nearly doubled again (to 23%) by 2000. The growth has been slower since then, but still trending upward (currently at 29%).
The online news audience is young, affluent and well-educated. More men than women go online to get news, but the gender gap has narrowed in recent years. The increase in online news use since 2002 has been particularly sharp among racial and ethnic minority groups. In 2002, 15% of African Americans went online regularly for news. Today that figure has risen to 25%. Among Hispanics, 32% now go online regularly for news, up from 22% in 2002.
Where They Go: AOL, Yahoo, Network Sites
When going online for news, Americans for the most part rely on familiar names: 13% say they regularly visit the news pages of AOL, Yahoo or other Internet service providers; 10% say they go to the websites of the major broadcast and cable news networks; and 9% go to the website of their local paper. Fewer people say they go to the sites of national newspapers (6%), while 3% go to online magazines like Slate.com or National Review online.
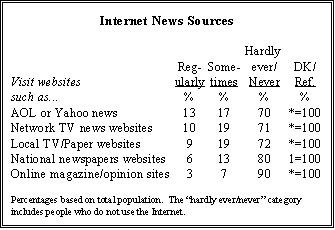
To put these numbers in perspective, as many people now say they regularly log on to the news pages of one of the major Internet providers as regularly read news magazines like Time or Newsweek (13%), or watch the Sunday morning talk shows (12%). And many more people say they regularly go to these sites than watch such well-known cable programs as the O’Reilly Factor (8% regularly) or Larry King Live (5%).
Moreover, as many as 26% of Americans say they regularly visit one or more of these online sites the news pages of the Internet service providers, network or local TV news websites, newspaper sites or online magazines. That approaches the 36% who regularly watch one or more of the network TV news broadcasts, though it lags well behind the overall audience for cable news programs (44%).
Like the online news audience generally, the people who visit specific Internet news sites tend to be young and well-educated. One-in-five college graduates (21%) say they regularly visit the news pages of AOL, Yahoo and other services providers, while 17% regularly go to the network TV websites. By comparison, just 7% of those with no more than a high school education visit the news pages of AOL, Yahoo and similar services and the same number visits the network TV sites.
Round-the-Clock News
In spite of shifting public preferences, the news remains a central part of Americans’ lives. Most people consume news morning, noon and night. Fully 71% say that, on a typical weekday, they start their morning with some type of news. This has been a consistent pattern, as 68% of Americans said the same in 2002 and 67% did so in 2000. The morning news habit is prevalent across most major demographic groups. Young people are among the least likely to start their day with news, yet 60% say that they typically do. College graduates are among the most likely to do so (79%). Internet users seek out news in the morning at a higher rate than non-Internet users.
Nearly three-quarters of Americans (73%) follow news during the course of the day. This is up significantly from 61% two years ago. For the most part, the increase in daytime news consumption can be seen across the board. Young people are less inclined than their older counterparts to seek out news during the day. And college graduates and Internet news users are among the biggest daytime news consumers.
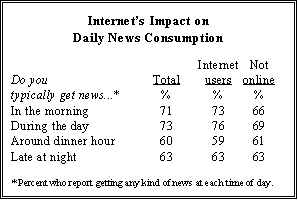
Six-in-ten Americans say they typically read, watch or listen to the news around the dinner hour. This percentage has increased somewhat from 55% in 2002. More women than men get the news at this time of day. Younger people lag behind again, but the educational and online differences in morning and daytime news consumption are not evident at the dinner hour.
Overall, 63% of Americans say they read, watch or listen to the news late in the evening. Getting the news at that time has broad appeal. Looking across the demographic spectrum at men and women, young and old, the college-educated and those with less than a high school diploma, no single group dominates the late news audience.
During these late night hours, many young people are tuning into comedy shows such as David Letterman and Jay Leno. Those under age 30 are among the most likely to watch these types of shows 17% watch Leno or Letterman regularly, compared with 8% of 30-49 year-olds and 12% of those age 50 and older.
Time Spent with the News
The amount of time Americans spend with the news has fluctuated only marginally in recent years. On average, Americans spend a little over an hour each day (66 minutes) watching, reading or listening to the news. This is up somewhat from 59 minutes in 2002 but still lower than the 73 minutes recorded a decade ago. More time is spent watching television news than reading a newspaper or listening to the radio. Americans spend an average of 32 minutes watching television news on any given day. This is up modestly from 28 minutes in 2002, but down from a high of 38 minutes in 1994. Six-in-ten say they watched TV news the previous day, and 31% watched for an hour or more.
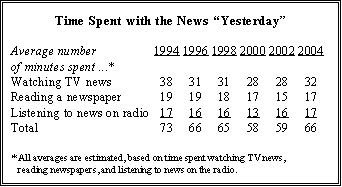
Americans spend far less time reading a newspaper or listening to news on the radio each day 17 minutes for each. These figures have remained remarkably stable over the last 10 years. The average amount of time spent reading the news online is seven minutes.
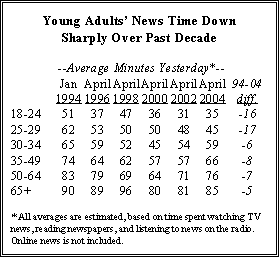
The decrease in time spent with the news from 1994-2004 has been driven almost entirely by the changing behavior of young people. In 1994, 18-24 year-olds were spending on average 51 minutes a day watching TV news, reading newspapers or listening to news on the radio. Those age 65 and older were spending an average of 90 minutes with the news a gap of 39 minutes. Today, 18-24 year-olds spend 35 minutes a day with the news. While that represents a modest increase from 2002 (from 31 minutes), those age 65 and older spend around 85 minutes with the news on TV, radio and in newspapers. By this measure, the gap between the oldest and youngest Americans stands at 50 minutes.
When it comes to watching other television programming, reading magazines and reading books for pleasure, young people are on equal footing with their older counterparts. The gap comes on news-related media, which does not seem to engage young consumers.
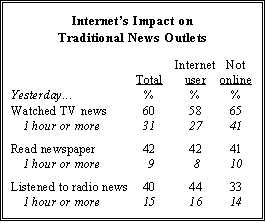
The overall decrease in time spent with the news over the last 10 years has coincided with the increase in Internet news consumption. Just 15% of those who go online weekly for news say they are using other sources of news less, but there is clearly a link between Internet use and consumption of traditional media, especially television news viewing. Among online users, 58% report having watched TV news the previous day, but just 27% say they spent an hour or more doing so. By contrast, among non-online users, 65% watched TV news yesterday, with 41% watching for an hour or more.
Internet usage is not linked to newspaper readership in the same way. Nearly equal percentages of Internet users and non-Internet users (42% and 41%, respectively) report having read a newspaper yesterday. And there are no significant differences in the time each group spent reading the paper. But unlike TV news, Internet users are more likely than those not online to listen to news on the radio: 44% tuned into radio news yesterday, compared to 33% of those who don’t go online.
The Media and Daily Life
Relative to life’s other daily chores and activities, news consumption takes up a significant amount of time. On a typical day, Americans are about as likely to watch TV news as they are to turn on the TV for entertainment programming. And the proportion who make personal telephone calls, have family meals together, and pray on a typical day is only slightly higher.
The Internet has also become a part of daily life for many Americans, and it is more than just something people do at work. Nearly as many go online from home on a typical day as read a newspaper or listen to news on the radio. Using the Internet at home is about as common as exercising or reading books. Other activities that compete for Americans’ time these days include shopping, emailing friends and family, reading magazines, and watching movies at home.
Politicization of Cable News
In an era of deep-seated political divisions, conservatives and liberals are increasingly choosing sides in their TV news preferences. The cable news audience is more Republican and more strongly conservative than the public at large or the network news audience. Among regular cable news viewers, 43% describe their political views as conservative, compared with 33% of regular network news viewers; 37% of cable viewers are moderate, compared to 41% of network viewers; and 14% are liberal vs. 18% of network viewers.
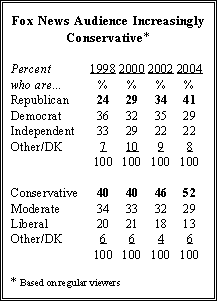
Looking at specific cable networks, the contrasts are even sharper. As the regular audience for the Fox News Channel has grown over the past six years, it has become much more conservative and more Republican. In 1998, the Fox News audience mirrored the public in terms of both partisanship and ideology. If anything, Fox viewers were slightly more Democratic than the general public. Since then, the percentage of Fox News Channel viewers who identify as Republicans has increased steadily from 24% in 1998, to 29% in 2000, 34% in 2002, and 41% in 2004. Over the same time period, the percentage of Fox viewers who describe themselves as conservative has increased from 40% to 52%.
By contrast, the regular audience for CNN is somewhat more Democratic than the general public and almost identical to the public in terms of ideology. The regular nightly network news audience largely mirrors the general public in terms of partisanship and ideology.
Radio is another news source where ideological beliefs come into play. Republicans and conservatives are more likely than Democrats and liberals to listen to news on the radio. Nearly half of those who identify themselves as Republicans (48%) report listening to the radio yesterday. This compares with 38% of Democrats. And 45% of conservatives say they tuned into radio news yesterday, compared to 38% of liberals. The differences are much sharper for talk radio specifically. Fully 24% of Republicans regularly listen to radio shows that invite listeners to call in to discuss current events, public issues and politics. Only about half as many Democrats (13%) regularly listen to these types of shows. Similarly, 21% of conservatives listen to talk radio compared with 16% of liberals. The partisan gap in the talk radio audience has grown in recent years. In 2002, more Republicans than Democrats listened to talk radio programs regularly (21% vs. 16%, respectively). Today Republican attention has increased to 24%, while Democratic interest has dropped to 13%.
O’Reilly Audience More Conservative
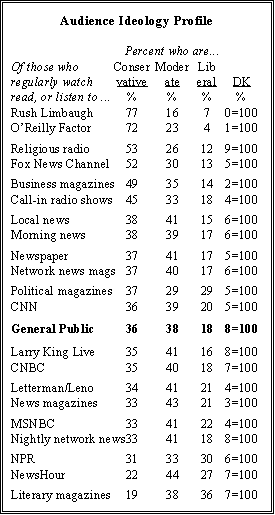
Rush Limbaugh’s radio show attracts a disproportionately conservative audience: 77% of Limbaugh’s regular listeners describe themselves as conservative. This is up from 72% in 2002 and compares with 36% of the general public who describe themselves in these terms. On television, the O’Reilly Factor draws a similar audience: 72% of O’Reilly’s regular viewers are self-described conservatives. The O’Reilly audience has become much more ideological in recent years. In 2002 far fewer regular O’Reilly viewers (56%) described themselves as conservative and more were moderate (36% vs. 23% now).
National Public Radio’s audience has shown the most significant shift to the left. Today, three-in-ten regular NPR listeners describe themselves as liberal up from 20% in 2002. Still, just as many describe themselves as conservative (31%) or moderate (33%). The only news outlets with a more liberal following are literary magazines such as The Atlantic Monthly, Harpers and The New Yorker.
Regular newspaper readers are not highly ideological. A plurality describes themselves as moderates, and the number of liberals and conservatives mirrors those in the general public. Similarly, weekly news magazines like Time and Newsweek appeal to readers across the ideological spectrum. Business magazines, on the other hand, attract a more conservative audience. Political magazines like the Weekly Standard and the New Republic are more widely read by conservatives and liberals, and are less popular among political moderates.
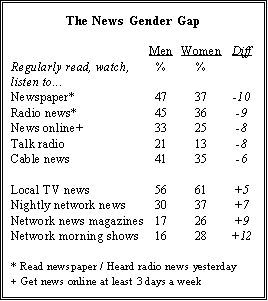
More Women Watch Network News
While conservatives and liberals seek out different news sources, men and women also have their own distinct preferences. Men are more oriented toward newspapers, radio news, cable television news, and online news. Women are more loyal to the major TV networks, as they are far more likely than men to watch network morning shows like the Today Show and the networks’ news magazines, such as 60 Minutes and Dateline. In addition, a higher percentage of women than men now watch a nightly network newscast on CBS, ABC or NBC. There was no gender gap on network news viewership in 2002 and only a slight gap in 2000.
Needing News for Work
Many Americans do not just keep up with the news because they enjoy it or out of a sense of civic responsibility, but because they need to for their job. Roughly a third of working people (32%) say that it is important for their job to keep up with the news.
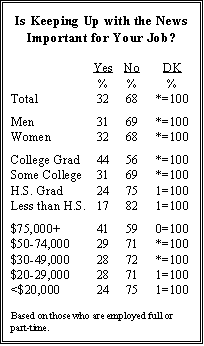
Fully 44% of working college graduates say keeping up with the news is important for their jobs, compared with just 24% of working high school graduates and 17% of those who have not completed high school.
Similarly, people with high incomes also more often say they follow the news because it is important for their work. Among workers with household incomes over $75,000 annually, 41% say keeping up with the news is important. Fewer than three-in-ten in any lower income category say the same about their jobs.
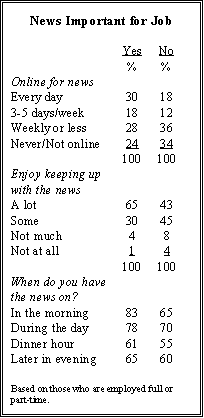
People who need news for their jobs are far more likely to go online for news, and are heavier consumers of news at virtually all times of day not just at work. Nearly half (48%) go online for news at least three days a week, and three-in-ten are online for news every day. Getting news in the morning is particularly important for those with jobs that require them to stay current. Fully 83% typically get news in the morning, and 78% say they get news during the day as well.
Yet those who need to keep up with the news for work do not consider this a chore. About two-thirds (65%) say they enjoy keeping up with the news a lot, compared with 43% of those whose jobs do not require them to follow the news.
==============================
II. The Changing Online News Audience
The nation's online population has grown steadily over the past four years, as has the percentage of the public that regularly gets news from the Internet. Two-thirds of Americans (66%) say they go online to access the Internet or to send and receive email, up from 54% in 2000. During the same period, the number of people who go online for news at least three days a week has grown from 23% in 2000 to 29% today.
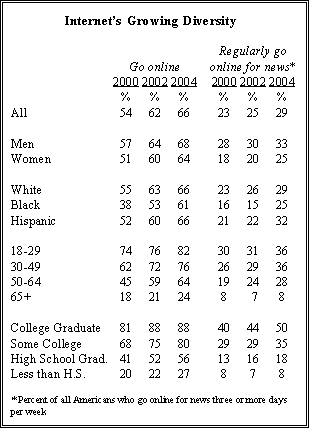
As in previous surveys, Americans who go online tend to be young and well-educated. Yet there also are signs that the online population is becoming more diverse. Racial disparities in Internet use have narrowed considerably over the past four years. In 2000, 55% of whites went online compared with just 38% of African Americans. Two years later, the gap narrowed to 10 points, and stands at just five points today: 66% of whites and 61% of blacks say they go online.
Yet sizable age and education differences in Internet use persist. Increasing numbers of young and even middle-aged Americans are going online a solid majority (64%) of Americans age 50-64 now are logging onto the Internet, up from 45% four years ago. But senior citizens have been slower to adapt; only about quarter (24%) go online, up modestly from 2000 (18%).
And while many more high school graduates are going on the Internet than did so four years ago, growth has been much slower among those who have not completed high school. Just 27% of this group goes online, compared with 20% in 2000. Roughly twice as many high school graduates as those without high school diplomas go online (56% vs. 27%), and Internet use is even higher among those who have attended some college (80%) or who are college graduates (88%).
Minorities Log On For News
As the overall base of Internet users has broadened, so has the population that regularly uses the Internet as a source of news. Over the past two years, especially, racial and ethnic differences in online news consumption have lessened. Two years ago, 26% of whites and 15% of African Americans went online for news at least three days a week; today, the gap is just four percentage points (29% white/25% black).
Nearly a third of Hispanics (32%) go online for news at least three days a week, which is a slightly higher percentage than Americans generally (29%). This represents a ten-point increase from 22% two years ago.
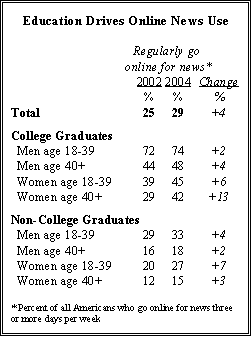
Yet education continues to be the biggest single factor driving online news use, largely due to the continuing gap in Internet access. Fully half of college graduates regularly use the web for news, compared with just 18% of high school graduates and 8% of those who didn't finish high school. When education and age are analyzed together, striking patterns emerge; about three-quarters of male college graduates under age 40 (74%) regularly go online for news, compared with just 45% of female college graduates in the same age category. That dwarfs the overall eight-point gender gap in regular Internet news use (33% vs. 25%).
In addition, many more younger male college graduates (those 18-39) than those age 40 and older regularly go online for news (74% vs. 48%). There is no such age difference among women college graduates because of a rapid growth in online news use among female college graduates age 40 and older 42% regularly log on for news, compared with 29% two years ago.
There has been little growth in Internet news use among the people with less than a college degree, regardless of age or gender. Among the younger age group (18-39), similar percentages of non-college men (33%) and women (27%) go online for news at least three days a week. Both men and women over age 40 without a degree are the least likely to go online for news with any regularity (18% men, 15% women). These numbers have increased only slightly in the past two years.
Online News and Daily Life
Despite the growth of the Internet news audience, going online for the news has yet to become part of the daily routine for most Americans, in the same way as watching TV news, reading the newspaper or listening to radio news.
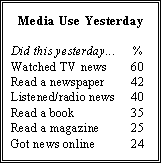
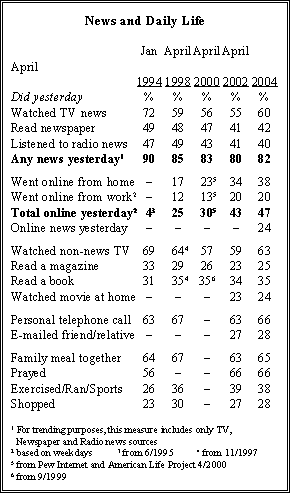
Asked about their news use on a typical day ("yesterday"), just under a quarter of Americans (24%) say they went online for the news. That compares with 60% who watched TV news on the previous day; 42% who say they read a newspaper; and 40% who listened to news on the radio. About the same number of people say the read a magazine the previous day (25%) as went online for news.
In addition, people spend far less time in getting the news online on a typical day than they do getting news from traditional sources. About half of Americans (51%) say they spent at least a half-hour watching TV news the previous day; roughly a quarter say they spent at least a half-hour reading the newspaper (26%) and listening to radio news (25%). Just 7% say they spent that much time getting the news online.
In part, these differences reflect the unique role the Internet plays in daily life. While television and radio are sources of entertainment as well as news, the Internet also serves as a means of communication, a research tool and a virtual shopping center. Nearly as many Americans watched a news program on TV yesterday (60%) as watched any other kinds of non-news programming (63%). But when it comes to the Internet, fully 47% say they went online the previous day, but only half as many (24%) got news when they were there. More people say they emailed a friend or relative the previous day (28%) than went online for news.
Inadvertent News Consumers
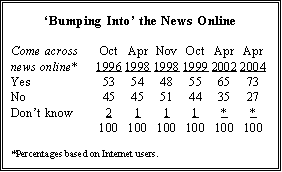
It has become increasingly common for Internet users to come across news inadvertently while online for other purposes. Fully 73% of Internet users come across the news this way, up from 65% two years ago, and 55% as recently as 1999.
More than eight-in-ten Internet users under age 30 (82%) say they inadvertently come across news online, but this practice also is common among older people who go online. The only age group where it is not widespread is among the relatively small segment of people age 65 and older who go online.
While large majorities in nearly all demographic groups report coming across news on the Internet when not looking for it, there are some differences by race and ethnicity in how frequently this occurs. African Americans (83%) and Hispanics (79%) are more likely than whites (70%) to accidentally get news online when logging on for other purposes.
Search Engines and the News
The Internet provides news to people not actively seeking it, but it also enables those who are interested in a particular topic to research it more deeply. Seven-in-ten of those who go online for news (41% of Americans overall) say they have used search engines like Google or Yahoo to get information on news subjects in which they are interested. Roughly a third of the online news audience (34%) uses a search engine at least weekly.
As might be expected, regular Internet news consumers employ these search engines most frequently. Nearly half of those who go online for news regularly three days a week or more (47%) use Google, Yahoo or a similar search engine at least weekly. And 12% of regular online news consumers (at least three days a week) do this every day.
A sizable minority of Internet news consumers (26%) also get news via email updates or directly to their computer screens. This percentage rises to 35% among those who go online for news at least three days a week.
Internet News Use and Other Media
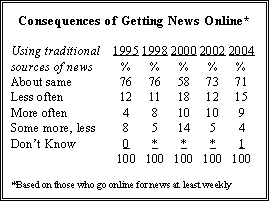
Most who go online at least weekly for the news (71%) say their use of other news sources has not been affected by the Internet. The percentage who say they use other news sources less often (15%) also has stayed fairly stable in recent years, as has the number who say their consumption of news from other sources has increased as a result of getting news online (9%).
Of those who say the Internet has reduced their consumption of news from other media sources, nearly half (47%) say they are using television less often and 39% are reading the paper less often. In terms of actual behavior, however, the Internet appears to have a significantly greater impact on online users' TV news time than on time spent on news from other sources. Only about a quarter of Internet users (27%) say they spent an hour or more watching TV news on a typical day, compared with 41% of those who do not go online. Both groups are equally likely to have read a newspaper the previous day.
Online News Interests
Weather is the number one news interest of the online news audience, but interest in politics and international news is on the increase. About three-quarters (76%) of all of those who ever go online for news say they sometimes get weather information. That is up from 70% two years ago and 66% in 2000. This represents 44% of all Americans who sometimes get weather information online, up from 32% four years ago.
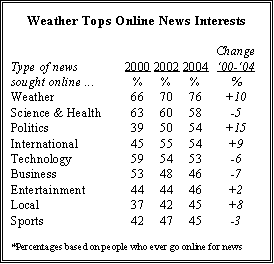
Over the last four years, there also has been a sharp increase in the percentage who log on for political news (up 15 points since 2000) and international news (up nine points). For the most part, these gains have occurred across political and demographic groups. But as is the case with overall public interest in politics and international news, there are major differences based on education, gender, income and other factors.
Nearly two-thirds of college graduates who go online for news say they sometimes get political or international news (65% each) compared with only about four-in-ten with a high school education (42% each). In addition, more men than women also go online for political and international news. And beyond those two topics, men have higher levels of interest than women in going online for sports news and business news. A greater percentage of women than men go online for local news and women are just as likely as men to use the web for weather, science and health and entertainment news.
Public's Strong Appetite for Technology
Americans continue to avail themselves of a wide array of technology for business, communication and entertainment. And with increasing speed, some high-tech products particularly home entertainment items are becoming commonplace. As recently as four years ago, just 16% of Americans said they had a digital video disc (DVD) player. That percentage nearly tripled by 2002 (to 44%), and has again increased sharply (to 76%).
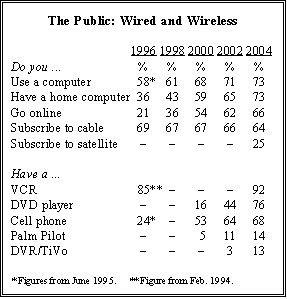
The use of digital video recorders, TiVo being the most commonly known brand, has expanded quickly from a fraction of the population two years ago (3%) to 13% today. Growth has been slower in older home technology items, like video cassette recorders, which remain practically ubiquitous (92%).
The number of Americans who subscribe to cable TV has slipped a bit over the past decade, due at least in part to the prevalence of satellite TV as an option. Currently, 64% nationwide say they subscribe to cable, and 25% subscribe to a satellite TV network such as the Dish or DirectTV. Satellite service has been adopted by nearly half (47%) of those living in rural parts of the country, where just 38% have cable (down from 47% two years ago). But cable still has three to four times as many subscribers than satellite in cities and suburban areas.
Digital communication tools such as cell phones and Palm Pilots continue to expand in popularity. Over two-thirds (68%) report owning a cell phone, up only slightly from two years ago (64%). A much smaller proportion of Americans (14%) own a Palm Pilot or other similar product.
Cell Phone Use Growing Among Seniors
The growth of cell phone use since the mid-1990s shows how different age groups adapt to new technologies. Over the past nine years, cell phone ownership has increased dramatically across all age groups, though older Americans have been slower to adapt.
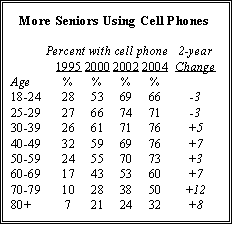
But in recent years, as cell phone use has become widespread among younger people, overall growth has slowed. By contrast, the growth in cell phone use among those in their 60s and especially those in their 70s has been robust. Today, half of those age 70-79 say they have cell phones, compared with just 38% two years ago. That is the largest increase for any age group over that period.
==============================
III. International News Audience Broader, Not Deeper
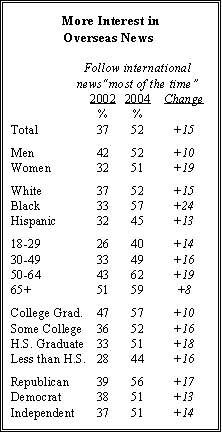
Over the past two years, there has been a dramatic rise in the number of Americans who say they closely follow international news most of the time, not just when important events occur. For the first time since the Pew Research Center began asking six years ago, nearly as many Americans say they track international news closely most of the time (52%), as say that about national news (55%) and local news (55%).
Clearly, the continuing violence in Iraq is a major factor behind the increasing interest in overseas news. Indeed, the shift has been especially large among several demographic groups that typically have generally shown low levels of interest in overseas news not directly involving Americans including women, minorities and less-educated Americans. These same groups have paid far closer attention to the war in Iraq than most other international news stories.
In that regard, the small but growing group that expresses serious interest in news on international affairs those who follow this type of news very closely has not become much more demographically diverse. Since 2000, the percentage of Americans who follow news about international affairs very closely has grown from 14% to 24% the largest increase recorded for any category of news. But this core audience for news on international affairs continues to be dominated by well-educated males. In 2000, about twice as many college graduates as people with a high school education said they paid very close attention to news on international affairs; that remains the case in the current survey.
Wider Audience for International News
Two years ago, just 37% of Americans said they followed international news most of the time, compared with 61% who said they paid attention only when major developments occurred. The balance of opinion has shifted, and now a 52% majority tracks international news most of the time.
This shift has come across the demographic and political spectrum, but has been particularly notable among African Americans, women, and those with a high school education or less. Nearly six-in-ten African Americans (57%) say they pay attention to foreign news most of the time, up from 33% in 2002. The gender gap in international news interest has all but disappeared: narrow majorities of men (52%) and women (51%) now say they regularly follow overseas developments. And while education remains a major factor in foreign news interest and news interest generally differences on this score also have narrowed. About six-in-ten college graduates (57%) say they follow overseas news most of the time compared with 49% of those with a high school education or less; two years ago, the gap was about twice as large (47% college graduate/32% high school or less).
While growing numbers of Republicans, independents and Democrats say they routinely follow international news, the biggest increase has come among Republicans (up 17% since 2002). Somewhat more Republicans than Democrats and independents say they follow international news most of the time (56% vs. 51% for Democrats and independents).
More Follow Foreign News 'Very Closely'
Between 2000 and 2002, the number of Americans who expressed strong interest in international affairs grew by half (from 14% to 21%). That number has increased again, to 24%, in the current survey.
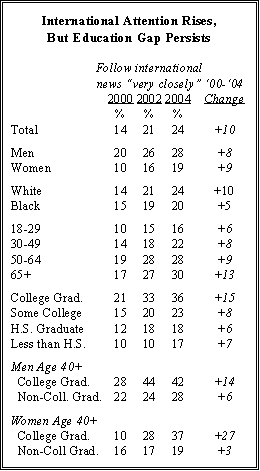
But much of the increase has come among groups that already were highly interested in news about international matters. In most cases, the education, age and gender differences that were evident in 2000 have not narrowed significantly.
However, one notable development has been the sharp increase in the number of female college graduates age 40 and older who say they follow news about international affairs very closely. This percentage has nearly quadrupled since 2000 from 10% to 37%. The gender gap among college graduates age 40 and older has narrowed considerably; from 18 points in 2000 to five points in the current survey.
Foreign News Interest: Iraq Dominates
Beginning in the fall of 2002, the situation in Iraq has dominated the Pew Research Center's monthly news index. Since then, the high price of gasoline is the only non-Iraq story to lead the monthly index (in April 2004).
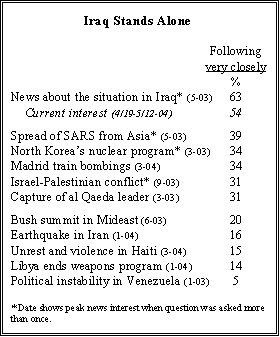
Public attention to the Iraq war peaked in May 2003 (at 63%), but has remained at a high level since then. In the current survey, which covered a period of intense fighting in Iraq and the revelations of abuse at Abu Ghraib prison, 54% said they were following developments there very closely.
Since the beginning of 2003, the public has paid only modest attention to foreign news stories, with some notable exceptions. The spread of the SARS epidemic in Asia, with its potential ramifications for the health of Americans, drew widespread attention last May (39% very closely). Nuclear proliferation (North Korea's nuclear program) has consistently drawn fairly high public interest, as has the Mideast crisis and stories involving overseas terrorism or al Qaeda.
But international stories that are perceived to have little direct impact on American lives and security attract scant interest from the public. This is normally even the case for developments in nearby countries like Haiti and Venezuela. In 1994, there was substantial interest in the U.S. invasion of Haiti to restore President Jean-Bertrand Aristide to power (38% very closely).
Aristide's ouster at the hands of anti-government rebels this spring and the dispatch of a relatively small number of U.S. forces to Haiti drew much less attention (15% very closely in March). In January of 2003, fewer than one-in-ten Americans tracked developments in Venezuela very closely.
==============================
IV. Attitudes Toward the News
Most Americans pay only a moderate amount of attention to what is traditionally referred to as hard news coverage of international affairs, politics and events in Washington, local government, and business and finance. A smaller group of news consumers less than a third of the public (31%) consistently focuses on these types of stories. At the other end of the spectrum, about one-in-ten Americans (13%) do not follow these subjects at all, preferring other kinds of news or no news at all.
Over the past eight years, the hard news audience has ranged in size from a low of 24% in 2000 to its current level of 31%, with the increase over the past four years driven largely by the rise in interest in international news. While a minority overall, these hard news enthusiasts make up a majority of the audience for a number of news programs, and express distinctly different attitudes and preferences about what they want in the news.
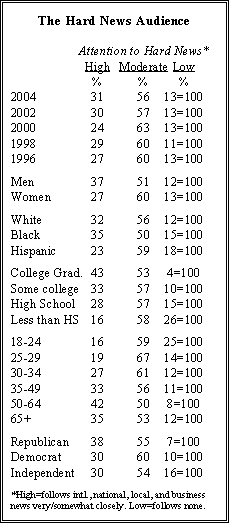
The attentive audience for political, international and financial news tends to be better educated and middle-aged. Whites and blacks express comparable levels of interest (32% for whites, 35% for blacks), but Hispanics are less apt to follow hard news closely (23%). Republicans pay somewhat more attention (at 38%) than do Democrats or independents (30% each).
Young people those age 18-24 are considerably more likely than those in other age groups to be disengaged from hard news, with 25% saying they do not follow any of the four types of news. More people in this age group pay no attention to hard news than express strong interest (25% vs. 16%). By comparison, far fewer people in their late 20s (age 25-29) are disengaged from hard news (14%). The highest level of attention is seen among those aged 50-64, where 42% are highly attentive.
Where Hard News Consumers Go
Most news organizations attract a wide range of news consumers, including the hard news core and those who are less interested in such news. But some stand out for their high proportion of hard news viewers and readers. Among the regular audiences for broadcast programs, Rush Limbaugh's radio show (56% attentive), the Sunday morning interview programs (52%), the NewsHour (52%), the O'Reilly Factor (49%), and Larry King Live (48%) have especially large numbers of hard news consumers.
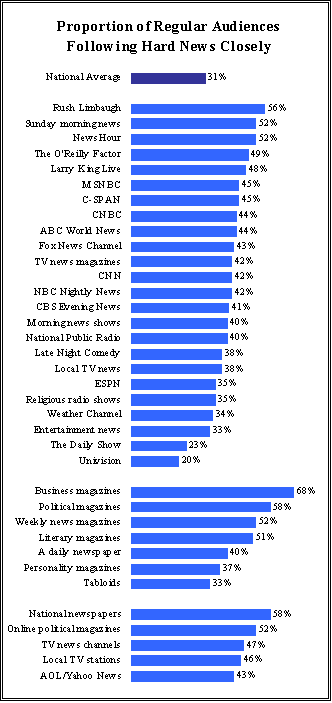
In the print media, the regular audience for business magazines stands out for its high proportion of the hard news consumers (68%). But so too do the readers of political magazines such as the New Republic and the National Review (58% attentive), the weekly news magazines such as Time and Newsweek (52%), and literary magazines such as the New Yorker, the Atlantic, and Harper's (51%).
And the regular audiences for news from Internet sources also are disproportionately made up of those interested in hard news. Nearly six-in-ten (58%) of those who log on to the websites of national newspapers are hard news consumers. Among those who regularly read online political magazines such as Slate.com and the National Review.com, 52% fall into this category. So do large proportions of the audiences for network TV news websites (47% highly attentive), local TV websites (46%), and the news pages of Internet hosts such as AOL and Yahoo (43%).
How People Like Their News
Beyond the types of news that interest people, the choices made by news audiences are driven by two general kinds of preferences. One is how they like to get the news, including choices with regard to schedule and format. The other is what people want in news content, including choices among levels of detail, ideological viewpoints, debate and argument, humor, and human interest.
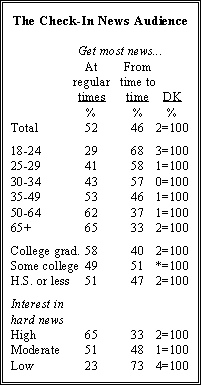
Americans' busy lifestyles, combined with on-demand news sources, means that people fit news into their schedules in different ways. About half (52%) say they mostly get their news at regular times of the day, while nearly as many (46%) say they are more the kind of person who checks in on the news from time to time. These attitudes have been stable since 2002.
Older Americans express a preference for getting the news at regular times, a function both of the news habits they grew up with and a more settled lifestyle. By nearly two-to-one (65%-33%), those age 65 and older say they watch or listen to the news at regular times. By contrast, the youngest respondents in the survey those 18 to 24 show exactly the opposite pattern, with 68% saying they generally check in on the news from time to time (just 29% watch or listen at regular times). Getting news on a more regular schedule is also characteristic of college-educated people.
Most Americans watching TV news keep the remote control handy, flipping to other channels when they are not interested in the topic of the moment. Overall, 62% of the public says they watch the news this way, a habit that has neither grown nor dissipated over the past six years. Even among those who get the news on a regular schedule as opposed to those who check in from time to time 54% say that the channel changer is often at hand. Among the news grazers, a solid majority (72%) say they watch the news with their remotes at the ready.
Overall, fewer than one-in-four Americans (23%) are steady news watchers, saying they watch on a regular schedule and don't flip channels. At the other end of the spectrum are 33% who truly graze the news checking in from time to time when convenient, and ready to change the channel whenever they don't find the subject interesting.
Appointment News vs. Grazing
People who get the news at regular times of the day make up the bulk of the audience for local and network TV news broadcasts. Three-quarters (74%) watch the local television news regularly, and nearly half (47%) regularly watch the network evening news programs.
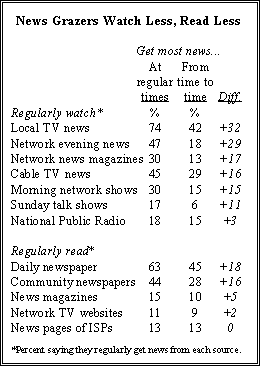
People who "check in" on the news are far less likely to watch broadcast and cable news, particularly the network evening news (only 18% watch regularly). There are similar gaps with respect to morning news programs, Sunday talk shows, and network news magazines such as 60 Minutes and 20/20; each of these sources is watched far more often by people for whom news is part of a daily schedule. And 63% of this group reads a daily newspaper regularly, compared with 45% of those whose news consumption is unscheduled.
Radio and the Internet stand apart, however, as relatively important sources for those who pick up news from time to time. News grazers listen to NPR at about the same rate as those who get their news at regular times (15% vs. 18%). Grazers also log onto major news websites in roughly the same numbers as those who get news on a schedule.
Images vs. Words
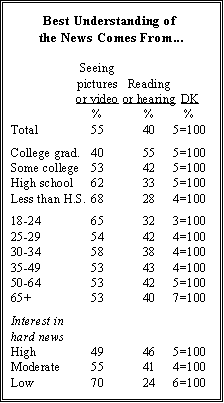
When asked to choose which way of getting the news provides the best understanding of major news events, most Americans (55%) express a preference for seeing pictures or video footage showing what happened; 40% say they learn more from reading or hearing the facts about what happened.
College graduates express a preference for words over pictures (by 55% to 40%), while those with no college experience say they get a better understanding from seeing pictures (by 64%-32%). The youngest survey respondents (18-24) prefer pictures by a two-to-one margin, but from ages 25 and up, there is no association between age and preference for pictures. Among the best educated respondents (those with a college degree or more), young people are just as apt to prefer reading and hearing the news as older people are.
People who prefer reading and hearing are more likely to be found among the regular audience for most print media, for NPR, and for news-oriented websites. But for the most part, those who say they better understand the news through pictures are not disproportionately likely to frequent television news sources; with very few exceptions, these media draw about equally well from people who like reading and hearing about the news.
Many Want More Than the Headlines
Four-in-ten Americans say that for major news stories, they usually want in-depth analysis of the news in addition to the headlines and basic facts. A similar proportion (37%) say they prefer the headlines plus some reporting on the facts, but not in-depth analysis. Far fewer people (18%) say they prefer just the headlines.
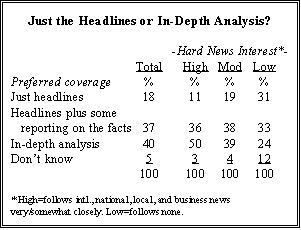
The preferences of hard news consumers are not markedly different from those who only express moderate interest in hard news. Half of hard news consumers say they like in-depth analysis, while 36% prefer to get the headlines and some coverage of the facts. This represents only a bit more emphasis on analysis than among the majority who are only moderately interested in hard news (39% of whom also prefer in-depth coverage). Only those who are disengaged from hard news altogether show a clear preference for simpler news presentations.
There are a handful of news outlets that attract a disproportionate share of the in-depth audience. Fully 63% of regular NewsHour viewers say they want the news provided with in-depth analysis from experts, far above both the national average and the audiences for all other television news programs. The Internet, particularly the websites of major national newspapers like the New York Times and Wall Street Journal, also draws significant interest from those who desire in-depth coverage.
News Styles: From Serious to Lighthearted
Americans like many different styles of presenting the news, and their preferences range from the serious to the lighthearted. A solid majority (55%) likes debates between people with different points of view, and 46% like in-depth interviews with leaders and policymakers. But comparable numbers like news presented by reporters and anchors with pleasant personalities (53%) and from news sources that are entertaining (48%) or funny (46%).
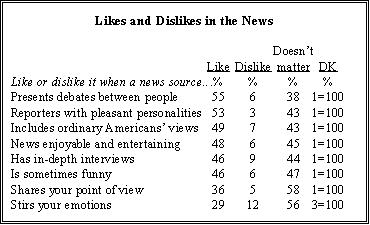
About half of the public (49%) likes news sources that present the views of ordinary Americans. Fewer (36%) express a positive opinion of news sources sharing their point of view on politics and issues; a majority (58%) says this does not matter to them. Just 29% of Americans want to be moved emotionally by the news, while 12% dislike news aimed at stirring the emotions.
Regardless of their views of various styles of presenting the news, the vast majority of Americans (87%) say they "want the news to contain information that is helpful in my daily life." Nearly half of Americans (47%) completely agree with that statement, while 40% mostly agree. Just 11% reject the idea that news should have information that is helpful in daily life.
More Signs of Cynicism
The public is increasingly cynical toward the news media, as reflected in the slumping credibility ratings for many outlets. More generally, a majority of Americans (53%) agree with the statement "I often don't trust what news organizations are saying." And while 43% disagree with that statement, just 9% completely disagree with it.
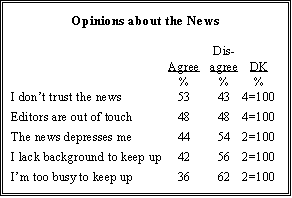
Feelings of mistrust of news organizations are fairly widespread. About six-in-ten Republicans (58%) say they often do not trust what news organizations are saying, but nearly half of Democrats share that opinion (47%). Older men, those age 50 and older, are particularly cynical toward the news media: 62% say they often do not trust news organizations. Younger women are decidedly less negative, with 35% of women under age 30 expressing mistrust for news outlets.
A relatively large percentage of the public (48%) also expresses the opinion that "people who decide what to put on TV news or in the newspapers are out of touch with people like me." This view is prevalent among older Americans, who comprise the bulk of the audience for network evening news and several other news sources. A majority (55%) of those age 50 and older believe news organizations are out of touch, compared with 44% of those under age 50.
Somewhat fewer Americans (44%) say they are often depressed by the news, while a majority (54%) disagrees. There is a wide gender gap in these attitudes, as a majority of women (53%) say they find the news often depressing. By comparison, only about a third of men (34%) acknowledge getting depressed by the news.
Barriers to Following the News
Americans' increasingly crowded schedules are often cited as a major reason why some people do not keep up with the news, but a lack of background information is actually a bigger factor. About four-in-ten (42%) say they often do not have enough background information to follow stories, while somewhat fewer (36%) say they are often "too busy" to keep up.
Half of those with a high school education cite a lack of necessary background information as a barrier to following the news; fewer than three-in-ten college graduates agree (27%). However, young people are not significantly more likely than older Americans to cite a lack of background as a reason for not keeping up with the news.
Age is a major factor in the question of whether people are too busy to follow the news, but education influences these attitudes as well. Half of those under age 25 say they are often too busy to follow the news, while just 28% of those 65 and older cite time constraints as a reason for not keeping up. Less educated Americans also more often cite a lack of time as a reason for not following the news.
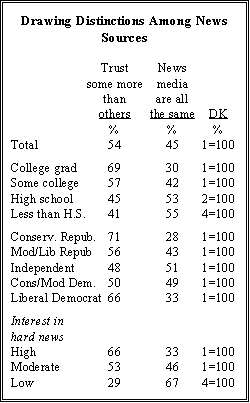
Are News Media All the Same?
Most Americans look at the media landscape and discern important distinctions among sources, but a sizable minority (45%) views the news media "as pretty much the same to me."
Those at both ends of the political spectrum perceive meaningful differences among news organizations, and trust some more than others. Seven-in-ten conservative Republicans (71%) say there are a few news sources they trust more than others, and nearly as many (66%) liberal Democrats share that view.
Independents and moderates, by contrast, are more divided in their outlook. Roughly half of independents (51%), and conservative and moderate Democrats (49%), regard news organizations as fairly similar. Most moderate and liberal Republicans (56%) say there are a few news sources they trust more than others, but many (43%) do not differentiate among news organizations.
Two-thirds (66%) of those with a strong interest in hard news perceive clear distinctions among news outlets, but only about half (53%) of those with a moderate interest in hard news agree. And those with no interest in hard news overwhelmingly view news organizations as "pretty much the same."
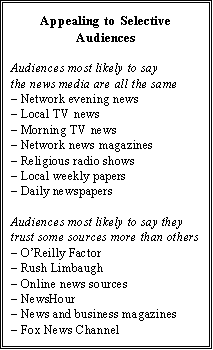
By their nature, the news outlets that appeal to narrower, hard news-oriented audiences are drawing viewers who see important differences between the credibility of news organizations. By large margins, people who watch the O'Reilly Factor and the NewsHour say they trust certain sources more than others, as do those who regularly listen to Rush Limbaugh and read online news sources and weekly news magazines. By comparison, regular viewers of the major network news programs and readers of daily newspapers are less discriminating, though even here most say they trust some sources more than others.
Most Ambivalent Toward News With a View
Most Americans (58%) do not care if the news reflects their own viewpoint on politics and issues. But the minority of Americans that like the news to reflect their own views (36%) are highly selective in their choices of news outlets.
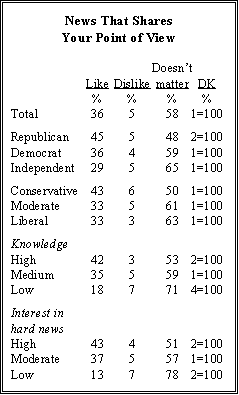
More members of both parties than independents and more Republicans than Democrats say they like the news to share their point of view. Roughly four-in-ten conservatives (43%) likes news that reflects their own opinions, compared with a third of moderates and liberals.
More generally, people who pay close attention to hard news express a preference for news that suits their point of view. Among those who follow international, national, local government, and business news, 43% say they like news with their point of view. Among those who follow none of these topics closely, just 13% say the same.
News With a View Left and Right
There are several key differences in some of the news consumption habits of liberals and conservatives who like the news to reflect their political views, although they turn to some major news outlets (network evening news, among others) in about the same numbers.
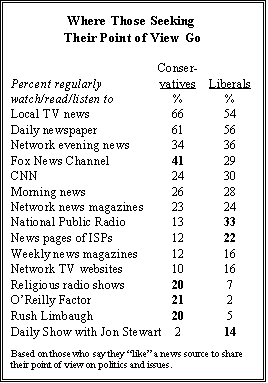
Among specific programs, the O'Reilly Factor, religious radio shows and Rush Limbaugh's show are important news sources for conservatives especially those who like the news to reflect their views. And Comedy Central's Daily Show, viewed regularly by only 3% of Americans overall, is a staple for 14% of liberals who like news that reflects their point of view.
Beyond the ideological appeal of these programs, the survey also finds that the Fox News Channel and National Public Radio draw people with strong ideological views who prefer news sources that reflect those views. Liberals who like their point of view reflected in the news are twice as likely as the national average (33% vs. 16%) to regularly listen to NPR. Similarly, 41% of conservatives who like news that shares their point of view regularly watch Fox News Channel, compared with 25% of the public.
Weather News Top Draw
While there has been an increase in the number of Americans who follow hard news especially international news interest in most news topics has remained stable in recent years. Far more Americans (53%) say they track weather news very closely than express strong interest in any other subject.
About a third of those surveyed (32%) say they follow crime news very closely, about the same as in 2002 and 2000. There continues to be a wide racial disparity in public interest in crime news; 55% of African Americans track crime news very closely compared with 28% of whites. African Americans also
express more interest than whites in community news, which draws close attention from 28% of the public. Four-in-ten blacks say they follow news about people and events in their own community, compared with about a quarter of whites (26%).
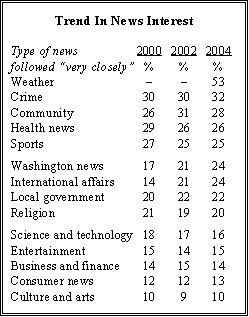
Health news is followed more closely by older people; 34% of people over age 50 pay very close attention to health news compared with just 20% of people under age 30. And a third of women say they follow health news very closely compared with 18% of men.
Common Concerns Weather, Health
Clearly, education is a very important factor in the public's news interests. College graduates make up a disproportionate percentage of the hard news audience and, in particular, the growing audience for international news.
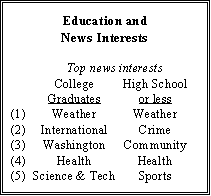
However, while people with a high school education display much more interest in weather news than do college graduates (58% vs. 45%), the weather tops the list of news subjects for both groups. Similarly, health news is among the leading interests of high school-educated people and college graduates.
Otherwise, their leading news interests are quite different. Community news, crime and sports news rate among the subjects that most interest people with a high school education; international affairs, Washington news and science and technology are among the leading topics for college graduates.
Stewart Verdict Widely Known
About eight-in-ten Americans (79%) were able to recall that Martha Stewart was found guilty in her recent trial. There also is broad awareness of the name of the terrorist group that carried out the Sept. 11 attacks. In an open-ended format, 71% volunteered al Qaeda or cited Osama bin Laden.
By comparison, 56% know that the Republicans currently
maintain a majority in the House of Representatives. And about the same number
(55%) are able to correctly estimate the current number of U.S. military deaths
in Iraq as between 500 and 1,000 (the survey was in the field from April 19 to
While older Americans generally score better than younger people in the knowledge questions, education is an even bigger factor. For example, three-quarters of college graduates (76%) knew that the GOP has a majority in the House, compared with just 44% of those with no more than a high school education.
News Sources and Knowledge
The most knowledgeable audiences for specific news outlets tend to be those where the typical reader, viewer or listener is well-educated, older, or both. For example, roughly six-in-ten (59%) regular readers of literary magazines like the New Yorker and Atlantic answered all four current events questions correctly, highest among regular news audiences. The readership of these magazines also has the greatest proportion of college graduates.
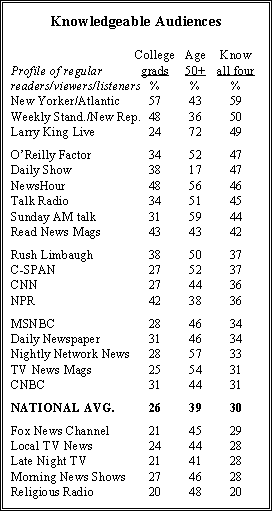
Similarly, the readership for political magazines like the New Republic and Weekly Standard is relatively knowledgeable and well-educated; fully half correctly answered all four questions. By contrast, regular viewers of Larry King Live scored about as well as those who read political magazines (49% all four correct), although just 24% completed college. However, the audience for King's program includes a much greater proportion of those age 50 and older than the audience for any other source (72%).
Those who say they regularly watch the Daily Show with Jon Stewart are much younger than average just 17% are 50 and older. But they are relatively well-educated 38% are college graduates and are fairly knowledgeable about current events (47% all four correct). Regular viewers of the Daily Show are about as knowledgeable as the regular audiences for the O'Reilly Factor (47%), the NewsHour (46%), talk radio (45%) and Sunday morning political talk shows (44%).
The audiences for cable networks and broadcast TV news outlets, which tend to be broader and more similar demographically to the nation as a whole, are somewhat less knowledgeable than some of these more specialized audiences. Comparable numbers of regular viewers of CNN (36%), MSNBC (34%) and the nightly network news programs (33%) correctly answered all four current events questions. Viewers of the Fox News Channel score almost precisely at the national average (29% answer all four correctly, compared to 30% nationwide), despite having fewer college graduates as regular viewers.
==============================
V. Media Credibility Declines
Credibility ratings for the major broadcast and cable television outlets have fallen somewhat in recent years, due in large part to increased cynicism toward the media on the part of Republicans and conservatives. CNN no longer enjoys the top spot as the most credible TV news source; it is now in a statistical tie with CBS's 60 Minutes.
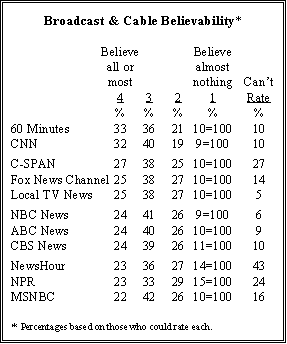
From 1996 to 2002, CNN was viewed as the most believable broadcast or cable outlet, but its ratings have fallen gradually over time. Today 32% of those able to rate CNN say they can believe all or most of what they see on the cable network. This is down from 37% is 2002, 39% in 2000, and a high of 42% in 1998. Ratings for 60 Minutes have remained relatively stable over that period, and today 33% of those who can rate it find the TV news magazine highly credible.
Just as CNN's credibility ratings have fallen, ratings for the major broadcast networks have declined as well. NBC News, ABC News and CBS News are rated about equally in terms of believability by the public. Among those able to rate NBC News, 24% find the network highly credible, down from a high of 30% in 1998. ABC News has followed an similar pattern: 24% view it as highly believable, compared with 31% in 1996. And CBS News has moved from 32% who saw it as believable in 1996 to 24% today.
Ratings for the Fox News Channel have remained relatively stable in recent years: 25% now say they can believe all or most of what they see on Fox, which is virtually the same as the cable network's rating in 2000 (26%). At the same time, ratings for the cable network MSNBC have fallen somewhat 22% now view MSNBC as highly credible vs. 28% in 2000. The public has become more familiar with each of these cable news channels in recent years. In 2002, 21% of the public said they did not know enough about the Fox News Channel to give it a rating, compared with 14% today. Similarly, 23% were unable to rate MSNBC in 2002, and now 16% fall into that category.
C-SPAN's visibility also has increased. In 2002, 39% said they could not rate C-SPAN in terms of believability; that has dropped to 27%. Roughly a quarter of those able to rate C-SPAN (27%) say it is highly believable, compared with 30% two years ago.
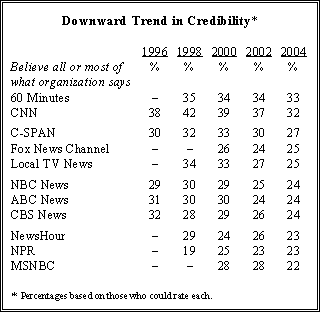
Credibility ratings for the NewsHour with Jim Lehrer have dropped marginally in recent years. Among those able to rate the show, 23% see it as highly credible. This is down somewhat from 29% in 1998 and 26% in 2002. NPR is viewed as highly credible by an equal proportion of those able to give a rating (23%). This figure is unchanged from 2002.
Wall Street Journal Declines
A similar pattern of waning credibility can be seen for print news outlets. The changes have not been dramatic, but there have been modest shifts downward across a broad range of print sources. Two news organization share the top spot in terms of print news credibility. The weekly news magazine U.S. News & World Report and the Wall Street Journal are viewed as highly credible by 24% of those who are able to rate them.
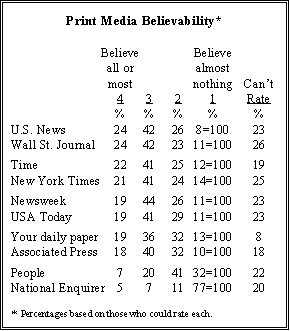
In previous polls, the Wall Street Journal stood well above the rest of the pack, but that is no longer the case. Ratings for the Journal have plummeted in recent years. In 1998 and 2000, 41% of those able to rate it said they could believe all or most of what they read in the Wall Street Journal. That number fell to 33% in 2002 and now stands at 24%.
Most of the other print sources tested in the poll receive similar ratings for believability. Time Magazine is viewed as highly believable by 22% of people familiar enough to rate it, and the New York Times gets a 21% rating. Newsweek and USA Today get a high rating from 19%; that is also the rating respondents give to their own daily paper. The Associated Press is viewed as highly credible by 18% of Americans who can rate it.
Ratings for Time, Newsweek and USA Today have fallen somewhat in recent years. Ratings for local daily newspapers have fallen more sharply. In 1998, roughly three-in-ten (29%) of those able to rate their local newspaper said they could believe all or most of what it said. That has declined to 19% in the current survey.
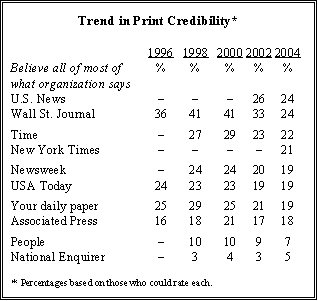
Entertainment and tabloid news sources receive the lowest ratings overall. Just 7% of those who can rate it say they can believe all or most of what they read in People Magazine, and even fewer (5%) find the National Enquirer highly believable.
Partisan Divisions Drive Credibility Slump
The falloff in credibility for these news sources is linked to a growing partisan tilt in the ratings. Republicans have traditionally viewed the overall media more skeptically than Democrats and this has long translated into lower credibility ratings from Republicans for most news sources.
But Republicans have become even more negative about the media's believability, widening the partisan gaps and driving down the overall ratings of several major news organizations. In 1998, 44% of Democrats and 39% of Republicans gave CNN very high ratings for believability. By 2002, the partisan gap had widened significantly: 45% of Democrats and 32% of Republicans gave CNN the highest rating. In the current survey, CNN's rating among Democrats remains at 45%, while falling further among Republicans (to 26%).
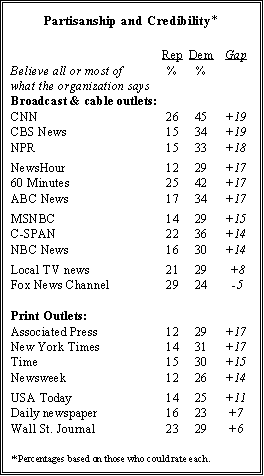
More surprising is the sharp decline among members of both parties but especially Republicans in ratings for the Wall Street Journal. In 1998, Republicans were more trusting than Democrats of the Wall Street Journal by a margin of 48% to 42%. That was still the case in 2002 when 35% of Republicans and 29% of Democrats gave the Journal a very high rating for believability. Today, Democrats are actually more trusting of the Journal 29% give it a high rating vs. 23% of Republicans.
Ratings for the NewsHour and the Associated Press also have changed dramatically among Republicans. As recently as two years ago, fairly comparable percentages of Democrats (28%) and Republicans (24%) gave high credibility ratings to the PBS news program. Today, about the same proportion of Democrats (29%) give the NewsHour high marks for believability, compared with only 12% of Republicans.
Even C-SPAN, the non-profit, public affairs network has seen its ratings become more politicized. In 1998, Republicans were slightly more likely than Democrats to view C-SPAN as highly believable. By 2000, the balance of opinion had shifted, though Republicans and Democrats still had fairly similar views about C-SPAN. Today significantly more Democrats than Republicans give C-SPAN high marks for believability (36% vs. 23%, respectively).
Credibility ratings for the major news networks have not changed as dramatically in recent years, largely because they have long been divided along partisan lines. In the case of NBC News, the partisan gap is as large as it was in 1998 (13 points), and partisan differences in evaluations of ABC News have grown only marginally. But ratings for CBS News have become more partisan: currently, 34% of Democrats and just 15% of Republicans view CBS News as highly credible. The network's rating among Democrats is about the same as it was six years ago (33% in 1998), while its credibility among Republicans has fallen eight points (from 23%).
Opinions of the believability of Time and Newsweek also have become more partisan. In 1998, 34% of Democrats vs. 23% of Republicans gave Time a high believability rating. Today, 30% of Democrats and 15% of Republicans view Time as highly believable. A similar pattern can be seen for Newsweek.
Fox Leads Among Reps, CNN Among Dems
As a consequence of the increasing partisanship, the most trusted news sources for Democrats, Republicans and independents vary widely. Three news organizations, CNN, 60 Minutes and C-SPAN make the list of the most trusted sources for all three groups.
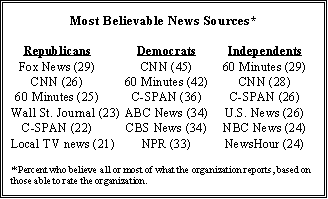
The Republicans' most trusted source is the Fox News Channel, which does not appear in the top six for either Democrats or independents. Similarly, the Wall Street Journal and local television news are among the most trusted sources for Republicans, but are not among the Democrats' top picks.
Democrats find ABC News, CBS News and NPR highly believable. Neither Republicans nor independents place these sources in their top tier of credible news sources. For independents, U.S. News & World Report, NBC News and the NewsHour are among the most trusted news sources. But none of these news organizations make the Republicans' or Democrats' lists of most believable sources.
==============================
About the Surveys
Results for the 2004 Biennial Media Consumption survey are based on telephone interviews conducted under the direction of Princeton Survey Research Associates International among a nationwide sample of 3,000 adults, 18 years of age or older, during the period April 19-May 12, 2004. For results based on the total sample, one can say with 95% confidence that the error attributable to sampling is plus or minus 2 percentage points. For results based on either Form 1 (N=1,493) or Form 2 (N=1,507), the sampling error is plus or minus 3 percentage points.
Results for the Believability survey, in which respondents
are asked to rank how much they believe various news organizations on a scale
from 4 to 1, are based on telephone interviews conducted under the direction of
Princeton Survey Research Associates International among a nationwide sample of
1,001 adults, during the period
In addition to sampling error, one should bear in mind that question wording and practical difficulties in conducting surveys can introduce error or bias into the findings of opinion polls.
Survey Methodology in Detail
The sample for this survey is a random digit sample of telephone numbers selected from telephone exchanges in the continental United States. The random digit aspect of the sample is used to avoid "listing" bias and provides representation of both listed and unlisted numbers (including not-yet-listed). The design of the sample ensures this representation by random generation of the last two digits of telephone numbers selected on the basis of their area code, telephone exchange, and bank number.
The telephone exchanges were selected with probabilities proportional to their size. The first eight digits of the sampled telephone numbers (area code, telephone exchange, bank number) were selected to be proportionally stratified by county and by telephone exchange within county. That is, the number of telephone numbers randomly sampled from within a given county is proportional to that county's share of telephone numbers in the U.S. Only working banks of telephone numbers are selected. A working bank is defined as 100 contiguous telephone numbers containing three or more residential listings.
The sample was released for interviewing in replicates. Using replicates to control the release of sample to the field ensures that the complete call procedures are followed for the entire sample. The use of replicates also insures that the regional distribution of numbers called is appropriate. Again, this works to increase the representativeness of the sample.
At least 10 attempts were made to complete an interview at every sampled telephone number. The calls were staggered over times of day and days of the week to maximize the chances of making a contact with a potential respondent. All interview breakoffs and refusals were re-contacted at least once in order to attempt to convert them to completed interviews. In each contacted household, interviewers asked to speak with the "youngest male 18 or older who is at home." If there is no eligible man at home, interviewers asked to speak with "the oldest woman 18 or older who is at home." This systematic respondent selection technique has been shown empirically to produce samples that closely mirror the population in terms of age and gender.
Non-response in telephone interview surveys produces some known biases in survey-derived estimates because participation tends to vary for different subgroups of the population, and these subgroups are likely to vary also on questions of substantive interest. In order to compensate for these known biases, the sample data are weighted in analysis.
The demographic weighting parameters are derived from a special analysis of the most recently available Annual Social & Economic Supplement data from the Census Bureau (March 2003). This analysis produced population parameters for the demographic characteristics of households with adults 18 or older, which are then compared with the sample characteristics to construct sample weights. The analysis only included households in the continental United States that contain a telephone. The weights are derived using an iterative technique that simultaneously balances the distributions of all weighting parameters.
==============================
Questionnaire Part 1
PEW
RESEARCH CENTER FOR THE PEOPLE AND THE PRESS
BIENNIAL
MEDIA CONSUMPTION SURVEY
FINAL
TOPLINE
April
19 - May 12, 2004
Total
N=3000
Form
1 N=1493
Form
2 N=1507
Q.1 Do you approve or disapprove of the way
George W. Bush is handling his job as president?
[IF DK ENTER AS DK. IF DEPENDS PROBE ONCE
WITH: Overall do you approve or disapprove of the way George W. Bush is
handling his job as President? IF STILL DEPENDS ENTER AS DK]
|
|
Approve |
Disapprove |
Don't
know |
|
April-May,
2004 |
44 |
44 |
12 |
|
Late
April, 2004 |
48 |
43 |
9 |
|
Early
April, 2004 |
43 |
47 |
10 |
|
Late
March, 2004 |
47 |
44 |
9 |
|
Mid-March,
2004 |
46 |
47 |
7 |
|
February,
2004 |
48 |
44 |
8 |
|
Mid-January,
2004 |
56 |
34 |
10 |
|
Early
January, 2004 |
58 |
35 |
7 |
|
2003 |
|
|
|
|
December,
2003 |
57 |
34 |
9 |
|
November,
2003 |
50 |
40 |
10 |
|
October,
2003 |
50 |
42 |
8 |
|
September,
2003 |
55 |
36 |
9 |
|
Mid-August,
2003 |
56 |
32 |
12 |
|
Early
August, 2003 |
53 |
37 |
10 |
|
Mid-July,
2003 |
58 |
32 |
10 |
|
Early
July, 2003 |
60 |
29 |
11 |
|
June,
2003 |
62 |
27 |
11 |
|
May,
2003 |
65 |
27 |
8 |
|
April
10-16, 2003 |
72 |
22 |
6 |
|
April
9, 2003 |
74 |
20 |
6 |
|
April
2-7, 2003 |
69 |
25 |
6 |
|
March
28-April 1, 2003 |
71 |
23 |
6 |
|
March
25-27, 2003 |
70 |
24 |
6 |
|
March
20-24, 2003 |
67 |
26 |
7 |
|
March
13-16, 2003 |
55 |
34 |
11 |
|
February,
2003 |
54 |
36 |
10 |
|
January,
2003 |
58 |
32 |
10 |
|
2002 |
|
|
|
|
December,
2002 |
61 |
28 |
11 |
|
Late
October, 2002 |
59 |
29 |
12 |
|
Early
October, 2002 |
61 |
30 |
9 |
|
Mid-September,
2002 |
67 |
22 |
11 |
|
Early
September, 2002 |
63 |
26 |
11 |
|
Late
August, 2002 |
60 |
27 |
13 |
|
August,
2002 |
67 |
21 |
12 |
|
Late
July, 2002 |
65 |
25 |
10 |
|
July,
2002 |
67 |
21 |
12 |
|
June,
2002 |
70 |
20 |
10 |
|
April,
2002 |
69 |
18 |
13 |
|
Early
April, 2002 |
74 |
16 |
10 |
|
February,
2002 |
78 |
13 |
9 |
|
January,
2002 |
80 |
11 |
9 |
|
2001 |
|
|
|
|
Mid-November,
2001 |
84 |
9 |
7 |
|
Early
October, 2001 |
84 |
8 |
8 |
|
Late
September, 2001 |
86 |
7 |
7 |
|
Mid-September,
2001 |
80 |
9 |
11 |
|
Early
September, 2001 |
51 |
34 |
15 |
|
August,
2001 |
50 |
32 |
18 |
|
July,
2001 |
51 |
32 |
17 |
|
June,
2001 |
50 |
33 |
17 |
|
May,
2001 |
53 |
32 |
15 |
|
April,
2001 |
56 |
27 |
17 |
|
March,
2001 |
55 |
25 |
20 |
|
February,
2001 |
53 |
21 |
26 |
On a
different subject...
Q.2 Do you happen to read any daily newspaper or
newspapers regularly, or not?
|
|
Yes |
No |
Don't
Know |
|
April,
2004 |
60 |
40 |
* |
|
April,
2002 |
63 |
37 |
* |
|
April,
2000 |
63 |
37 |
* |
|
November,
1998 |
70 |
30 |
0 |
|
April,
1998 |
68 |
32 |
* |
|
April,
1996 |
71 |
28 |
1 |
|
June,
1995 |
69 |
34 |
* |
|
March,
1995 |
71 |
29 |
* |
|
October,
1994 |
73 |
27 |
* |
|
July,
1994 |
74 |
26 |
* |
|
February,
1994 |
70 |
30 |
0 |
|
January,
1994 |
71 |
29 |
* |
|
June,
1992 |
75 |
25 |
* |
|
July,
1991 |
73 |
27 |
* |
|
May,
1991 |
70 |
30 |
* |
|
January,
1991 |
72 |
27 |
1 |
|
November,
1990 |
74 |
26 |
0 |
|
October,
1990 |
72 |
28 |
0 |
|
July,
1990 |
71 |
29 |
0 |
|
May,
1990 |
71 |
29 |
0 |
Q.3 Do you happen to watch any TV news programs
regularly, or not?
|
|
Yes |
No |
Don't
Know |
|
April,
2004 |
79 |
21 |
* |
|
April,
2002 |
78 |
22 |
* |
|
April,
2000 |
75 |
25 |
* |
|
April,
1998 |
80 |
20 |
* |
|
April,
1996 |
81 |
19 |
0 |
|
June,
1995 |
78 |
22 |
* |
|
March,
1995 |
82 |
18 |
* |
|
October,
1994 |
81 |
19 |
* |
|
July,
1994 |
81 |
19 |
* |
|
February,
1994 |
84 |
16 |
0 |
|
January,
1994 |
85 |
15 |
* |
|
June,
1992 |
85 |
15 |
* |
|
July,
1991 |
84 |
16 |
* |
|
May,
1991 |
84 |
16 |
* |
|
January,
1991 |
88 |
12 |
* |
|
November,
1990 |
80 |
20 |
* |
|
October,
1990 |
81 |
19 |
0 |
|
July,
1990 |
81 |
19 |
0 |
|
May,
1990 |
80 |
20 |
0 |
Q.4 Do you listen to news on the radio regularly,
or not?
|
|
Yes |
No |
Don't
Know |
|
April,
2004 |
49 |
51 |
* |
|
April,
2002 |
48 |
52 |
* |
|
April,
2000 |
46 |
54 |
* |
|
April,
1998 |
52 |
48 |
* |
|
April,
1996 |
51 |
49 |
* |
|
June,
1995 |
50 |
50 |
* |
|
March,
1995 |
54 |
46 |
* |
|
October,
1994 |
51 |
49 |
* |
|
July,
1994 |
52 |
48 |
0 |
|
February,
1994 |
53 |
47 |
0 |
|
January,
1994 |
52 |
48 |
* |
|
June,
1992 |
54 |
46 |
* |
|
May,
1991 |
53 |
47 |
* |
|
January,
1991 |
55 |
45 |
* |
|
November,
1990 |
55 |
45 |
* |
|
October,
1990 |
54 |
46 |
0 |
|
May,
1990 |
56 |
44 |
* |
Q.5 We're interested in how often people watch
the TV network evening news programs by this we mean ABC World News Tonight
with Peter Jennings, CBS Evening News with Dan Rather, NBC Nightly News with
Tom Brokaw, and the PBS NewsHour with Jim Lehrer. Do you happen to watch TV evening news
programs regularly, or not?
|
|
|
April |
April |
April |
April |
March |
May |
Aug |
May |
|
|
|
2002 |
2000 |
1998 |
1996 |
1995 |
1990 |
1989 |
1987 |
|
|
|
|
|
|
|
|
|
|
|
|
52 |
Yes |
53 |
50 |
59 |
59 |
65 |
67 |
67 |
71 |
|
47 |
No |
47 |
50 |
41 |
41 |
35 |
32 |
33 |
28 |
|
1 |
DK/Ref. |
* |
* |
* |
* |
* |
1 |
* |
1 |
|
100 |
100 |
100 |
100 |
100 |
100 |
100 |
100 |
100 |
|
Q.6 Now I will read a list of some stories
covered by news organizations this past month.
As I read each item, tell me if you happened to follow this news story
very closely, fairly closely, not too closely, or not at all closely? [INSERT ITEM, ROTATE]
a.
News about the current situation in Iraq
|
|
|
|
|
|
|
|
Mid-March,
2004 |
47 |
36 |
12 |
4 |
1 |
|
Early
February, 2004 |
47 |
38 |
10 |
4 |
1 |
|
Mid-January,
2004 |
48 |
39 |
9 |
4 |
* |
|
December,
2003 |
44 |
38 |
11 |
6 |
1 |
|
November,
2003 |
52 |
33 |
9 |
5 |
1 |
|
October,
2003 |
38 |
40 |
14 |
7 |
1 |
|
September,
2003 |
50 |
33 |
10 |
6 |
1 |
|
Mid-August,
2003 |
45 |
39 |
10 |
5 |
1 |
|
Early
July, 2003 |
37 |
41 |
13 |
8 |
1 |
|
June,
2003 |
46 |
35 |
13 |
6 |
* |
|
May,
2003 |
63 |
29 |
6 |
2 |
* |
|
April
11-16, 2003 |
47 |
40 |
10 |
2 |
1 |
|
April
2-7, 2003 |
54 |
34 |
9 |
2 |
1 |
|
March
20-24, 2003 |
57 |
33 |
7 |
2 |
1 |
|
March
13-16, 2003 |
62 |
27 |
6 |
4 |
1 |
|
February,
2003 |
62 |
25 |
8 |
4 |
1 |
|
January,
2003 |
55 |
29 |
10 |
4 |
2 |
|
December,
2002 |
51 |
32 |
10 |
6 |
1 |
|
Late
October, 2002 |
53 |
33 |
8 |
5 |
1 |
|
Early
October, 2002 |
60 |
28 |
6 |
5 |
1 |
|
Early
September, 2002 |
48 |
29 |
15 |
6 |
2 |
b. News about candidates for the 2004
presidential election
|
|
Very
Closely |
Fairly
Closely |
Not
too Closely |
Not
at all Closely |
DK/Ref |
|
|
31 |
33 |
19 |
16 |
1 |
|
Mid-March,
2004 |
35 |
34 |
18 |
13 |
* |
|
Late
February, 2004 |
24 |
40 |
23 |
12 |
1 |
|
Early
February, 2004 |
29 |
37 |
20 |
13 |
1 |
|
Mid-January,
2004 |
16 |
30 |
27 |
26 |
1 |
|
Early
January, 2004 |
14 |
32 |
30 |
23 |
1 |
|
December,
2003 |
16 |
26 |
27 |
30 |
1 |
|
November,
2003 |
11 |
26 |
34 |
28 |
1 |
|
October,
2003 |
12 |
27 |
28 |
32 |
1 |
|
September,
2003 |
17 |
25 |
30 |
27 |
1 |
|
Mid-August,
2003 |
12 |
27 |
27 |
33 |
1 |
|
May,
2003 |
8 |
19 |
31 |
41 |
1 |
|
January,
2003 |
14 |
28 |
29 |
28 |
1 |
|
|
|
|
|
|
|
|
April,
2000 |
18 |
39 |
22 |
20 |
1 |
|
March,
2000 |
26 |
41 |
19 |
13 |
1 |
|
February,
2000 |
26 |
36 |
21 |
17 |
* |
|
January,
2000 |
19 |
34 |
28 |
18 |
1 |
|
|
|
|
|
|
|
|
April,
1996 |
23 |
35 |
25 |
17 |
* |
|
March,
1996 |
26 |
41 |
20 |
13 |
* |
|
January,
1996 |
10 |
34 |
31 |
24 |
1 |
|
|
|
|
|
|
|
|
May,
1992 |
32 |
44 |
16 |
8 |
* |
|
March,
1992 |
35 |
40 |
16 |
9 |
* |
|
January,
1992 |
11 |
25 |
36 |
27 |
1 |
|
|
|
|
|
|
|
|
May,
1988 |
22 |
46 |
23 |
6 |
3 |
|
November,
1987 |
15 |
28 |
35 |
21 |
1 |
c. The Sept 11 Commission's hearings on the
2001 terrorist attacks
|
|
26 |
36 |
21 |
16 |
1 |
|
Early
April, 2004 |
29 |
34 |
20 |
16 |
1 |
d. The high price of gasoline these
days
|
|
46 |
30 |
15 |
8 |
1 |
|
Early
April, 2004 |
58 |
23 |
10 |
8 |
1 |
|
Mid-March,
2004 |
47 |
27 |
14 |
10 |
2 |
|
September,
2003 |
45 |
27 |
15 |
11 |
1 |
|
March,
2003 |
52 |
27 |
11 |
9 |
1 |
|
February,
2003 |
53 |
25 |
12 |
9 |
1 |
|
June,
2001 |
56 |
31 |
7 |
5 |
1 |
|
May,
2001 |
61 |
26 |
6 |
6 |
1 |
|
Early
October, 2000 |
56 |
25 |
12 |
6 |
1 |
|
June,
2000 |
61 |
25 |
9 |
5 |
* |
|
March,
2000 |
58 |
28 |
10 |
4 |
* |
|
October,
1990 |
62 |
26 |
8 |
4 |
* |
|
September,
1990 |
56 |
28 |
11 |
5 |
* |
|
August,
1990 |
57 |
27 |
10 |
5 |
1 |
e. The issue of gay and lesbian marriage
|
|
20 |
27 |
25 |
27 |
1 |
|
Mid-March,
2004 |
29 |
33 |
20 |
17 |
1 |
|
Early
February, 2004 |
26 |
32 |
22 |
19 |
1 |
|
Mid-August,
2003 |
19 |
30 |
22 |
28 |
1 |
[INTERVIEWER
NOTE: FOR QUESTIONS 7 thru 13 PLEASE DETERMINE WHAT DAY OF THE WEEK IT IS. IF THE DAY OF THE WEEK IS SUNDAY, PLEASE READ
"FRIDAY." IF THE DAY OF THE WEEK IS NOT SUNDAY, READ
"YESTERDAY."]
Q.7 Now, on another subject... Did you get a
chance to read a daily newspaper yesterday, or not?
FORM
1 ONLY:
IF
"YES" (Q.7=1) ASK:
Q.8F1 About how much time did you spend reading a
daily newspaper yesterday? [DO NOT READ]
|
|
|
Nov |
Apr |
Apr |
Late
Sept |
Nov |
Apr |
Nov |
Apr |
Jun |
Mar |
Feb |
Jan |
Mar |
Gallup |
|
Total |
Form
1 |
'02 |
'02 |
'00 |
'99 |
'98 |
'98 |
'97 |
'96 |
'95 |
'95 |
'94 |
'94 |
'91 |
'65 |
|
42 |
Read
the paper |
39 |
41 |
47 |
47 |
47 |
48 |
50 |
50 |
52 |
45 |
58 |
49 |
56 |
71 |
|
5 |
Less
than 15 min. -- |
7 |
9 |
9 |
8 |
8 |
8 |
7 |
7 |
9 |
7 |
7 |
n/a |
n/a |
|
|
11 |
15-29
min. |
-- |
10 |
14 |
12 |
11 |
14 |
14 |
15 |
15 |
14 |
15 |
15 |
n/a |
n/a |
|
17 |
30-59
min. |
-- |
15 |
16 |
16 |
16 |
17 |
17 |
18 |
18 |
16 |
21 |
17 |
n/a |
n/a |
|
9 |
1
hour or more |
-- |
8 |
8 |
10 |
11 |
9 |
10 |
10 |
11 |
6 |
14 |
10 |
n/a |
n/a |
|
* |
Don't
know |
-- |
1 |
* |
* |
1 |
* |
1 |
* |
1 |
0 |
1 |
* |
n/a |
n/a |
|
58 |
Didn't
read paper |
61 |
59 |
53 |
53 |
53 |
52 |
50 |
50 |
48 |
55 |
42 |
50 |
44 |
29 |
|
* |
Don't
know |
* |
* |
* |
* |
* |
* |
0 |
* |
* |
* |
0 |
1 |
* |
0 |
|
100 |
100 |
100 |
100 |
100 |
100 |
100 |
100 |
100 |
100 |
100 |
100 |
100 |
100 |
100 |
100 |
ASK
ALL:
Q.9 Did you watch THE NEWS OR A NEWS PROGRAM
on television yesterday, or not?
FORM
1 ONLY:
IF
"YES" (Q.9=1) ASK:
Q.10F1
About how much time did you spend watching the news or any news programs on TV
yesterday? [DO NOT READ]
|
|
|
Nov |
Apr |
Apr |
Late
Sept |
Nov |
Apr |
Nov |
Apr |
Jun |
Mar |
Feb |
Jan |
Mar |
Gallup |
|
|
Form-1 |
'02 |
'02 |
'00 |
'99 |
'98 |
'98 |
'97 |
'96 |
'95 |
'95 |
'94 |
'94 |
'91 |
'65 |
|
60 |
Watched
TV News |
61 |
54 |
56 |
62 |
65 |
59 |
68 |
59 |
64 |
61 |
74 |
72 |
68 |
55 |
|
3 |
Less
than 15 min. |
-- |
3 |
4 |
6 |
5 |
3 |
4 |
3 |
3 |
4 |
3 |
3 |
n/a |
n/a |
|
6 |
15-29
min. |
-- |
6 |
8 |
7 |
8 |
7 |
11 |
6 |
8 |
9 |
8 |
8 |
n/a |
n/a |
|
20 |
30-59
min. |
-- |
19 |
20 |
21 |
21 |
21 |
23 |
21 |
24 |
21 |
25 |
25 |
n/a |
n/a |
|
31 |
1
hour or more |
-- |
26 |
23 |
28 |
30 |
28 |
30 |
29 |
28 |
27 |
37 |
36 |
n/a |
n/a |
|
* |
Don't
know |
-- |
* |
1 |
* |
1 |
* |
* |
* |
1 |
* |
1 |
* |
n/a |
n/a |
|
40 |
Did
not watch |
39 |
46 |
44 |
37 |
35 |
41 |
31 |
40 |
35 |
38 |
26 |
27 |
32 |
45 |
|
* |
Don't
know |
* |
* |
* |
1 |
* |
* |
1 |
1 |
1 |
1 |
0 |
1 |
* |
0 |
|
100 |
Total |
100 |
100 |
100 |
100 |
100 |
100 |
100 |
100 |
100 |
100 |
100 |
100 |
100 |
100 |
ASK
ALL:
Q.11 Apart from news, did you watch anything
else on television yesterday, or not?
FORM
1 ONLY:
IF
"YES" (Q.11=1) ASK:
Q.12F1
About how much time did you spend watching TV yesterday, not including the
news?
[DO NOT READ]
Late
April Apr* Sept Nov June
Feb
Total
Form 1 2002 2000 1999 1997 1995 1994
63
63 Yes
58 57 63
64 59 69
1 A half hour or less 2 3
1 2 1
2
5 Thirty minutes or less than one
hour 3 5
6 5 4
3
12 About an hour or more 11 10
13 15 10
11
6 More than one hour but less than
two hours 5 8
6 7 6
7
19 Two hours to less than three
hours 17 15
18 16 16
19
8 Three hours to less than four
hours 8 7
9 11 10
12
11 Four hours or more 12 8
10 8 11 14
1 Don't know/Refused * *
* * 1
1
36
36 Did not watch 41 42
37 36 40
31
1
1 Don't know 1 1
0 * 1 0
100
100
100 100 100
100 100 100
* April 2000 is from a survey conducted for the
Pew Internet & American Life Project
(March 1 - May 1, 2000; N=6,036).
ASK
ALL:
Q.13 About how much time, if any, did you spend
listening to any news on the radio
yesterday, or didn't you happen to
listen to the news on the radio yesterday?
[DO NOT READ]
Late
Apr Apr Sep Nov Apr Nov Apr
Jun Mar Feb Jan Jun Mar Mar Feb Jan Gallup
'02 '00 '99 '98 '98 '97 '96
'95 '95 '94 '94 '92 '91 '90 '90 '90 '65
40 Yes, listened 41
43 44 41
49 44 44
42 47 47
47 47 54
52 55 51 58
8 <15 min. 10
14 12 13
16 12 12
13 16 14
15 15 23
22 24 21 n/a
7 15-29 min. 7
9 8 8
9 9 11
9 12 11
10 11 9
11 11 12 n/a
10 30-59 min. 10
9 10 8
10 9 10
9 9 9
10 10 8
10 9 9 n/a
15 1 hour + 14
11 14 12
14 14 11
11 10 13
12 11 14
9 11 9 n/a
59 Didn't Listen 58
56 56 57
51 55 55
56 52 52
52 52 46
47 44 48 42
1 Don't know 1
1 * 2
* 1 1
2 1 1
1 1 *
1 1 1 0
100 100 100 100 100 100 100 100 100
100 100 100 100 100 100 100 100 100
[INTERVIEWER:
IF THE DAY OF THE WEEK IS SUNDAY, BEGIN THIS SERIES WITH "Now, thinking
about
yesterday..." OTHERWISE BEGIN WITH "Again, thinking about
yesterday..."]
Q.14 Did you spend any time reading magazines?
FORM
1 ONLY:
IF
"YES" (Q.14=1) ASK:
Q.15F1
About how much time did you spend reading magazines yesterday? [DO NOT READ]
Late
April April
Sept April Nov
June Feb
Total Form 1 2002 2000
1999 1998 1997
1995 1994
25
Yes
23 26 28
29 32 31
33
2 <15 minutes 3 4
4 4 6
4 5
7 15 to less 30 minutes 5
6 8 7
8 8 9
9 30 minutes to <1 hour 9
8 9 10
9 11 10
7 One hour or more 6 8
7 8 9
8 9
* Don't know/Refused *
* *
* * *
*
75
No
77 74 72
71 68 69
67
*
Don't know
* * *
* * *
0
100 100 100
100 100 100
100 100
FORM
1 ONLY:
Q.16F1
Not including school or work related books, did you spend any time reading a
book
yesterday? [IF YES ASK: Was it a work of fiction or
non-fiction?]
IF
"YES" (Q.16=1,2,3,5) ASK:
Q.17F1
About how much time did you spend reading books yesterday? [DO NOT READ]
Late
April Sept Nov
June Feb
2002 1999 1997
1995 1994
35
Yes 34 35
35 30 31
SUBJECT
15 Fiction 13 16
16 14 14
18 Non-fiction 19 16
17 14 17
1 Both 1 2
1 1 *
1 Don't know 1 1
1 1 0
TIME
1 <15 minutes 1 3
2 1 2
4 15 to less than 30 minutes 5
6 5 4
3
10 30 minutes to <1 hour 10
9 10 8
9
20 One hour or more 18 17
17 17 17
0 Don't know * *
1 0 0
65
No
66 65 65
70 69
* Don't know/Refused 0 0
* * *
100 100 100
100 100 100
ASK
ALL:
Q.18 Did you get any news ONLINE through the
Internet yesterday, or not?
FORM
1 ONLY:
IF
"YES" (Q.18=1) ASK:
Q.19F1
About how much time did you spend reading news online yesterday? [DO NOT READ]
Total Form 1
23 Yes
2
Less than five minutes
3
Five to less than ten minutes
4
Ten to less than 15 minutes
4
15 to less than 20 minutes
3
20 to less than 30 minutes
5
30 minutes to less than one hour
2
One hour or more
*
Don't know/Refused
77 No
* Don't know/Refused
100
ASK
FORM 1 ONLY:
Q.20F1 As I read from a list tell me if you did
this yesterday or not. Yesterday did
you... [INSERT ITEM, ROTATE]? (Yesterday, did you [NEXT ITEM]?) [DO NOT ASK
ITEM c
IF DAY OF WEEK IS SUNDAY OR MONDAY]
Doesn't DK/
Yes No Apply NA
a.F1 Get some kind of vigorous exercise such as
jogging,
working out at a gym, or playing a
racquet sport 38 61
1 *
April, 2002 39 60
-- 1
April, 1998 36 64
-- 0
June, 1997
37 63 --
*
February, 1994 26 74
-- *
b.F1 Go online from home 38 59
3 *
April, 2002 34 63
-- 3
April, 1998 17 82
-- 1
c.F1 Go online from work 20 75
5 * (N=1194)
April, 2002 20 75
5 *
April, 1998 12 85
3 *
WENT ONLINE YESTERDAY (NET)* 47 53
April, 2002 43 57
April, 1998 25 75
June, 1995
4 96
*
The net figure represents the percent who went online yesterday either from
work or from home.
Based on Tuesday through Saturday interviews
only.
d.F1 Have a family meal together 65 33
2 0
April, 2002 63 36
-- 1
April, 1998 67 32
-- 1
February, 1994 64 36
-- *
e.F1 Go shopping for something other than food or
medicine 28 72 0 *
April, 2002 27 73
-- *
June, 1997
30 70 -- *
February, 1994 23
77 -- *
f.F1 Pray
66 34 0 *
April, 2002 66 34
-- *
February, 1994 56 44
-- *
g.F1 Watch a movie at home on video, DVD or
pay-per-view 24 76
* *
April, 2002 23 77
-- *
h.F1 Call a friend or relative just to talk 66 34
0 *
April, 2002 63 37
-- *
November, 1998 52 48
-- *
April, 1998 67 33
-- *
June, 1997
65 35 -- *
June, 1995
56 44 --
*
February, 1994 63 37
-- *
i.F1 Send an e-mail to a friend or relative 28 70
2 *
April, 2002 27 72
-- 1
j.F1 Play a game on your computer or a video game
console 17 81
2 0
ASK
ALL:
Q.21 How much do you enjoy reading A lot, some, not much, or not at all?
June Feb
1995 1994
53 A lot 53 53
31 Some 32 32
10 Not much 10 10
5 Not at all 4 4
1 Don't know/Refused (VOL) 1 1
100 100 100
Q.22
Now I'd like to know how often you watch or listen to certain TV and radio
programs.
For each that I read, tell me if you watch
or listen to it regularly, sometimes, hardly
ever, or never. (First) how often do you ... [READ AND ROTATE ITEMS a. THRU v.]
Hardly Don't
ASK
FORM 1 ONLY: Regularly
Sometimes Ever Never
Know
a.F1 Watch the national nightly network news on
CBS,
ABC or NBC? This is different from local
news
shows about the area where you live 34 28
16 22 *
April, 2002 32 29 15
24 *
April, 2000 30 28 16
25 1
August, 1999 40 33 16
11 *
April, 1998 38 29 15
18 *
February, 1997 41 31 14
14 *
April, 1996 42 29 15
14 *
March, 1995 48 28 14
10 *
May, 1993 60 28 5
6 1
February, 1993 58 23 10
9 *
b.F1 Watch cable news channels such as CNN,
MSNBC, or the Fox News CABLE Channel 38 33 10
19 *
April, 2002 33 35 11
21 *
NO
ITEM c.
ASK
FORM 2 ONLY:
d.F2 Watch the CBS Evening News with Dan
Rather 16 30 16
38 *
April, 2002 18 29 18
35 *
e.F2 Watch the ABC World News Tonight
with Peter Jennings 16 31 16
36 1
April, 2002 18 30 19
33 *
f.F2 Watch the NBC Nightly News
with Tom Brokaw 17 31 17
35 *
April, 2002 20 29 18
33 *
g.F2 Watch Cable News Network (CNN) 22 33
12 32 1
April, 2002 25 31 12
32 *
April, 2000 21 34 16
29 *
April, 1998 23 34 13
30 *
February, 1997 28 30 14
28 0
April, 1996 26 33 14
27 *
March, 1995 30 28 13
28 1
July, 1994 33 36 7
24 *
February, 1994 31 32 8
29 *
May, 1993 35 34 7
24 *
June, 1992 30 32 10
27 1
July, 1990 27 28 8
36 1
June, 1990 30 27 6
37 *
May, 1990 27 25 7
40 1
April, 1990 26 29 7
37 1
March, 1990 22 28 8
41 1
February, 1990 23 29 8
40 0
January, 1990 26
25 7 41
1
h.F2 Watch the Fox News CABLE Channel 25 29 11
34 1
April, 2002 22 26 15
37 *
April, 2000 17 28 17
37 1
April, 1998 17 30 14
38 1
i.F2 Watch MSNBC 11 31 16
39 3
April, 2002 15 30 16
37 2
April, 2000 11 27 17
42 3
April, 1998 8 23 15
51 3
j.F2 Watch CNBC
10 31 17
40 2
April, 2002 13 30 17
38 2
April, 2000 13 29
18 37
3
April, 1998 12 27 17
42 2
ASK
ALL:
k.
Watch the local news about your viewing area
which usually comes on before the national
news
in the evening and again later at night 59 23 8
10 *
April, 2002 57 24 8
11 *
April, 2000 56 24 9
11 *
April, 1998 64 22 6
8 *
February, 1997 72 16 7
5 0
April, 1996 65 23 7
5 *
March, 1995 72 18 6
4 *
May, 1993 77 16 5
4 *
February, 1993 76 16
5 3
*
l.
Watch C-SPAN
5 18 17
59 1
April, 2002 5 18 18
57 2
April, 2000 4
17 22 56
1
April, 1998 4 19 18
58 1
April, 1996 6 21 18
53 2
March, 1995 8 17 20
53 2
July, 1994 9 26 12
52 1
February, 1994 7 20 15
56 2
May, 1993 11 25 13
48 3
February, 1993 7 18 14
45 16
June, 1992 6 19 18
54 3
m.
Listen to National Public Radio (NPR) 16 19 15
49 1
April, 2002 16 16 15
52 1
April, 2000 15 17 16
51 1
April, 1998 15 17 18
49 1
April, 1996 13 18 16
52 1
March, 1995 15 17
21 46 1
July, 1994 9 18 11
62 *
February, 1994 9 13 12
65 1
May, 1993 15 20 15
49 1
June, 1992 7 16 17
59 1
July, 1990 9 13 8
70 *
June, 1990 9 10 11
69 1
May, 1990 7 11 10
72 *
April, 1990 7 12 9
71 1
March, 1990 7 9 10
74 *
February, 1990 8 10 8
74 *
January, 1990 5 10 7
78 *
n.
Watch news magazine shows such
as 60 Minutes, 20/20 or Dateline 22 42 16
20 *
April, 2002 24 42 16
18 *
April, 2000 31 41 15
13 *
August, 1999 35 40 16
9 *
April, 1998 37 41 12
10 *
April, 1996 36 38 15
11 *
July, 1994 43 43 8
6 *
February, 1994 45 36 11
8 0
May, 1993 52 37 6
5 *
February, 1993 49 32 11
8 *
June, 1992 46 40
8 6
*
July, 1990 46 38 8
8 *
June, 1990 50 36 6
8 *
May, 1990 45
37 8 10
*
April, 1990 47 37 7
9 *
March, 1990 41 42 7
10 *
February, 1990 39 41 10
10 0
January, 1990 43 40 8
9 *
o.
Watch the NewsHour with Jim Lehrer 5 15 14
65 1
April, 2002 5 13 15
66 1
April, 2000 5 12 15
66 2
April, 1998 4 14 14
67 1
April, 1996 4 10 11
73 2
July, 1994 7 23 11
58 1
February, 1994 6 16 11
66 1
May, 1993 10 24 14
51 1
June, 1992 6 19 17
56 2
July, 1990 7 16
11 66 *
Know
June, 1990 7 16 12
64 1
May, 1990 8 15 11
65 1
April, 1990 6 16 11
66 1
March, 1990 5 19 12
63 1
February, 1990 5 15 11
69 0
January, 1990 6 15 12
67 *
p.
Watch the Weather Channel 31 30 15
24 *
April, 2002 32 28 15
25 *
April, 2000 32 28 15
25 *
April, 1998 33 27 13
27 *
q.
Watch Sports News on ESPN 20 20 11
49 *
April, 2002 19 19 12
50 *
April, 2000 23 18 13
46 *
April, 1998 20
20 15 45
*
r.
Watch late night TV shows such as
David Letterman and Jay Leno 12 23 19
46 *
April, 2002 12 22 18
48 *
s.
Watch TV shows such as Entertainment
Tonight or Access Hollywood 10 26 18
46 *
April, 2002 9 24 19
48 *
April, 2000 8 26 22
44 *
April, 1998 8 27 24
41 *
February, 1997 9 29 23
39 *
June, 1992 11 30 24
35 *
April, 1990 14 30 17
39 *
March, 1990 15 31 15
39 *
February, 1990 11 31 16
42 0
January, 1990 11 34 16
39 0
t.
Watch the Today Show, Good Morning
America or The Early Show 22 21 14
43 *
April, 2002 22 19 14
45 *
April, 2000 20 18 15
47 *
April, 1998 23 19 17
41 *
u.
Watch Univision or some other Spanish-
language television network 3 6 6
85 *
April, 2002 4 5 6
85 *
April, 2000 3 4 7
86 *
v.
Watch Sunday morning news shows such as
Meet the Press, This Week or Face the
Nation 12 20
15 53
*
May, 1993 18 32 15
35 *
June, 1992 15 25 21
39 *
July, 1990 13
24 14 49
*
June, 1990 15 26 12
47 *
May, 1990 13 21 16
50 *
April, 1990 14 22 12
52 *
March, 1990 10 24 16
50 *
February, 1990 12 22 13
53 *
January, 1990 11 24 14
51 *
ASK
FORM 1 ONLY:
Q.23F1
Now I'd like to ask you about some other television and radio programs. For each that
I read, tell me if you watch or listen
to it regularly, sometimes, hardly ever, or
never.
(First) how often do you ... [READ AND ROTATE]
Hardly Don't
Regularly Sometimes Ever Never
Know
a.F1 Watch Larry King Live 5 22 17
56 *
April, 2002 5 22 15
58 *
April, 1998 4
20 15 61
*
b.F1 Listen to Don Imus' radio show 1 4 6
88 1
April, 2002 2 4 5
88 1
April, 1998 1 3 6
89 1
c.F1 Listen to Rush Limbaugh's radio show 6 10 10
74 *
April, 2002 4 10 9
77 *
April, 1998 5 11 11
73 *
June, 1997 5 11 12
71 1
April, 1996 7 11 11
70 1
July, 1994 6 20 13
61 *
d.F1 Listen to religious radio shows such
as "Focus on the Family" 11 15 10
64 *
April, 2002 8 16 9
67 *
April, 1998 10 16 11
63 *
June, 1997 11 17 15
57 *
April, 1996 11 14 13
62 *
e.F1 Watch "The O'Reilly Factor"with
Bill O'Reilly 8 18 11
63 *
April, 2002 6 14 10
70 *
f.F1 Watch "The Daily Show" with Jon
Stewart 3 12 10
75 *
April, 2002 2 10 8
79 1
ASK
ALL:
Q.24 Now I'd like to know how often you read
certain types of publications. As I read
each,
tell me if you read them regularly,
sometimes, hardly ever or never.
(First,) how
often do you read... [READ AND RANDOMIZE
ITEMS a THRU f FOLLOWED BY ITEMS g AND h IN
ORDER, FOLLOWED BY RANDOMIZED ITEMS i
THRU m] How about...
Hardly Don't
Regularly Sometimes Ever Never
Know
a.
News magazines such as Time, U.S.
News, or Newsweek 13 34 18
35 *
April, 2002 13 35 18
34 *
April, 2000 12 34
19 35
*
April, 1998 15 36 17
32 *
April, 1996 15 35 20
30 *
July, 1994 18
41 18 23
*
February, 1994 16 31 23
30 *
May, 1993 24 39 14
23 *
June, 1992 20 39 18
23 *
July, 1990 18 34 18
30 *
June, 1990 21 39 16
24 *
May, 1990 17 34 19
30 *
April, 1990 20 35 16
29 *
March, 1990 16 35 19
30 *
February, 1990 17 36 18
29 0
January, 1990 18 34 17
31 0
b.
Business magazines such as Fortune and Forbes 4 16 14
66 *
April, 2002 4 16 14
66 *
April, 2000 5 15 15
65 *
April, 1998 5 16
15 64 *
April, 1996 5 17 16
62 *
July, 1994 5 21 21
53 0
February, 1994 6 15 17
62 *
June, 1992 5 17 21
57 *
July, 1990 5 15 14
66 *
June, 1990 6 16 16
62 *
May, 1990 4 14 15
67 *
April, 1990 5 15 14
66 *
March, 1990 5 14 14
67 0
February, 1990 4 12 14
70 *
January, 1990 5 13 14
68 0
c.
The National Enquirer, The Sun or The Star 3 11 9
77 *
April, 2002 3 9 10
78 *
April, 2000 3 9
12 76 *
April, 1998 3 12 9
76 *
February, 1997 5 6 12
77 0
April, 1996 5 11 12
72 *
July, 1994 5 13 16
66 *
June, 1992 5 13 14
68 *
March, 1990 5 15 13
67 *
February, 1990 7 13 13
67 *
January, 1990 7 12 13
68 0
d.
Personality magazines such as People 7 25 17
51 *
April, 2002 6 26 18
50 *
April, 2000 6 27 18
49 *
April, 1998 8 29 18
45 0
February, 1994 9 22 22
47 *
May, 1993 12 25
19 44
*
June, 1992 8 28 25
39 *
July, 1990 9 25 18
48 *
June, 1990 10
28 19 43
*
May, 1990 7 24 19
50 *
April, 1990 9 25 20
46 *
March, 1990 8 25 20
47 *
February, 1990 8 24 19
49 *
January, 1990 9 23 19
49 0
e.
Magazines such as The Atlantic,
Harpers or The New Yorker 2 8 11
79 *
April, 2002 2 7 11
80 *
April, 2000 2
7 11 80
*
April, 1998 2 8 11
79 0
February, 1994 2 6 14
78 *
June, 1992 2 9 16
73 *
July, 1990 2 8 11
79 *
June, 1990 2 8 13
77 *
May, 1990 2 7 12
79 *
April, 1990 2 6 12
80 *
March, 1990 2 7 13
78 0
February, 1990 2 7 10
81 *
January, 1990 2 7 11
80 0
f.
Political magazines such as The Weekly Standard
or The New Republic 2 7 9
82 *
April, 2002 2 6 9
83 *
g. A
daily newspaper 54 25 8
13 *
August, 1999 52 28 13
7 *
February, 1997 56 24 9
11 *
May, 1993 66 19 7
8 *
February, 1992 71 19 5
4 1
h.
Local weekly community newspapers 36 26 11
26 1
i.
The news pages of Internet service providers such
as AOL News or Yahoo News 13 17 8
62 *
j.
Network TV news websites such as CNN.com,
ABCnews.com, or MSNBC.com 10 19 10
61 *
k.
The websites of major national newspapers such
as the USA Today.com, New York Times.com,
or the Wall Street Journal online 6 13 9
71 1
l.
The websites of your local newspaper or TV stations 9
19 11 61
*
m.
Other kinds of online news magazine and opinion sites
such as Slate.com or the National Review
online 3 7 6
84 *
==============================
Questionnaire Part 2
Q.25 On another subject... Thinking about a
typical weekday, do you normally start your morning with some type of news, or
not?
April
2002 April 1998
71 Yes 68 67
29 No 32 33
* Don't know/Refused * *
100 100 100
Q.26
On weekdays, do you typically read, watch, or listen to the news DURING THE
COURSE OF THE DAY, or not?
April 2002 April 1998
73 Yes 61 74
27 No 39 26
* Don't know/Refused * *
100 100 100
Q.27
On weekdays, do you typically read, watch or listen to the news AROUND THE
DINNER HOUR, or not?
April
2002 April 1998
60 Yes 55 63
40 No
45 37
* Don't know/Refused * *
100 100 100
Q.28
On weekdays, do you typically read, watch or listen to the news LATE IN THE
EVENING, or not?
April
2002 April 1998
63 Yes 60 61
37 No 40 39
* Don't know/Refused * *
100 100 100
NO
QUESTIONS 29 THRU 33
ASK
ALL:
Just
in general
Q.34
How much do you enjoy keeping up with the news
a lot, some, not much, or not at all?
May April
April April June
Feb
2002 2002
2000 1998 1995
1994
52 A lot 52 48
45 50 54
53
37 Some 37 36
40 37 34
35
7 Not Much 7 11
12 11 8 9
3 Not at all 3 4 3 2 3 2
1 Don't know/Refused 1 1 * * 1 1
100 100 100
100 100 100
100
Q.35
How often, if ever, do you listen to radio shows that invite listeners to call
in to discuss current events, public issues and politics regularly, sometimes, rarely or never?
Regularly Sometimes
Rarely Never DK/Ref
April, 2004 17 23 22 38 *
April, 2002 17 20 22 41 *
April, 2000 14 23 23 40 *
August, 1999 18 23 24 35 *
Early September, 1998 23 25 23 29 *
April, 1998 13 22 24 41 *
October, 1997 18 28 25 29 *
August, 1997 17 24 28 31 *
Early September, 1996 15
25 22 37 1
July, 1996 16 24 27 33 *
June, 1996 17 25 26 31 1
April, 1996 13 23
25 39 *
March, 1996 18 28 24 30 *
October, 1995 18 33 25 24 *
June, 1995 15 19 27
39 *
April, 1995 19 30 24 27 *
November, 1994 16 31 26 26 1
July, 1994 17 29 24 30 *
December, 1993 23 22 25 30 0
April, 1993 23 32 23 22 *
Q.36 Some people say they feel overloaded with
information these days, considering all the TV news shows, magazines,
newspapers, and computer information services.
Others say they like having so much information to choose from. How about you... do you feel overloaded, or
do you like having so much information available?
April April
Nov April June
2002 2000
1998 1998 1995
28 Overloaded 26 30 28
28 23
64 Like it 66 62
62 67 64
5 Other (VOL) 6 5 6 2 11
3 Don't know/Refused 2 3 4 3 2
100 100 100
100 100 100
Q.37
Do you use a computer at your workplace, at school, at home, or anywhere else
on at least an occasional basis?
Q.38
Do you ever go online to access the Internet or World Wide Web or to send and
receive email?
Based on Total Respondents:
Computer User Goes Online
Yes No
DK/Ref Yes No
DK/Ref
April,
2004 73 27
0 66 34
*
March,
2004* 75 25
* 68 32
*
August,
2003 77 23
* 67 33
*
Mid-July,
2003 75 25
* 65
35 *
January,
2003 76 24
0 67 33
*
December,
2002 76 24
* 67 33
*
Early
October, 2002 75 25
* 63 37
*
August,
2002 78 22
* 69 31
*
June,
2002 74 26
* 66 34
*
May,
2002 75 25
* 66 34
*
April,
2002 71 29
* 62 38
0
February,
2002 71 29
* 62 38
0
January,
2002 73 27
0 62 38
0
Mid-November,
2001 73
27 0 62 38
0
Mid-September,
2001 72 28
* 62 38
*
June,
2001 72 28
* 62 38
0
May,
2001 75 25
* 64 36
0
April,
2001 72 28
* 62 38
0
February,
2001 72 28
0 60 40
*
January,
2001 71 29
* 61
39 0
July,
2000 68 31
1 55 45
*
June,
2000 68 31
1 56 44
*
April,
2000 68 32
* 54 46
*
March,
2000 72 28
0 61 39
0
February,
2000 67 33
* 52 48
0
January,
2000 68 32
* 52 48
*
December,
1999 67 33
* 53 47
0
October,
1999 67 33
* 50 50
0
Late
September, 1999 68 32
* 52 48
*
September,
1999 70
30 * 53 47
0
August,
1999 67 33
* 52 48
0
July,
1999 68 32
* 49 51
0
June,
1999 64 35
1 50 50
*
May,
1999 66 33
1 48 52
0
April,
1999 71 29
* 51 49
*
March,
1999 68 32
* 49
51 *
February,
1999 68 32
* 49 51
*
January,
1999 69 31
* 47 53
*
Early
December, 1998 64 36
* 42 58
0
November,
1998 -- -- -- 37 63
*
Early
September, 1998 64 36
* 42 58
*
Late
August, 1998 66 34
0 43 57
*
Early
August, 1998 66 34
* 41 59
*
April,
1998 61 39
* 36 64
0
January,
1998 65 35
* 37 63
0
November,
1997 66
34 * 36 63
1
June,
1997 60 40
0 29 71
0
Early
September, 1996 56 44
* 22 78
0
July,
1996 56 44
* 23 77
0
April,
1996 58 42
* 21 79
*
March,
1996 61 39
* 22 78
0
February,
1996 60 40
0 21 79
*
January,
1996 59 41
0 21 79
0
June,
1995 -- -- -- 14 86
*
*
Beginning in 2004, the online use question is asked of all respondents (in
previous years it was asked only of those who identified themselves as computer
users). This modification was made to
adjust to changes in technology and means of access to the Internet, and
increases the percent who are classified as Internet users by 1-2 percentage
points.
IF
"YES" (Q.38=1) ASK:
Q.39
How frequently do you go online to get NEWS... would you say every day, 3 to 5
days per
week, 1 or 2 days per week, once every few
weeks, or less often?
Early Early
April April Oct
Aug July June
Dec Nov Sept April
June
2002 2000
1999 1999 1999
1999 1998 1998
1998 1998 1995
27 Everyday 25
27 25 22
21 22 25
10 23 18
6
18 3-5 days per week 16
15 14 15
15 18 17
11 16 17
9
15 1-2 days per week 16
19 22 19
22 22 22
16 21 20
15
12 Once every few weeks 13
12 11 15
14 14 10
13 14 15
13
17 Less often 21 18
20 20 19
18 18 20
19 21 28
11 No/Never (VOL.) 9
9 8 9
9 7 8
30 7 9
29
* Don't know/Refused *
* * *
0 0 *
* * *
*
100 100 100
100 100 100
100 100 100
100 100 100
NO
QUESTION 40
ASK
ALL:
Next
I would like to ask you about some things that have been in the news. Not everyone will have heard about them [ROTATE Q.41 THRU Q.44]
Q.41 Do you happen to know which political party
has a majority in the U.S. House of Representatives?
June Aug
Dec June
April June
2001 1999
1998 1997 1996
1995
56 Republican (Correct) 31
55 56 50
70 73
8 Democratic 34 8
11 6 8
5
36 Don't know/Refused 35 37
33 44 22
22
100 100 100
100 100 100
100
Q.42
Do you know the name of the terrorist organization that is responsible for the
September 11th attacks on the United States? [DO NOT READ]
66 Al Qaeda (Correct)
5 Mentions of Osama bin Laden
5 Other name or reference
24 No, Don't know
100
Q.43
In the recent trial involving Martha Stewart, can you recall whether [READ AND
RANDOMIZE]?
79 She was found guilty (Correct)
1 She was found innocent [OR]
4 There was a mistrial
16 No, Don't know (VOL. DO NOT READ)
100
Q.44
Since the start of military action in Iraq last March, about how many U.S.
soldiers have been killed? To the best of your knowledge, has it been under
500, 500 to 1000, 1000 to 2000, or more than 2000?
[INTERVIEWER:
IF RESPONDENT GIVES A SPECIFIC NUMBER, ENTER IN THE APPROPRIATE RANGE WITHOUT
PROMPTING. IF RESPONDENT SAYS
"500", "1,000" OR
"2,000", PROMPT "Would you say it is a little over or a
little under ____?]
28 Under 500
55 500 to 1,000 (Correct)
6 1,000 to 2,000
4 More than 2,000
7 Don't know/Refused
100
Q.45
Now, I'm going to read you a list of different types of news. Please tell me how closely you follow this
type of news either in the newspaper, on television, or on radio...very
closely, somewhat closely, not very closely, or not at all closely? First,
[READ AND ROTATE]
Very Somewhat Not Very
Not at all Don't
Closely Closely Closely
Closely Know
a. News about political figures and
events in Washington 24 45 17 14 *
April, 2002 21 45 19 15 *
April, 2000 17 43 23 17 *
April, 1998 19 46 22 13
*
April, 1996 16 43 28 13 *
b. Sports 25 27 17 31 *
April, 2002 25 28 18
29 *
April, 2000 27 25 19 29 *
April, 1998 27 28 18 27 *
April, 1996 26 28
21 25 *
c. Business and finance 14 37 24 25 *
April, 2002 15 35 25 25 *
April, 2000 14 36 27 23 *
April, 1998 17 36 24 23 *
April, 1996 13 37 31 19 *
d. International affairs 24 44 16 16 *
April, 2002 21 44 18 17 *
April, 2000 14 45 24 17 *
April, 1998 16 46 23 15 *
April, 1996 16 46 26 12 *
e. Local government 22 42 20 16 *
April, 2002 22 43 19 16 *
April, 2000 20 43 21 16 *
April, 1998 23 44 20 13 *
April, 1996 24 43 21 12 *
f. Religion 20 35 22 23 *
April, 2002 19 36
22 22 1
April, 2000 21 32 24 23 *
April, 1998 18 33 25 24 *
April, 1996 17
31 29 23 *
g. People and events in your
own community 28 45 16 11 *
April, 2002 31 44 14 11
*
April, 2000 26 47 17 10 *
April, 1998 34 45 14 7 *
April, 1996 35 44 14
7 *
h. Entertainment 15 42 25 18 *
April, 2002 14 42 25 19 *
April, 2000 15 41
28 16 *
April, 1998 16 43 27 14 *
April, 1996 15 42 29 14 *
i. Consumer news 13 46 21 19 1
April, 2002 12 41 25 22 *
April, 2000 12 45 24 18 1
April, 1998 15 46 22 17 *
April, 1996 14 45 26 15 *
j. Science and technology 16 42 21 21 *
April, 2002 17 40 21 22 *
April, 2000 18 45 20 17 *
April, 1998 22 41 19 18 *
April, 1996 20 42 24 14 *
k. Health news 26 46 14 13 1
April, 2002 26 45 16 13 *
April, 2000 29 45 15 11 *
April, 1998 34 46 12 8 *
April, 1996 34 44
14 7 1
l. Crime 32 45 14 8 1
April, 2002 30 46 14 9 1
April, 2000 30
45 16 9 *
April, 1998 36 44 13 7 *
April, 1996 41 43 10 6 *
m. Culture and the arts 10 33 27 29 1
April, 2002 9 31 28 32 *
April, 2000 10 32 28 29 1
April, 1998 12 33 29 26 *
April, 1996 9 34 32 25 *
n. The weather 53 34 8 5
*
ROTATE
SUBJECT OF QUESTIONS 46a THRU 46c, KEEPING QUESTION WORDING IN ORDER:*
Q.46a Which of the following two statements best
describes you: "I follow INTERNATIONAL news closely ONLY when something
important is happening" OR "I follow INTERNATIONAL news closely most
of the time, whether or not something important is happening"?
April April April
2002 2000 1998
Follow INTERNATIONAL news closely ONLY
when
47 something important is happening 61 64
63
52 Follow INTERNATIONAL news closely MOST
of the time 37 33
34
1 Don't know/Refused 2 3
3
100
100 100 100
* In
April 2002 and earlier the Q.46a-Q.46c series included the words “... something
important
or interesting is happening.” Also in
previous years, the questions were rotated and did not
include the transitions presented here.
Q.46b I'd like to ask the same question, but
about NATIONAL news Which best describes
you: "I follow NATIONAL news
closely ONLY when something important is happening"
OR "I follow NATIONAL news
closely most of the time, whether or not something
important is happening"?
April April April
2002 2000 1998
Follow NATIONAL news closely ONLY when
something
43 important is happening 45 50
46
55 Follow NATIONAL news closely MOST of
the time 53 48
52
2 Don't know/Refused 2 2
2
100
100 100 100
Q.46c And just once more about LOCAL COMMUNITY
news Which best describes you: "I follow
LOCAL COMMUNITY news closely ONLY
when something important is happening" OR
"I follow LOCAL COMMUNITY news
closely most of the time, whether or not something
important is happening"?
April April April
2002 2000 1998
Follow LOCAL COMMUNITY news closely
ONLY when
43 something important is happening 41 40 38
55 Follow LOCAL COMMUNITY news closely
MOST of the time 56 58 61
2 Don't know/Refused 3 2 1
100
100 100 100
On
another subject...
Q.47
Do you currently live in an area where you could get Cable TV if you wanted it?
April April
April April Feb
2002 2000
1998 1996 1994
91
Yes 92 91
91 92 89
8
No 8 9
9 8 10
1 Don't
know/Refused * *
* * 1
100 100 100
100 100 100
ASK
IF YES (1 IN Q.47):
Q.48
Do you currently subscribe to Cable TV?
BASED ON TOTAL RESPONDENTS: April April
April April Feb
2002 2000 1998
1996 1994
64
Yes
66 67 67
69 64
27
No
26 24 24
23 25
9
Don't know/Refused/No cable access 8 9
9 8 11
100
100 100 100
100 100
ASK
ALL:
Q.49
Do you currently subscribe to a satellite television service such as DirecTV or
the
Dish Network?
25
Yes
74
No
1
Don't know/Refused
100
TREND FOR COMPARISON:
Do you happen to have [READ; ROTATE],
or not? How about...
Yes No DK/Ref
A satellite dish
April, 2002 21 79 *
April, 2000 18 82 *
June, 1995 6 94
*
February, 1994 4 96 *
Q.50 Now I'm going to read a series of statements
about the news. For each statement,
please tell me if you completely agree
with it, mostly agree with it, mostly disagree
with it, or completely disagree with
it. The first one is... [READ AND
ROTATE]
(VOL)
Don't
Completely Mostly Mostly
Completely Watch DK/
Agree Agree Disagree
Disagree the news Ref
a. I
find that I often watch the
news with my remote control in
hand, flipping to other channels
when I'm not interested in the
topic 32 30 17
18 2 1
April, 2002 31 28 17 20 2
2
April, 2000 36 26 17
18 2 1
April, 1998 29 27 21
21 1 1
b.
People who decide what to put on
TV
news or in the newspapers are
out of touch with people like me 17
31 35 13 n/a
4
April, 2002 14 29 36
15 n/a 6
April, 2000 18
35 34 10 n/a
3
c. I
often don't have enough
background information to follow
news stories 10 32 38
18 n/a 2
d. I
am often too busy to keep up
with the news 12 24 35
27 n/a 2
e.
Watching and reading the news
often depresses me 15 29 31
23 n/a 2
f. I
often don't trust what news
organizations are saying 15 38 34
9 n/a 4
g. I
want the news to contain
information that is helpful in
my daily life 47 40 8
3 n/a 2
Q.51
Are you more the kind of person who watches or listens to the news at regular
times,
or are you more the kind of person who
checks in on the news from time to time?
April 2002
52 Watch/listen at regular times 49
46 Checks in from time to time 48
1 Neither [VOL] 2
1 Don't know/Refused 1
100 100
Q.52
For major news stories, what do you usually want in the news? Are you mostly
interested in the HEADLINES, do you want
the headlines PLUS some further reporting
on what happened, or do you want in-depth
analysis of the news by experts?
18 The headlines
37 Headlines plus some reporting on what
happened
40 In-depth analysis of the news by experts
5 Don't know/Refused
100
Q.53
Which comes closer to describing your view of the news media [READ AND ROTATE]
45 All the news media are pretty much the same
to me
OR
54 There are a few news sources I trust more
than others
2 [DO NOT READ] Don't know/Refused [VOL.]
100
Q.54
There are a lot of different ways the news is presented these days. Do you generally
LIKE it or DISLIKE it when a news source
[INSERT ITEM, RANDOMIZE], or doesn't it
matter to you?
Doesn't Don't Know/
Like Dislike Matter
Refused
a.
Is sometimes funny 46 6
47 1
b.
Includes ordinary Americans giving their views 49
7 43 1
c.
Has in depth interviews with political leaders
and policymakers 46 9
44 1
d.
Shares your point of view on politics and issues 36
5 58 1
e.
Presents debates between people with differing
points of view 55 6
38 1
f.
Stirs your emotions 29 12
56 3
g.
Makes the news enjoyable and entertaining 48
6 45 1
h.
Has reporters and anchors with pleasant
personalities 53 3
43 1
Q.55
What do you find gives you the best understanding of major news events? [READ
AND ROTATE]
40 Reading or hearing the facts about what
happened
OR
55 Seeing pictures and video showing what
happened
5 [DO NOT READ] Don't know/Refused [VOL.]
100
Q.56
Here are a couple of news stories from the past year. Did you happen to follow news
about [INSERT ITEM, ROTATE] very closely,
fairly closely, not too closely, or not
at all closely as it was developing?
Very Fairly Not too
Not at all
Closely Closely Closely
Closely DK/Ref
a. The
murder of Laci Peterson 20 37 24 17 2
July, 2003 22 34 26 17 1
May, 2003 31 31 21
16 1
b.
Basketball star Kobe Bryant being
accused of sexual assault 16 37 29 17 1
October, 2003 14 28 29 28 1
August, 2003 17 30 28 24 1
NO
QUESTIONS 57 THRU 69
IF
GOES ONLINE FOR NEWS ONCE A WEEK OR MORE (Q.39 = 1,2,3) ASK [N=1222]:
Earlier
you said you get some news from the Internet
Q.70
Since you started getting news online, are you using other sources of news MORE
often,
LESS often, or about the same as you used
to?
April April
Oct Nov April
June
2002 2000
1999 1998 1998
1995
9 Yes, more often 10 10
9 16 8
4
15 Yes, less often 12 18
17 11 11
12
4 Yes, some more, others less 5
14 6 10
5 8
71 No, about the same 73 58
68 63 76
76
1 Don't know/Refused * *
* * *
0
100 100 100
100 100 100
100
IF
"MORE OFTEN (Q.70=1) ASK [N=111]:
Q.71
Which sources are you using MORE often? [DO NOT READ LIST; ACCEPT MULTIPLE
RESPONSES.]
April April
April June
2002 2000
1998 1995
28
Newspapers 31 24 36 60
30
Television 31 38 47 58
6
Magazines 4 5 7 23
16
Radio 14 9 10 26
39 Other 33 30 22 13
3
Don't know/Refused 4 9 0 0
IF
"LESS OFTEN" OR "SOME MORE, SOME LESS" (Q.70=2,3) ASK
[N=239]:
Q.72
Which sources are you using LESS often? [DO NOT READ LIST; ACCEPT MULTIPLE
RESPONSES.]
April April
April June
2002 2000
1998 1995
39
Newspapers
42 35 43
43
47
Television
36 41 52
37
8
Magazines
16 11 13
14
13
Radio
18 15 17
28
5
Other
9 8 2
10
5 Don't know/Refused 4 9 4
3
IF
GOES ONLINE FOR NEWS (Q. 39=1-5) ASK [N=1806]:
Q.73
Do you sometimes get [INSERT ITEM] online, or not? [ROTATE ITEMS; READ FULL
STEM FOR
EACH ITEM]
BASED ON THOSE WHO GO ONLINE FOR NEWS:
Yes No DK
a. Political news 54 46
*
April, 2002 50 50
*
April, 2000 39 61
*
November, 1998 43 57
*
April, 1998 40 60
0
October, 1996 46 54
*
b. Sports news 45 55
*
April, 2002 47 53
*
April, 2000 42 58
*
November, 1998 47 53
0
April, 1998 39 61
0
October, 1996 46 54
0
c. International news 54 46
*
April, 2002 55 45
*
April, 2000 45 55
*
November, 1998 47 53
0
April, 1998 41 59
0
October, 1996 45 55
0
d. News about science
and health 58 42
*
April, 2002 60 40
*
April, 2000 63 37
*
April, 1998 64 36
0
October, 1996 58 42
0
e. News about technology 53
47 *
April, 2002 54 46
*
April, 2000 59 41
0
November, 1998 59 41
0
April, 1998 60 40
0
October, 1996 64 36
*
f. Weather 76 24
0
April, 2002 70 30
0
April, 2000 66 34
0
November, 1998 64 36
0
April, 1998 48 52
0
October, 1996 47 53
0
g. Entertainment news 46 54
*
April, 2002 44 56
*
April, 2000 44 56
*
November, 1998 58 42
*
April, 1998 45 55
0
October, 1996 50 50
*
h. Local news 45 55
*
April, 2002 42 58
0
April, 2000 37 63
0
November, 1998 42 58
0
April, 1998 28 72
0
October, 1996 27 73
0
ASK
FORM 1 ONLY:
i.F1 Business news 46 54
* (N=904)
April, 2002 48 52
0
April, 2000 53 47
*
November, 1998 58 42
0
October, 1996 53 47
*
ASK
FORM 2 ONLY:
j.F2 Business and
financial news 49 50
1 (N=902)
April, 2002 51 49
*
IF
GOES ONLINE FOR NEWS (Q.39 = 1-5) ASK [N=1806]:
Q.74
Do you use any news services that send you news updates either in your e-mail
or
directly to your computer screen?
26 Yes
74 No
* Don't know
100
IF
GOES ONLINE FOR NEWS (Q.39 = 1-5) ASK [N=1806]:
Q.75
Have you ever used search engines such as Google or Yahoo to search for news
stories
on a particular subject you are interested
in? [IF YES] How often do you do this,
every day, 3 to 5 days per week, 1 or 2
days per week, once every few weeks, or
less often?
7
Yes, Every day
12
Yes, 3-5 days per week
15
Yes, 1-2 days per week
18
Yes, Once every few weeks
18
Yes, Less often
30
No, Never done this
*
Don't know/Refused [VOL.]
100
IF
INTERNET USER (Q.38=1) ASK [N=2049]:
Q.76
When you go online do you ever come across news when you may have been going
online
for a purpose other than to get the news?
April Nov
Oct Nov April
Oct
2002 2000
1999 1998 1998
1996
73
Yes 65 45
55 48 54
53
27
No 35 53
44 51 45
45
* Don't know/Refused *
2 1 1
1 2
100 100 100
100 100 100
100
ASK
ALL:
Finally,
I'd like to ask you a few questions for statistical purposes only.
Q.77
Do you have any type of personal computer, including laptops, in your home?
April April
Nov June Feb
2002 2000
1998 1995 1994
73
Yes 65 59 43 36 31
27
No 35 41 57 64 69
0
Don't know/Refused * * * * 0
100 100 100
100 100 100
Q.78
Do you happen to have [INSERT ITEM, IN ORDER], or not? How about...
Yes No
DK/Ref
a. A
cell phone 68 32
*
April, 2002 64 36
*
April, 2000 53 47
*
June, 1995 24 76
*
b. A
Palm Pilot, Blackberry
or other similar product 14
83 3
April, 2002 11 87
2
April, 2000 5 91
4
c. A
DVD player 76 24
*
April, 2002 44 56
*
April, 2000 16 83
1
d. A
VCR 92 8
*
February, 1994 85
15 *
e. A
digital video recorder
like Tivo that
automatically records
TV programs you select 13
86 1
April, 2002 3 96
1
NO
Q.79
IF
EMPLOYED FULL-TIME OR PART-TIME, ASK [N=1926]:
Q.80 Is it important for your job that you keep
up with the news, or not?
31
Yes
68
No
1
Don’t Know/Refused
*****************************************************************************
PEW
RESEARCH CENTER FOR THE PEOPLE AND THE PRESS
MAY
2004 POLITICAL/BELIEVABILITY
FINAL
TOPLINE
May
3 - 9, 2004
N1
Q.23 Now, I'm going to read a list. Please rate how much you think you can
BELIEVE each organization I name on a
scale of 4 to 1. On this four point
scale, "4" means you can believe all or most of what the organization
says. "1" means you believe
almost nothing of what they say. How would you rate the believability of (READ
ITEM. RANDOMIZE LIST) on this scale of 4
to 1? (INTERVIEWERS: PROBE TO
DISTINGUISH BETWEEN "NEVER HEARD OF" AND "CAN'T RATE")
Believe Cannot Never
All or Most Believe Heard
Can't
1 2
3 4 of
Rate
a. USA Today
15 32 22
8 2 21
May, 2002 15 36
19 6 1
23
May, 2000 17 31
20 7 2
23
May, 1998 18 35
21 5 2
19
April, 1996 20 34
20 9 3
14
February,
1993 20 36
21 7 1
15
August, 1989 21 32
18 5 6
18
June, 1985 13 26
13 2 4
42
b. ABC News
22 36 24
9 * 9
May, 2002 22 43
19 6 *
10
May, 2000 26 36
20 6 *
12
May, 1998 28 43
18 4 *
7
April, 1996 30 44
17 5
* 4
February,
1993 34 42
17 4 *
3
August, 1989 30 46
14 3 1
7
June, 1985 32 51
11 1 *
5
c. The Wall Street Journal 18 31
17 8 1
25
May, 2002 22 29
11 4 1
33
May, 2000 27 24
9 6 4
30
May, 1998 30 30
9 4 2
25
April, 1996 28 29
13 7 3
20
February, 1993 30 32
14 6 2
16
August, 1989 30 26
9 3 6
26
June, 1985 25 23
6 2 1
43
d. The daily newspaper you
are most familiar with 17 33
30 12 *
8
May, 2002 20 39
25 9 0
7
May, 2000 23 38
24 8 *
7
May, 1998 27 36
24 7 *
6
April, 1996 24 37
26 8 *
5
February, 1993 22 41
25 8 *
4
August, 1989 26 41
24 7 *
2
June, 1985 28 52
13 2 *
5
e. The Associated Press 15 33
26 8 2
16
May, 2002 14 35
22 7 4
18
May, 2000 16 32 22
7 5 18
May, 1998 15 36
24 6 4
15
April, 1996 14 40
22 9 3
12
February,
1993 16
39 23 7
3 12
August, 1989 21 43
18 4 6
9
June, 1985 21 40
11 2 2
24
f. CNN 29 36
17 8 1
9
May, 2002 32 34
15 6 1
12
May, 2000 33 32
14 5 1
15
May, 1998 37 35
11 4 1
12
April, 1996 34 37
14 4 1
10
February,
1993 41 35
10 4 2
8
August, 1989 33 31
11 2 8
16
June, 1985 20 24
7 1 10
38
g. NBC News 22 39
24 9 *
6
May, 2002 23 43
19 6 *
9
May, 2000 26 37
21 7 *
9
May, 1998 28 42
20 4 *
6
April, 1996 28 46
18 5 *
3
February,
1993 31 42
18 6 *
3
August, 1989 32 47
14 2 *
5
June, 1985 31 51
12 1 *
5
h. CBS News
22 35 24
9 1 9
May, 2002 23 41
19 6 *
11
May, 2000 26 37
20 7 *
10
May, 1998 26 43
21 4 *
6
April, 1996 30 42
17 6 *
5
February,
1993 31 44
16 5 *
4
August, 1989 29 45
16 4 1
5
June, 1985 33 51
11 1 *
4
i. C-SPAN
20 28 18
7 4 23
May, 2002 18 26
12 5 8
31
May, 2000 21 24
11 6 10
28
May, 1998 20 26
12 4 12
26
April, 1996 19 24
12 9 10
26
j. Time Magazine 18 33
20 10 *
19
May, 2002 18 35
16 7 1
23
May, 2000 22 30
16 6 2
24
May, 1998 21 38
17 4 1
19
June, 1985 27 38 10
2 * 23
k. People Magazine 6 15
32 25 1
21
May, 2002 7 20
31 15 1
26
May, 2000 8 18
30 20 2
22
May, 1998 8 21
34 16 1
20
June, 1985 8 22
28 12 1
29
l. Newsweek 14 34
20 9 1
22
May, 2002 14 37
16 5 2
26
May, 2000 17 32
17 7 2
25
May, 1998 19 40
16 5 1
19
June, 1985 23 40
9 2 *
26
m. The National Enquirer 4 6
9 61 2
18
May, 2002 3 5
11 60 1
20
May, 2000 3 3
8 68 2
16
May, 1998 3
4 11 69
1 12
June, 1985 4 7
11 54 1
23
n. The NewsHour with Jim Lehrer 13 20
16 8 8
35
May, 2002 13 20
13 5 18
31
May, 2000 13 18
13 8 18
30
May, 1998 15 21
12 5 19
28
June, 1985 18 17
6 2 29
28
o. Your local TV news 23 36
27 9 *
5
May, 2002 26 39
22 7 *
6
May, 2000 30 39
19 6 *
6
May, 1998 32 38
19 6 *
4
June, 1985 34 47
13 1 *
5
NO ITEM p.
q. 60 Minutes 29 33
19 9 *
10
May, 2002 30 39
15 5 *
11
May, 2000 31 37
17 7 *
8
May, 1998 32 37
20 4 *
7
r. MSNBC
18 36 22
8 2
14
May, 2002 21 34
17 5 4
19
May, 2000 19 29
15 6 8
23
s. National Public Radio 17
25 22 12
3 21
May, 2002 16 28
20 7 6
23
May, 2000 16 21
18 8 13
24
May, 1998 13 34
17 7 7
22
NO ITEM t.
u. The Fox News CABLE Channel 21 33
23 9 1
13
May, 2002 19 34
20 6 2 19
May, 2000 19 28
19 9 3
22
v. U.S. News & World Report 19 32
20 6 2
21
May, 2002 18 33
14 5 4
26
w. The New York Times 16 31
18 10 2
23
==============================
==============================
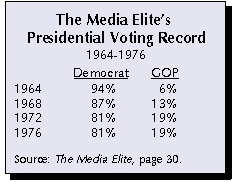
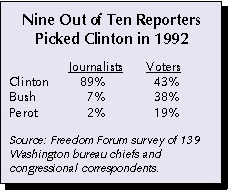
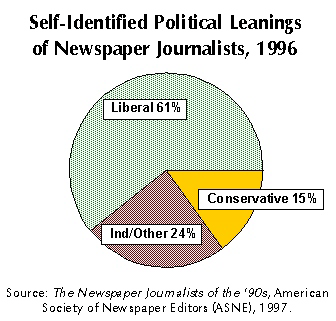
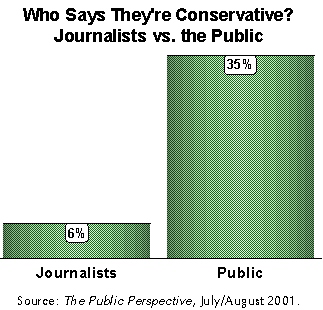
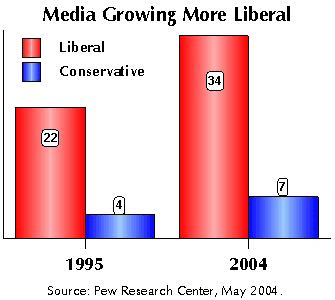
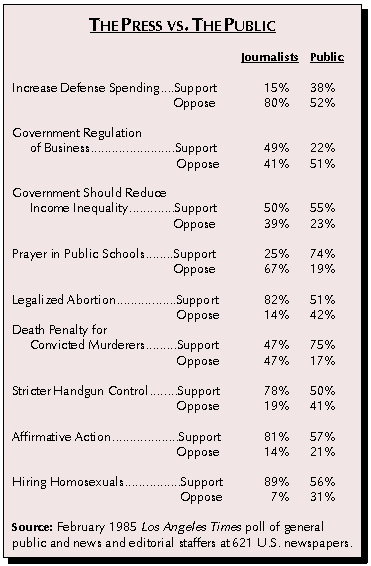
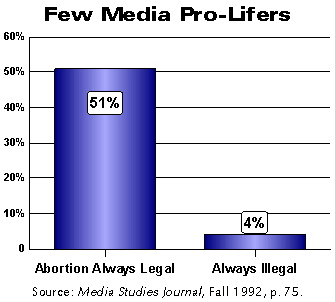
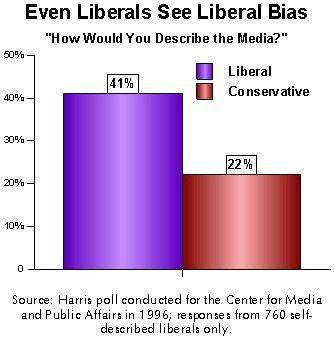
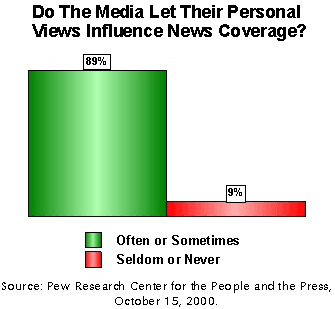
==============================